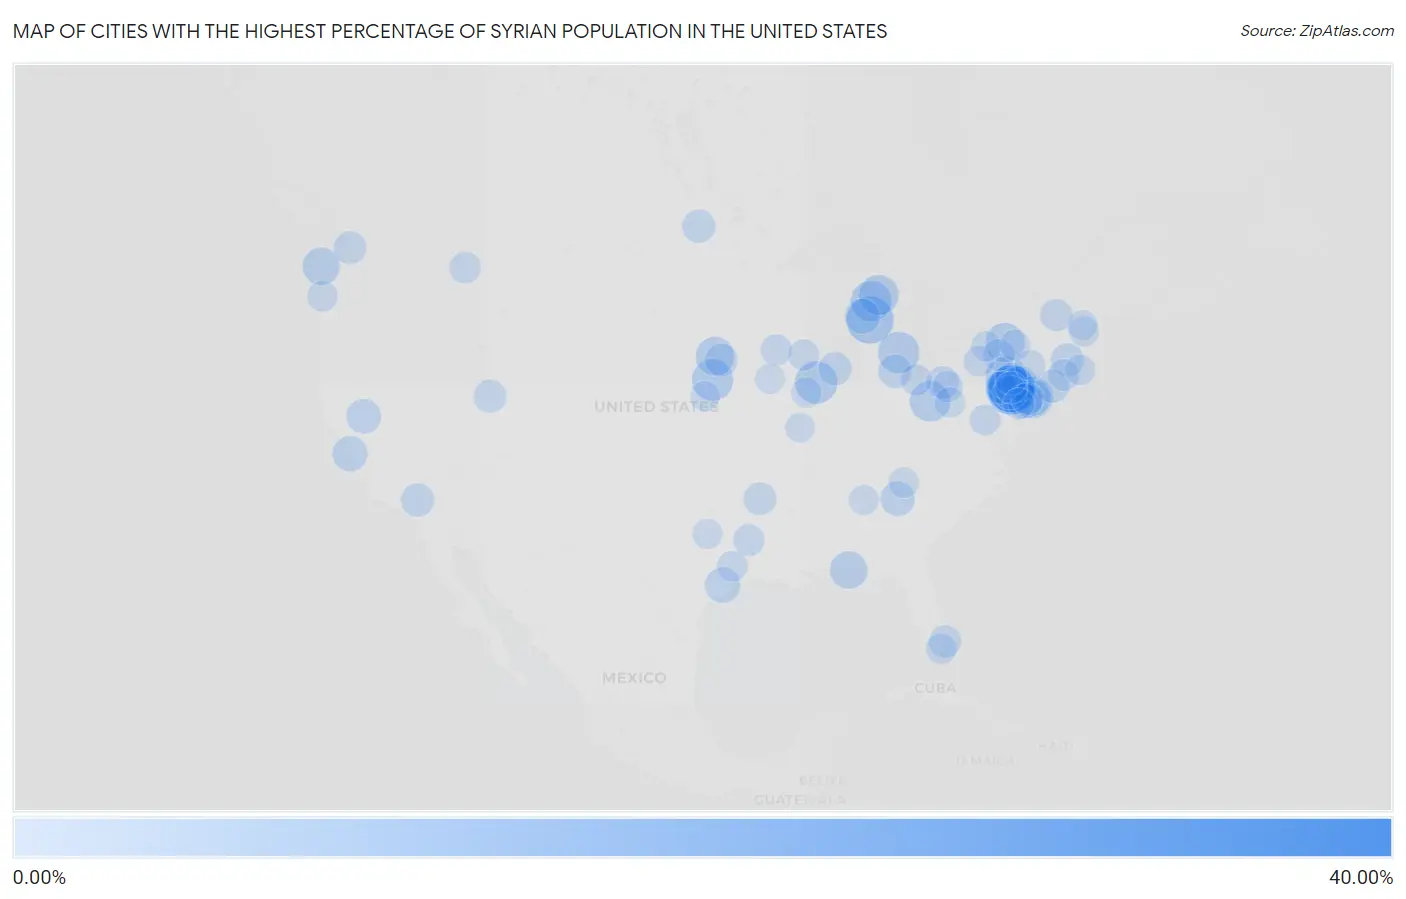
Cities with the Highest Percentage of Syrian Population in the United States
RELATED REPORTS & OPTIONS
Syrian
United States
Compare Cities
Map of Cities with the Highest Percentage of Syrian Population in the United States
0.00%
40.00%
Cities with the Highest Percentage of Syrian Population in the United States
| City | Syrian | vs State | vs National | |
| 1. | Hawleyville | 38.00% | 0.072%(+37.9)#1 | 0.059%(+37.9)#1 |
| 2. | Orient | 27.95% | 0.048%(+27.9)#1 | 0.059%(+27.9)#2 |
| 3. | Hokendauqua | 11.08% | 0.12%(+11.0)#1 | 0.059%(+11.0)#3 |
| 4. | Mcbride | 10.84% | 0.031%(+10.8)#1 | 0.059%(+10.8)#4 |
| 5. | Stiles | 10.67% | 0.12%(+10.5)#2 | 0.059%(+10.6)#5 |
| 6. | Haring | 10.15% | 0.12%(+10.0)#1 | 0.059%(+10.1)#6 |
| 7. | Egypt | 10.14% | 0.12%(+10.0)#3 | 0.059%(+10.1)#7 |
| 8. | Fullerton | 9.08% | 0.12%(+8.96)#4 | 0.059%(+9.02)#8 |
| 9. | Underhill Center | 8.93% | 0.054%(+8.87)#1 | 0.059%(+8.87)#9 |
| 10. | Deal Borough | 8.68% | 0.15%(+8.53)#1 | 0.059%(+8.62)#10 |
| 11. | Allenhurst Borough | 8.50% | 0.15%(+8.34)#2 | 0.059%(+8.44)#11 |
| 12. | Varna | 7.76% | 0.053%(+7.71)#1 | 0.059%(+7.70)#12 |
| 13. | Hilldale | 7.51% | 0.12%(+7.39)#5 | 0.059%(+7.45)#13 |
| 14. | Orchard Lake Village | 7.34% | 0.12%(+7.22)#2 | 0.059%(+7.29)#14 |
| 15. | Ithaca | 7.30% | 0.041%(+7.26)#1 | 0.059%(+7.24)#15 |
| 16. | Loch Arbour | 7.27% | 0.15%(+7.12)#3 | 0.059%(+7.21)#16 |
| 17. | Norwood | 7.05% | 0.12%(+6.93)#3 | 0.059%(+6.99)#17 |
| 18. | West Long Branch Borough | 7.03% | 0.15%(+6.88)#4 | 0.059%(+6.97)#18 |
| 19. | Fairview | 6.82% | 0.068%(+6.75)#1 | 0.059%(+6.76)#19 |
| 20. | Brutus | 6.64% | 0.12%(+6.51)#4 | 0.059%(+6.58)#20 |
| 21. | Bridgeport | 6.32% | 0.097%(+6.22)#1 | 0.059%(+6.26)#21 |
| 22. | Sergeant Bluff | 6.01% | 0.025%(+5.99)#1 | 0.059%(+5.95)#22 |
| 23. | Ohiopyle Borough | 5.88% | 0.12%(+5.76)#6 | 0.059%(+5.82)#23 |
| 24. | Ore Hill | 5.80% | 0.12%(+5.68)#7 | 0.059%(+5.74)#24 |
| 25. | Navarre Beach | 5.40% | 0.075%(+5.32)#1 | 0.059%(+5.34)#25 |
| 26. | Markham | 5.30% | 0.031%(+5.27)#1 | 0.059%(+5.24)#26 |
| 27. | Leetsdale Borough | 5.07% | 0.12%(+4.95)#8 | 0.059%(+5.01)#27 |
| 28. | Totowa Borough | 4.79% | 0.15%(+4.64)#5 | 0.059%(+4.73)#28 |
| 29. | Oakhurst | 4.78% | 0.15%(+4.63)#6 | 0.059%(+4.72)#29 |
| 30. | Fairchilds | 4.42% | 0.038%(+4.38)#1 | 0.059%(+4.36)#30 |
| 31. | Lexington Hills | 4.33% | 0.082%(+4.25)#1 | 0.059%(+4.27)#31 |
| 32. | Marksboro | 4.24% | 0.15%(+4.09)#7 | 0.059%(+4.18)#32 |
| 33. | Pluckemin | 4.21% | 0.15%(+4.05)#8 | 0.059%(+4.15)#33 |
| 34. | Copemish | 4.19% | 0.12%(+4.07)#5 | 0.059%(+4.13)#34 |
| 35. | New Egypt | 4.06% | 0.15%(+3.91)#9 | 0.059%(+4.00)#35 |
| 36. | Solsberry | 4.05% | 0.031%(+4.02)#1 | 0.059%(+4.00)#36 |
| 37. | Clarkesville | 4.03% | 0.028%(+4.00)#1 | 0.059%(+3.97)#37 |
| 38. | Grass Valley | 4.00% | 0.082%(+3.92)#2 | 0.059%(+3.94)#38 |
| 39. | Ancient Oaks | 3.50% | 0.12%(+3.38)#9 | 0.059%(+3.45)#39 |
| 40. | Ottawa Hills | 3.49% | 0.068%(+3.42)#2 | 0.059%(+3.43)#40 |
| 41. | Quiogue | 3.43% | 0.097%(+3.33)#2 | 0.059%(+3.37)#41 |
| 42. | Spring Valley Lake | 3.38% | 0.082%(+3.30)#3 | 0.059%(+3.32)#42 |
| 43. | Hamilton | 3.33% | 0.060%(+3.27)#1 | 0.059%(+3.27)#43 |
| 44. | Burr Ridge | 3.31% | 0.053%(+3.25)#2 | 0.059%(+3.25)#44 |
| 45. | Hopkinton | 3.31% | 0.093%(+3.21)#1 | 0.059%(+3.25)#45 |
| 46. | Mountain Pine | 3.27% | 0.020%(+3.25)#1 | 0.059%(+3.21)#46 |
| 47. | Cedar Fort | 3.25% | 0.026%(+3.22)#1 | 0.059%(+3.19)#47 |
| 48. | Smithland | 3.18% | 0.025%(+3.16)#2 | 0.059%(+3.13)#48 |
| 49. | High Bridge | 3.17% | 0.031%(+3.14)#2 | 0.059%(+3.11)#49 |
| 50. | West Easton Borough | 3.14% | 0.12%(+3.02)#10 | 0.059%(+3.08)#50 |
| 51. | Oakwood | 3.11% | 0.12%(+2.99)#11 | 0.059%(+3.05)#51 |
| 52. | Far Hills Borough | 2.96% | 0.15%(+2.81)#10 | 0.059%(+2.90)#52 |
| 53. | Golden Beach | 2.92% | 0.075%(+2.84)#2 | 0.059%(+2.86)#53 |
| 54. | Hardwick | 2.89% | 0.054%(+2.83)#2 | 0.059%(+2.83)#54 |
| 55. | Franklin Lakes Borough | 2.86% | 0.15%(+2.71)#11 | 0.059%(+2.80)#55 |
| 56. | Englewood | 2.86% | 0.12%(+2.74)#12 | 0.059%(+2.80)#56 |
| 57. | Ho Ho Kus Borough | 2.81% | 0.15%(+2.66)#12 | 0.059%(+2.75)#57 |
| 58. | Old Hill | 2.80% | 0.072%(+2.73)#2 | 0.059%(+2.74)#58 |
| 59. | Vista Center | 2.73% | 0.15%(+2.58)#13 | 0.059%(+2.67)#59 |
| 60. | Keansburg Borough | 2.63% | 0.15%(+2.48)#14 | 0.059%(+2.57)#60 |
| 61. | Keachi | 2.63% | 0.026%(+2.61)#1 | 0.059%(+2.57)#61 |
| 62. | Big Bass Lake | 2.61% | 0.12%(+2.48)#13 | 0.059%(+2.55)#62 |
| 63. | Ashaway | 2.59% | 0.20%(+2.39)#1 | 0.059%(+2.53)#63 |
| 64. | Cherryville | 2.58% | 0.12%(+2.46)#14 | 0.059%(+2.52)#64 |
| 65. | Bonner West Riverside | 2.58% | 0.0092%(+2.57)#1 | 0.059%(+2.52)#65 |
| 66. | Freeville | 2.56% | 0.097%(+2.47)#3 | 0.059%(+2.51)#66 |
| 67. | Conyngham Borough | 2.50% | 0.12%(+2.38)#15 | 0.059%(+2.45)#67 |
| 68. | North Industry | 2.46% | 0.068%(+2.40)#3 | 0.059%(+2.41)#68 |
| 69. | Westgate | 2.42% | 0.025%(+2.39)#3 | 0.059%(+2.36)#69 |
| 70. | Meridian | 2.37% | 0.12%(+2.25)#16 | 0.059%(+2.31)#70 |
| 71. | Pheasant Run | 2.36% | 0.068%(+2.30)#4 | 0.059%(+2.30)#71 |
| 72. | Ellisburg | 2.36% | 0.15%(+2.21)#15 | 0.059%(+2.30)#72 |
| 73. | Yatesville Borough | 2.30% | 0.12%(+2.18)#17 | 0.059%(+2.24)#73 |
| 74. | Apple River | 2.29% | 0.053%(+2.23)#3 | 0.059%(+2.23)#74 |
| 75. | Sugarland Run | 2.20% | 0.053%(+2.15)#1 | 0.059%(+2.14)#75 |
| 76. | Radisson | 2.18% | 0.097%(+2.09)#4 | 0.059%(+2.12)#76 |
| 77. | Preakness | 2.16% | 0.15%(+2.01)#16 | 0.059%(+2.10)#77 |
| 78. | Andover | 2.16% | 0.097%(+2.06)#5 | 0.059%(+2.10)#78 |
| 79. | Riverdale Borough | 2.16% | 0.15%(+2.01)#17 | 0.059%(+2.10)#79 |
| 80. | Coldspring | 2.13% | 0.038%(+2.09)#2 | 0.059%(+2.07)#80 |
| 81. | South Heights Borough | 2.10% | 0.12%(+1.98)#18 | 0.059%(+2.04)#81 |
| 82. | Netarts | 2.09% | 0.048%(+2.04)#2 | 0.059%(+2.03)#82 |
| 83. | Manchester | 2.09% | 0.097%(+1.99)#6 | 0.059%(+2.03)#83 |
| 84. | Rowes Run | 2.08% | 0.12%(+1.96)#19 | 0.059%(+2.02)#84 |
| 85. | Naranja | 2.08% | 0.075%(+2.01)#3 | 0.059%(+2.02)#85 |
| 86. | Chadwicks | 2.05% | 0.097%(+1.95)#7 | 0.059%(+1.99)#86 |
| 87. | South Windham | 2.04% | 0.040%(+2.00)#1 | 0.059%(+1.98)#87 |
| 88. | Powell | 2.02% | 0.021%(+2.00)#1 | 0.059%(+1.96)#88 |
| 89. | Shokan | 2.01% | 0.097%(+1.91)#8 | 0.059%(+1.95)#89 |
| 90. | Maggie Valley | 2.00% | 0.028%(+1.98)#1 | 0.059%(+1.95)#90 |
| 91. | Pocasset | 1.98% | 0.093%(+1.89)#2 | 0.059%(+1.92)#91 |
| 92. | Banner | 1.97% | 0.053%(+1.92)#4 | 0.059%(+1.91)#92 |
| 93. | Penbrook Borough | 1.97% | 0.12%(+1.85)#20 | 0.059%(+1.91)#93 |
| 94. | Arona Borough | 1.96% | 0.12%(+1.84)#21 | 0.059%(+1.90)#94 |
| 95. | Saugatuck | 1.93% | 0.072%(+1.86)#3 | 0.059%(+1.87)#95 |
| 96. | Glenn Heights | 1.92% | 0.038%(+1.88)#3 | 0.059%(+1.86)#96 |
| 97. | Plymouth | 1.89% | 0.041%(+1.85)#2 | 0.059%(+1.83)#97 |
| 98. | Fremont | 1.85% | 0.025%(+1.83)#4 | 0.059%(+1.79)#98 |
| 99. | Casco | 1.82% | 0.040%(+1.78)#2 | 0.059%(+1.76)#99 |
| 100. | Clayton | 1.80% | 0.043%(+1.75)#1 | 0.059%(+1.74)#100 |
Common Questions
What are the Top 10 Cities with the Highest Percentage of Syrian Population in the United States?
Top 10 Cities with the Highest Percentage of Syrian Population in the United States are:
What city has the Highest Percentage of Syrian Population in the United States?
Hokendauqua has the Highest Percentage of Syrian Population in the United States with 11.08%.
What is the Percentage of Syrian Population in the United States?
Percentage of Syrian Population in the United States is 0.059%.