Wellston, OH Map & Demographics
Wellston Map
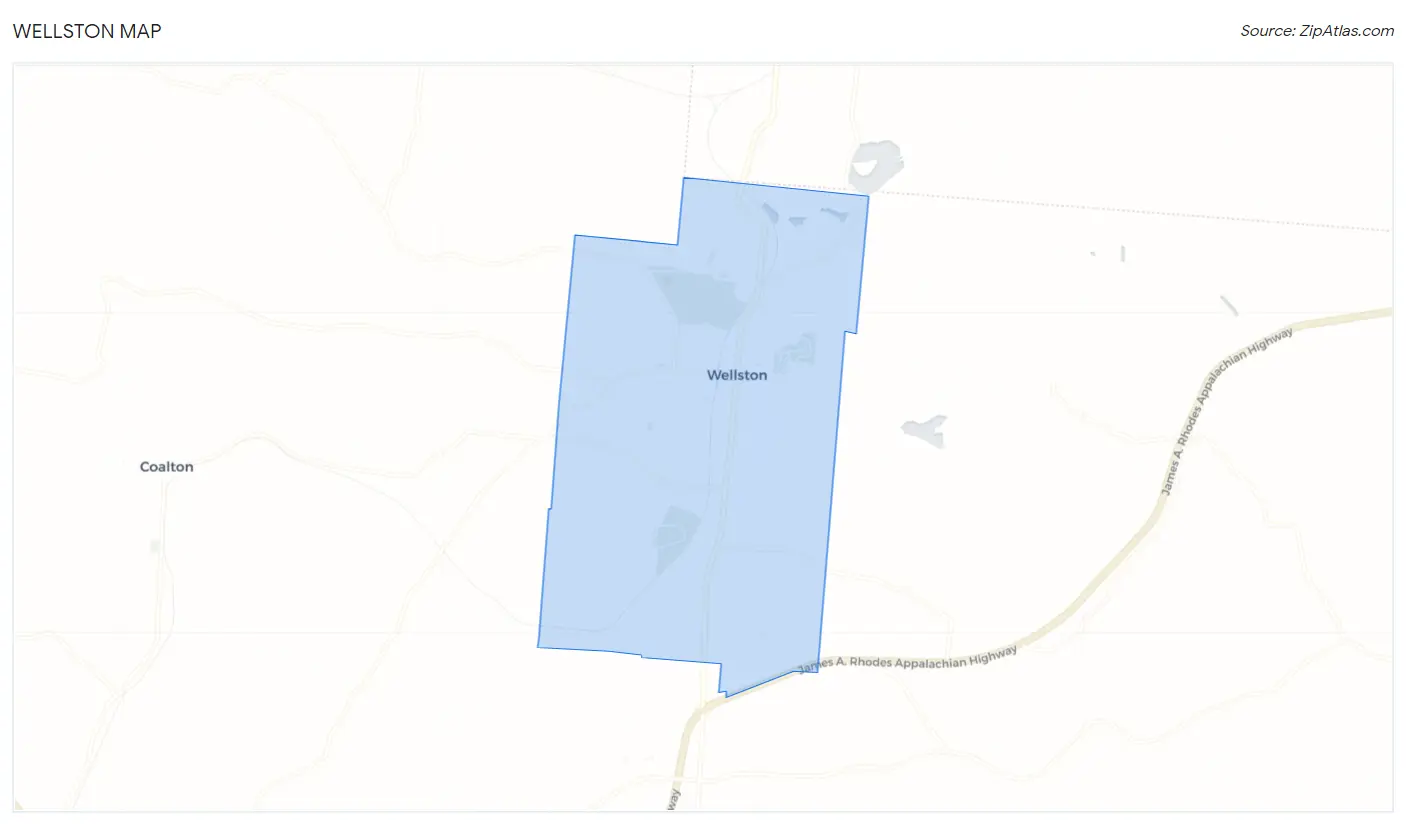
Wellston Overview
$25,489
PER CAPITA INCOME
$61,292
AVG FAMILY INCOME
$51,597
AVG HOUSEHOLD INCOME
31.6%
WAGE / INCOME GAP [ % ]
68.4¢/ $1
WAGE / INCOME GAP [ $ ]
$5,853
FAMILY INCOME DEFICIT
0.43
INEQUALITY / GINI INDEX
5,420
TOTAL POPULATION
2,472
MALE POPULATION
2,948
FEMALE POPULATION
83.85
MALES / 100 FEMALES
119.26
FEMALES / 100 MALES
38.8
MEDIAN AGE
2.7
AVG FAMILY SIZE
2.4
AVG HOUSEHOLD SIZE
2,199
LABOR FORCE [ PEOPLE ]
51.5%
PERCENT IN LABOR FORCE
5.6%
UNEMPLOYMENT RATE
Wellston Zip Codes
Wellston Area Codes
Income in Wellston
Income Overview in Wellston
Per Capita Income in Wellston is $25,489, while median incomes of families and households are $61,292 and $51,597 respectively.
| Characteristic | Number | Measure |
| Per Capita Income | 5,420 | $25,489 |
| Median Family Income | 1,464 | $61,292 |
| Mean Family Income | 1,464 | $74,492 |
| Median Household Income | 2,211 | $51,597 |
| Mean Household Income | 2,211 | $60,503 |
| Income Deficit | 1,464 | $5,853 |
| Wage / Income Gap (%) | 5,420 | 31.60% |
| Wage / Income Gap ($) | 5,420 | 68.40¢ per $1 |
| Gini / Inequality Index | 5,420 | 0.43 |
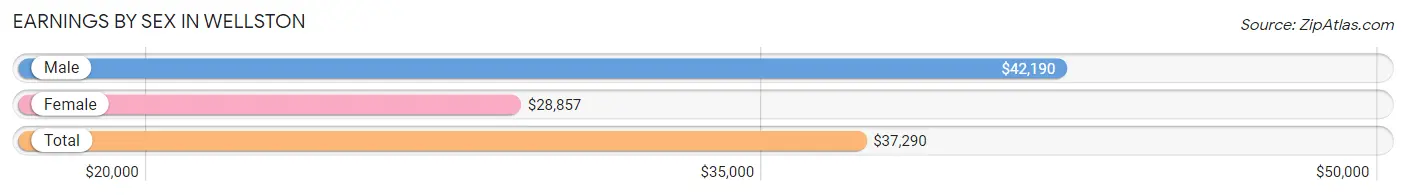
Earnings by Sex in Wellston
Average Earnings in Wellston are $37,290, $42,190 for men and $28,857 for women, a difference of 31.6%.
| Sex | Number | Average Earnings |
| Male | 1,193 (51.7%) | $42,190 |
| Female | 1,113 (48.3%) | $28,857 |
| Total | 2,306 (100.0%) | $37,290 |
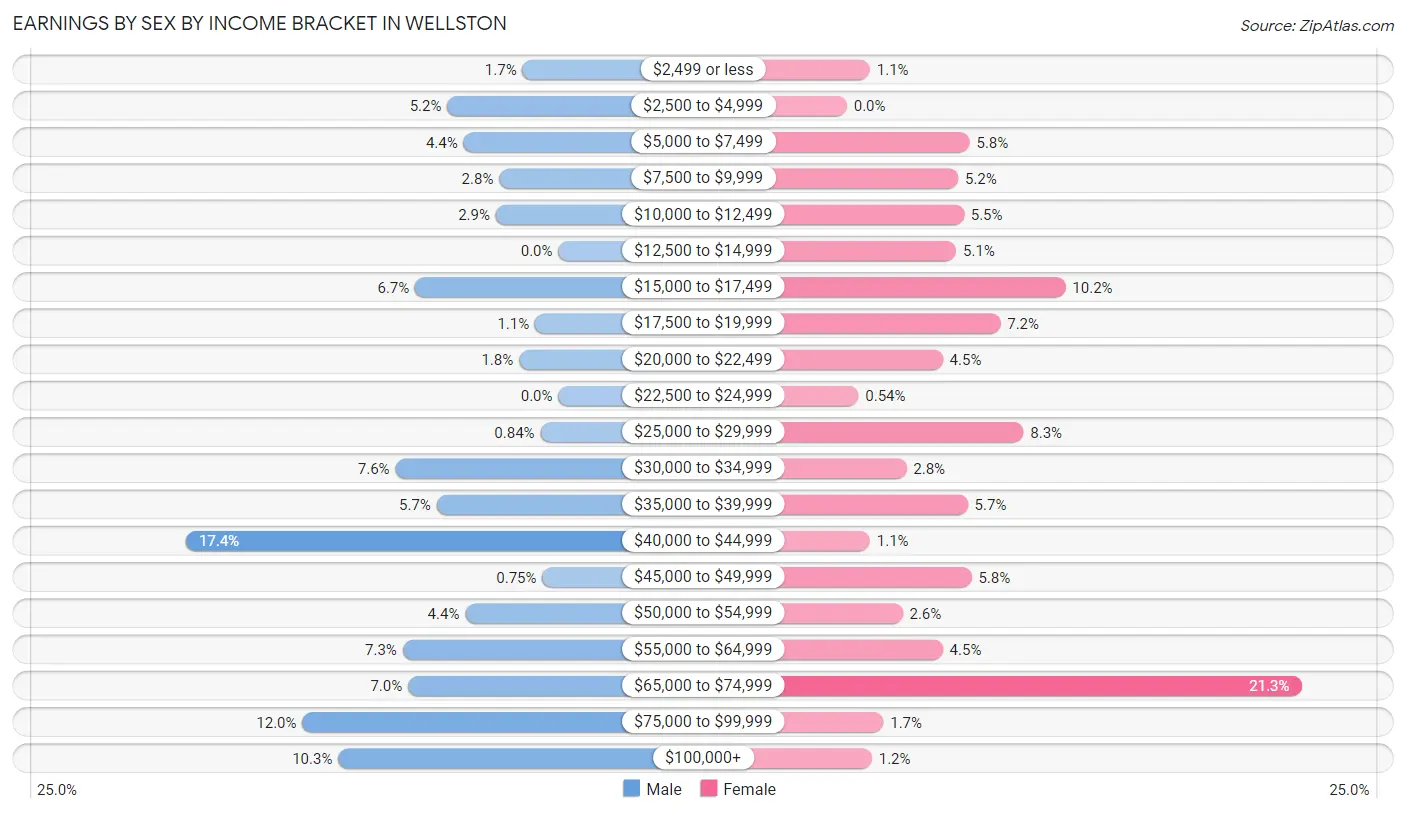
Earnings by Sex by Income Bracket in Wellston
The most common earnings brackets in Wellston are $40,000 to $44,999 for men (208 | 17.4%) and $65,000 to $74,999 for women (237 | 21.3%).
| Income | Male | Female |
| $2,499 or less | 20 (1.7%) | 12 (1.1%) |
| $2,500 to $4,999 | 62 (5.2%) | 0 (0.0%) |
| $5,000 to $7,499 | 53 (4.4%) | 64 (5.8%) |
| $7,500 to $9,999 | 33 (2.8%) | 58 (5.2%) |
| $10,000 to $12,499 | 35 (2.9%) | 61 (5.5%) |
| $12,500 to $14,999 | 0 (0.0%) | 57 (5.1%) |
| $15,000 to $17,499 | 80 (6.7%) | 114 (10.2%) |
| $17,500 to $19,999 | 13 (1.1%) | 80 (7.2%) |
| $20,000 to $22,499 | 22 (1.8%) | 50 (4.5%) |
| $22,500 to $24,999 | 0 (0.0%) | 6 (0.5%) |
| $25,000 to $29,999 | 10 (0.8%) | 92 (8.3%) |
| $30,000 to $34,999 | 91 (7.6%) | 31 (2.8%) |
| $35,000 to $39,999 | 68 (5.7%) | 63 (5.7%) |
| $40,000 to $44,999 | 208 (17.4%) | 12 (1.1%) |
| $45,000 to $49,999 | 9 (0.7%) | 65 (5.8%) |
| $50,000 to $54,999 | 52 (4.4%) | 29 (2.6%) |
| $55,000 to $64,999 | 87 (7.3%) | 50 (4.5%) |
| $65,000 to $74,999 | 84 (7.0%) | 237 (21.3%) |
| $75,000 to $99,999 | 143 (12.0%) | 19 (1.7%) |
| $100,000+ | 123 (10.3%) | 13 (1.2%) |
| Total | 1,193 (100.0%) | 1,113 (100.0%) |
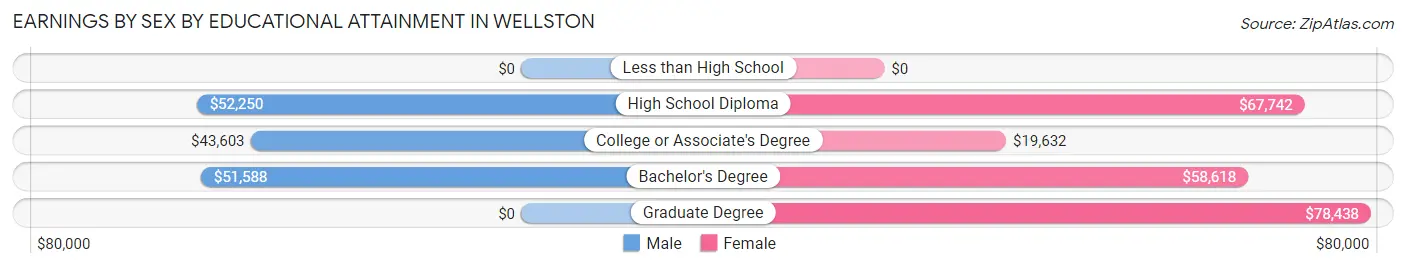
Earnings by Sex by Educational Attainment in Wellston
Average earnings in Wellston are $44,563 for men and $35,022 for women, a difference of 21.4%. Men with an educational attainment of high school diploma enjoy the highest average annual earnings of $52,250, while those with college or associate's degree education earn the least with $43,603. Women with an educational attainment of graduate degree earn the most with the average annual earnings of $78,438, while those with college or associate's degree education have the smallest earnings of $19,632.
| Educational Attainment | Male Income | Female Income |
| Less than High School | - | - |
| High School Diploma | $52,250 | $67,742 |
| College or Associate's Degree | $43,603 | $19,632 |
| Bachelor's Degree | $51,588 | $58,618 |
| Graduate Degree | - | - |
| Total | $44,563 | $35,022 |
Family Income in Wellston
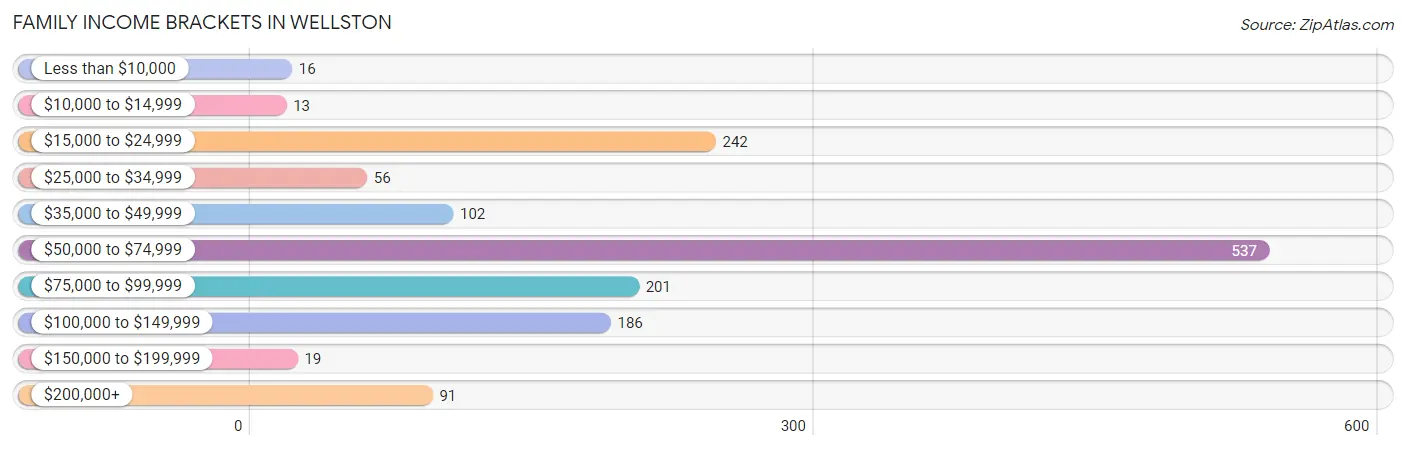
Family Income Brackets in Wellston
According to the Wellston family income data, there are 537 families falling into the $50,000 to $74,999 income range, which is the most common income bracket and makes up 36.7% of all families. Conversely, the $10,000 to $14,999 income bracket is the least frequent group with only 13 families (0.9%) belonging to this category.
| Income Bracket | # Families | % Families |
| Less than $10,000 | 16 | 1.1% |
| $10,000 to $14,999 | 13 | 0.9% |
| $15,000 to $24,999 | 242 | 16.5% |
| $25,000 to $34,999 | 56 | 3.8% |
| $35,000 to $49,999 | 102 | 7.0% |
| $50,000 to $74,999 | 537 | 36.7% |
| $75,000 to $99,999 | 201 | 13.7% |
| $100,000 to $149,999 | 186 | 12.7% |
| $150,000 to $199,999 | 19 | 1.3% |
| $200,000+ | 91 | 6.2% |
Family Income by Famaliy Size in Wellston
4-person families (99 | 6.8%) account for the highest median family income in Wellston with $72,873 per family, while 2-person families (861 | 58.8%) have the highest median income of $30,552 per family member.
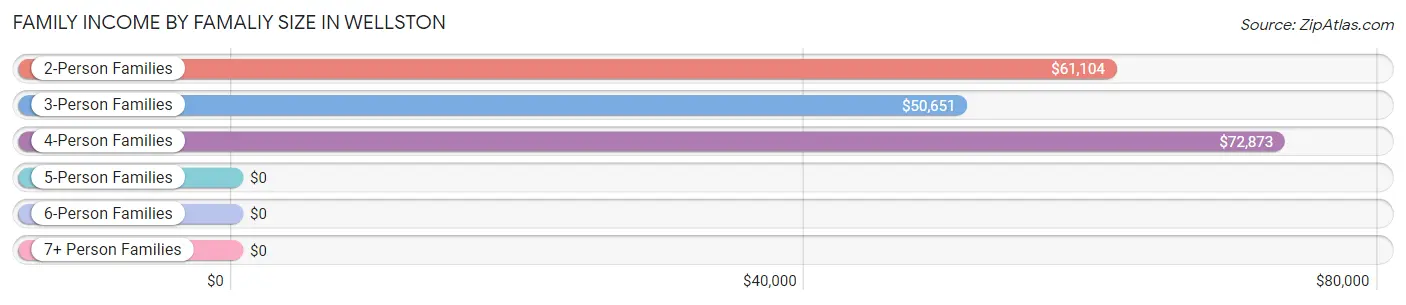
| Income Bracket | # Families | Median Income |
| 2-Person Families | 861 (58.8%) | $61,104 |
| 3-Person Families | 369 (25.2%) | $50,651 |
| 4-Person Families | 99 (6.8%) | $72,873 |
| 5-Person Families | 63 (4.3%) | $0 |
| 6-Person Families | 53 (3.6%) | $0 |
| 7+ Person Families | 19 (1.3%) | $0 |
| Total | 1,464 (100.0%) | $61,292 |
Family Income by Number of Earners in Wellston
The median family income in Wellston is $61,292, with families comprising 2 earners (407) having the highest median family income of $113,750, while families with no earners (284) have the lowest median family income of $42,935, accounting for 27.8% and 19.4% of families, respectively.
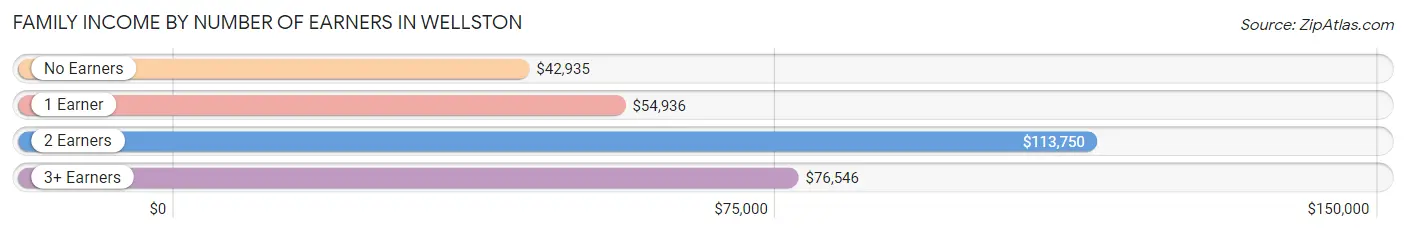
| Number of Earners | # Families | Median Income |
| No Earners | 284 (19.4%) | $42,935 |
| 1 Earner | 664 (45.4%) | $54,936 |
| 2 Earners | 407 (27.8%) | $113,750 |
| 3+ Earners | 109 (7.4%) | $76,546 |
| Total | 1,464 (100.0%) | $61,292 |
Household Income in Wellston
Household Income Brackets in Wellston
With 506 households falling in the category, the $50,000 to $74,999 income range is the most frequent in Wellston, accounting for 22.9% of all households. In contrast, only 20 households (0.9%) fall into the $150,000 to $199,999 income bracket, making it the least populous group.
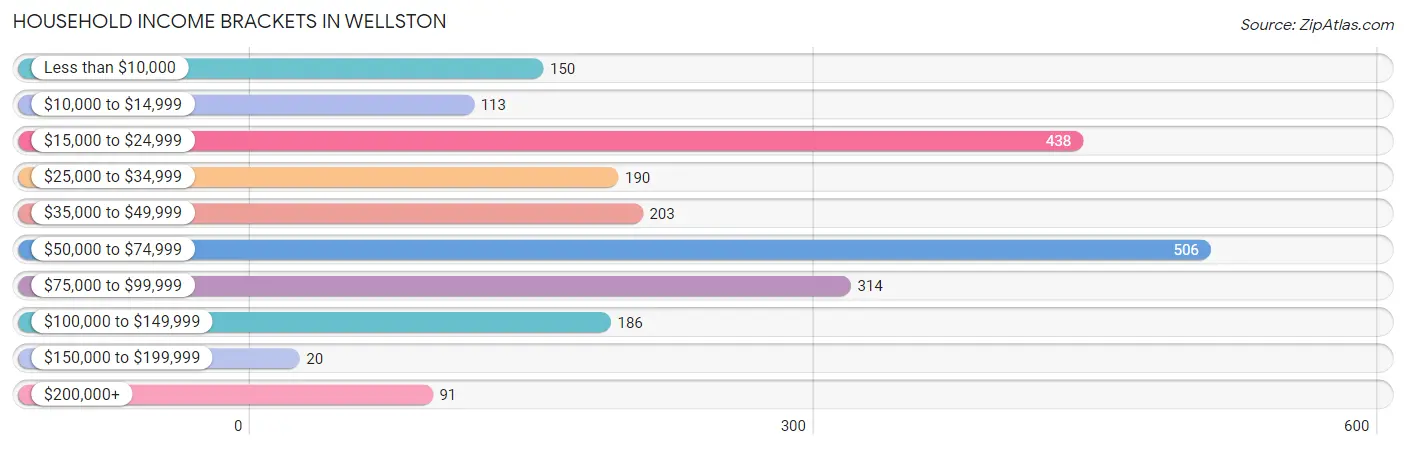
| Income Bracket | # Households | % Households |
| Less than $10,000 | 150 | 6.8% |
| $10,000 to $14,999 | 113 | 5.1% |
| $15,000 to $24,999 | 438 | 19.8% |
| $25,000 to $34,999 | 190 | 8.6% |
| $35,000 to $49,999 | 203 | 9.2% |
| $50,000 to $74,999 | 506 | 22.9% |
| $75,000 to $99,999 | 314 | 14.2% |
| $100,000 to $149,999 | 186 | 8.4% |
| $150,000 to $199,999 | 20 | 0.9% |
| $200,000+ | 91 | 4.1% |
Household Income by Householder Age in Wellston
The median household income in Wellston is $51,597, with the highest median household income of $72,333 found in the 25 to 44 years age bracket for the primary householder. A total of 678 households (30.7%) fall into this category. Meanwhile, the 15 to 24 years age bracket for the primary householder has the lowest median household income of $0, with 35 households (1.6%) in this group.
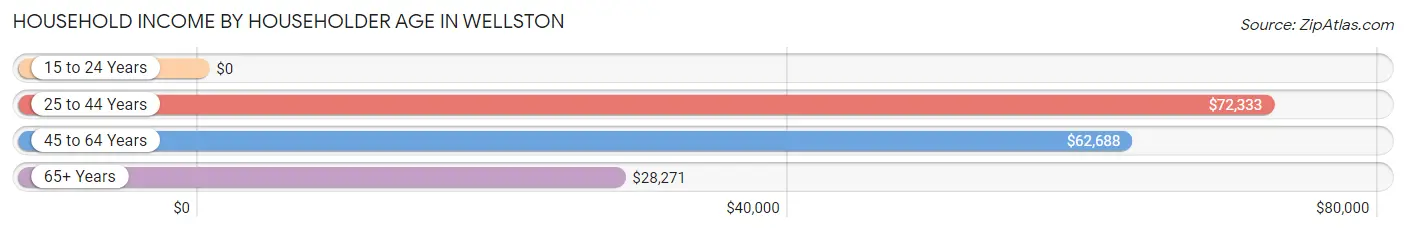
| Income Bracket | # Households | Median Income |
| 15 to 24 Years | 35 (1.6%) | $0 |
| 25 to 44 Years | 678 (30.7%) | $72,333 |
| 45 to 64 Years | 793 (35.9%) | $62,688 |
| 65+ Years | 705 (31.9%) | $28,271 |
| Total | 2,211 (100.0%) | $51,597 |
Poverty in Wellston
Income Below Poverty by Sex and Age in Wellston
With 18.5% poverty level for males and 25.4% for females among the residents of Wellston, under 5 year old males and 75 year old and over females are the most vulnerable to poverty, with 50 males (92.6%) and 130 females (59.6%) in their respective age groups living below the poverty level.
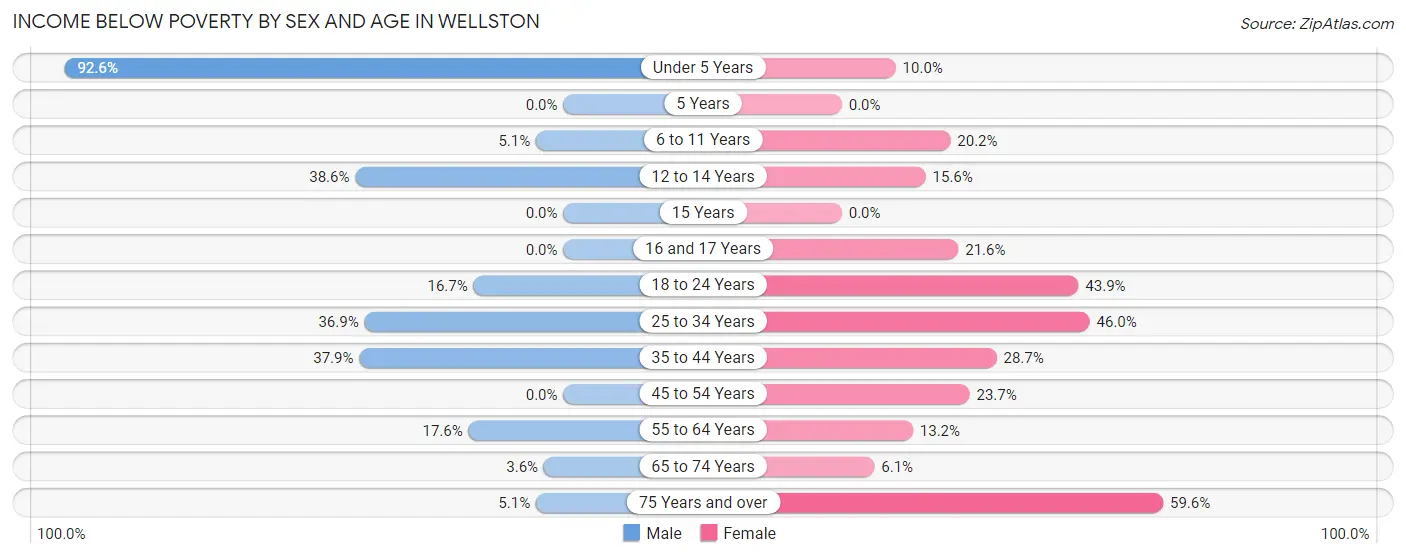
| Age Bracket | Male | Female |
| Under 5 Years | 50 (92.6%) | 14 (10.0%) |
| 5 Years | 0 (0.0%) | 0 (0.0%) |
| 6 to 11 Years | 14 (5.1%) | 55 (20.2%) |
| 12 to 14 Years | 39 (38.6%) | 14 (15.6%) |
| 15 Years | 0 (0.0%) | 0 (0.0%) |
| 16 and 17 Years | 0 (0.0%) | 32 (21.6%) |
| 18 to 24 Years | 34 (16.7%) | 65 (43.9%) |
| 25 to 34 Years | 110 (36.9%) | 138 (46.0%) |
| 35 to 44 Years | 111 (37.9%) | 114 (28.7%) |
| 45 to 54 Years | 0 (0.0%) | 79 (23.7%) |
| 55 to 64 Years | 51 (17.6%) | 48 (13.2%) |
| 65 to 74 Years | 10 (3.6%) | 24 (6.0%) |
| 75 Years and over | 3 (5.1%) | 130 (59.6%) |
| Total | 422 (18.5%) | 713 (25.4%) |
Income Above Poverty by Sex and Age in Wellston
According to the poverty statistics in Wellston, males aged 16 and 17 years and females aged 65 to 74 years are the age groups that are most secure financially, with 100.0% of males and 94.0% of females in these age groups living above the poverty line.
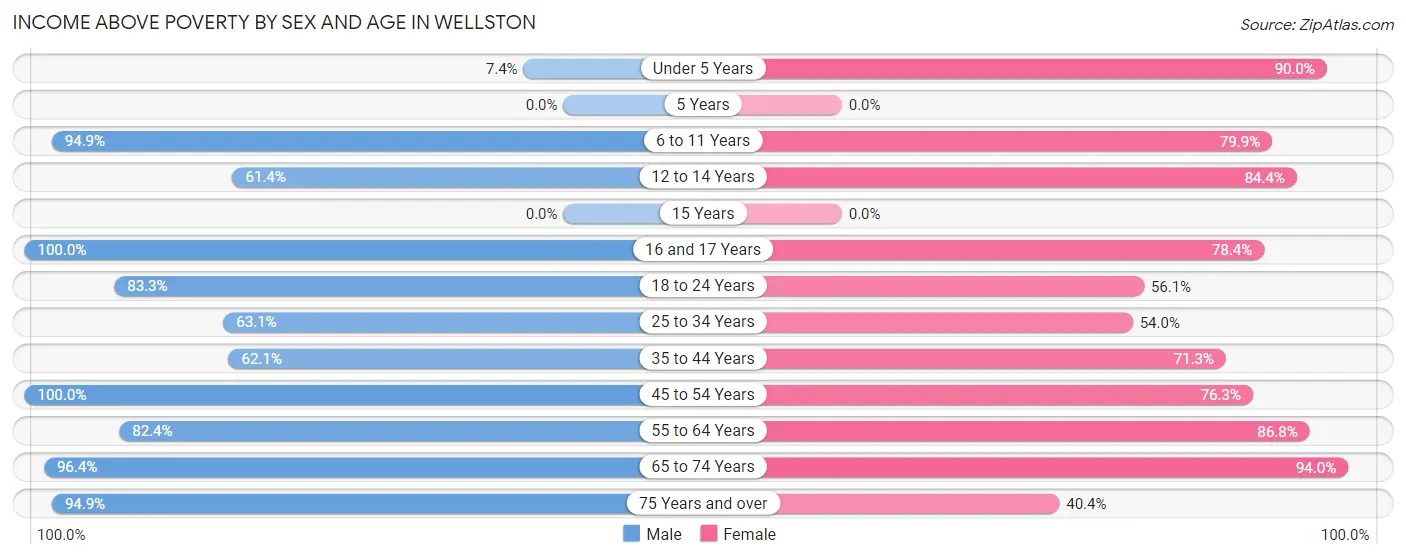
| Age Bracket | Male | Female |
| Under 5 Years | 4 (7.4%) | 126 (90.0%) |
| 5 Years | 0 (0.0%) | 0 (0.0%) |
| 6 to 11 Years | 262 (94.9%) | 218 (79.8%) |
| 12 to 14 Years | 62 (61.4%) | 76 (84.4%) |
| 15 Years | 0 (0.0%) | 0 (0.0%) |
| 16 and 17 Years | 97 (100.0%) | 116 (78.4%) |
| 18 to 24 Years | 170 (83.3%) | 83 (56.1%) |
| 25 to 34 Years | 188 (63.1%) | 162 (54.0%) |
| 35 to 44 Years | 182 (62.1%) | 283 (71.3%) |
| 45 to 54 Years | 336 (100.0%) | 254 (76.3%) |
| 55 to 64 Years | 239 (82.4%) | 316 (86.8%) |
| 65 to 74 Years | 268 (96.4%) | 373 (94.0%) |
| 75 Years and over | 56 (94.9%) | 88 (40.4%) |
| Total | 1,864 (81.5%) | 2,095 (74.6%) |
Income Below Poverty Among Married-Couple Families in Wellston
The poverty statistics for married-couple families in Wellston show that 11.7% or 92 of the total 789 families live below the poverty line. Families with 1 or 2 children have the highest poverty rate of 44.3%, comprising of 89 families. On the other hand, families with 3 or 4 children have the lowest poverty rate of 0.0%, which includes 0 families.
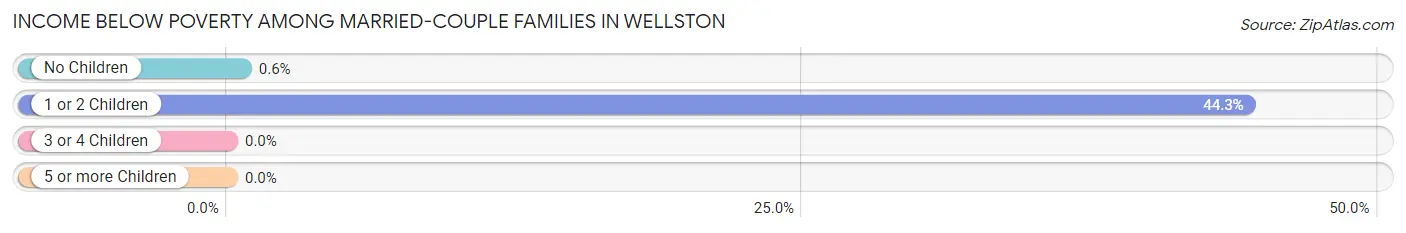
| Children | Above Poverty | Below Poverty |
| No Children | 496 (99.4%) | 3 (0.6%) |
| 1 or 2 Children | 112 (55.7%) | 89 (44.3%) |
| 3 or 4 Children | 70 (100.0%) | 0 (0.0%) |
| 5 or more Children | 19 (100.0%) | 0 (0.0%) |
| Total | 697 (88.3%) | 92 (11.7%) |
Income Below Poverty Among Single-Parent Households in Wellston
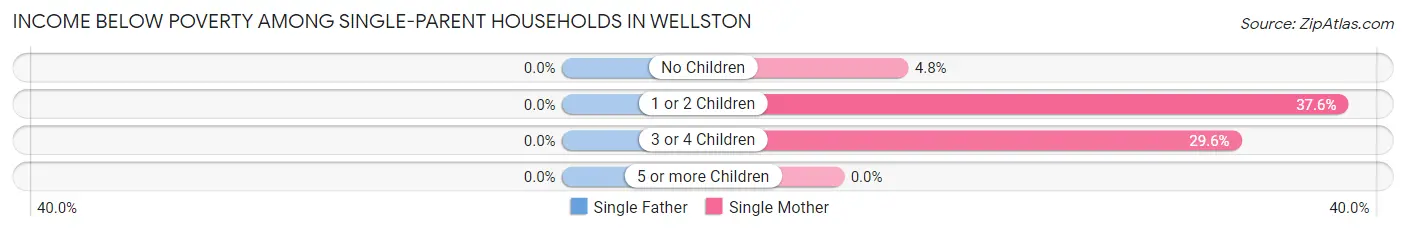
| Children | Single Father | Single Mother |
| No Children | 0 (0.0%) | 10 (4.8%) |
| 1 or 2 Children | 0 (0.0%) | 109 (37.6%) |
| 3 or 4 Children | 0 (0.0%) | 16 (29.6%) |
| 5 or more Children | 0 (0.0%) | 0 (0.0%) |
| Total | 0 (0.0%) | 135 (24.4%) |
Income Below Poverty Among Married-Couple vs Single-Parent Households in Wellston
The poverty data for Wellston shows that 92 of the married-couple family households (11.7%) and 135 of the single-parent households (20.0%) are living below the poverty level. Within the married-couple family households, those with 1 or 2 children have the highest poverty rate, with 89 households (44.3%) falling below the poverty line. Among the single-parent households, those with 1 or 2 children have the highest poverty rate, with 109 household (30.5%) living below poverty.
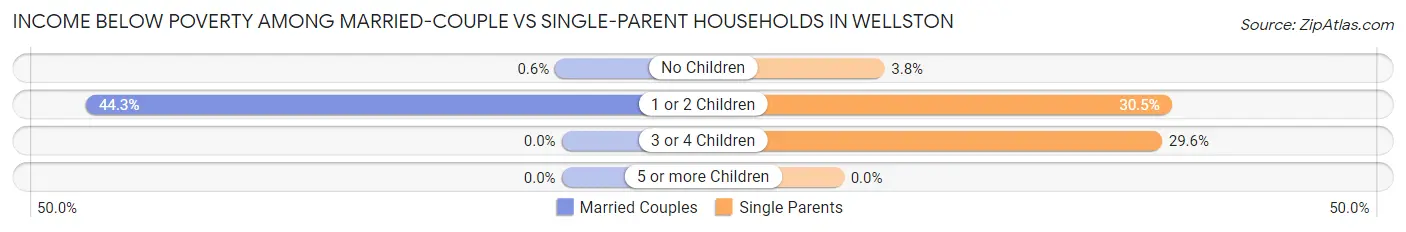
| Children | Married-Couple Families | Single-Parent Households |
| No Children | 3 (0.6%) | 10 (3.8%) |
| 1 or 2 Children | 89 (44.3%) | 109 (30.5%) |
| 3 or 4 Children | 0 (0.0%) | 16 (29.6%) |
| 5 or more Children | 0 (0.0%) | 0 (0.0%) |
| Total | 92 (11.7%) | 135 (20.0%) |
Race in Wellston
The most populous races in Wellston are White / Caucasian (5,290 | 97.6%), Two or more Races (128 | 2.4%), and Hispanic or Latino (35 | 0.6%).
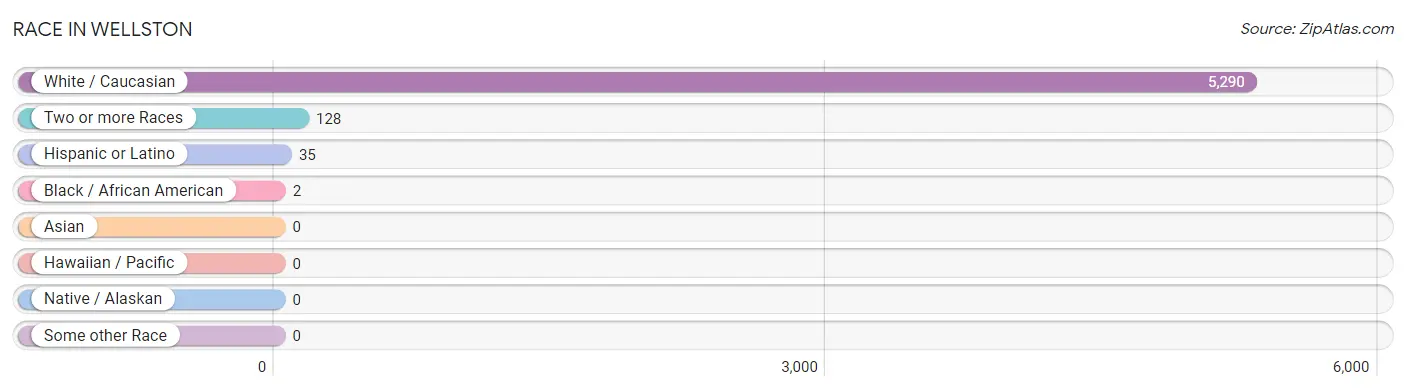
| Race | # Population | % Population |
| Asian | 0 | 0.0% |
| Black / African American | 2 | 0.0% |
| Hawaiian / Pacific | 0 | 0.0% |
| Hispanic or Latino | 35 | 0.6% |
| Native / Alaskan | 0 | 0.0% |
| White / Caucasian | 5,290 | 97.6% |
| Two or more Races | 128 | 2.4% |
| Some other Race | 0 | 0.0% |
| Total | 5,420 | 100.0% |
Ancestry in Wellston
The most populous ancestries reported in Wellston are German (689 | 12.7%), English (467 | 8.6%), Irish (405 | 7.5%), American (372 | 6.9%), and European (142 | 2.6%), together accounting for 38.3% of all Wellston residents.
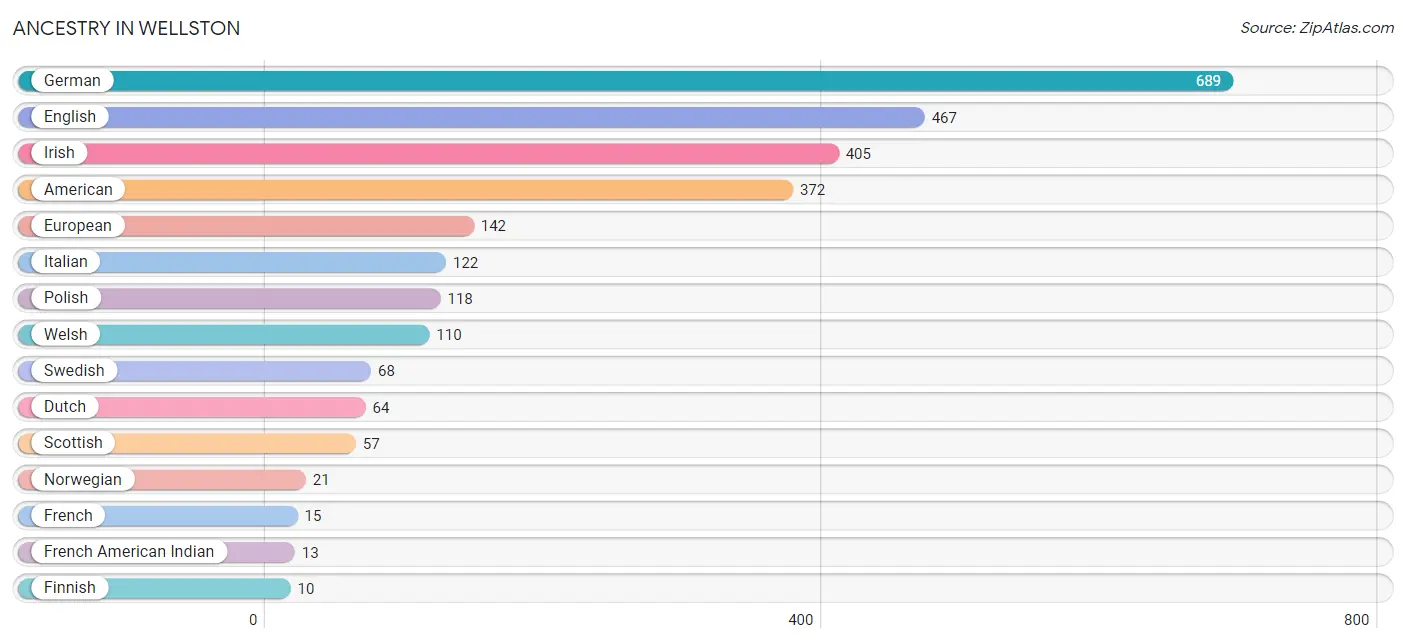
| Ancestry | # Population | % Population |
| American | 372 | 6.9% |
| Dutch | 64 | 1.2% |
| English | 467 | 8.6% |
| European | 142 | 2.6% |
| Finnish | 10 | 0.2% |
| French | 15 | 0.3% |
| French American Indian | 13 | 0.2% |
| German | 689 | 12.7% |
| Irish | 405 | 7.5% |
| Italian | 122 | 2.2% |
| Northern European | 6 | 0.1% |
| Norwegian | 21 | 0.4% |
| Polish | 118 | 2.2% |
| Scotch-Irish | 5 | 0.1% |
| Scottish | 57 | 1.1% |
| Swedish | 68 | 1.3% |
| Welsh | 110 | 2.0% | View All 17 Rows |
Immigrants in Wellston
The most numerous immigrant groups reported in Wellston came from Latin America (35 | 0.6%), Peru (35 | 0.6%), and South America (35 | 0.6%), together accounting for 1.9% of all Wellston residents.
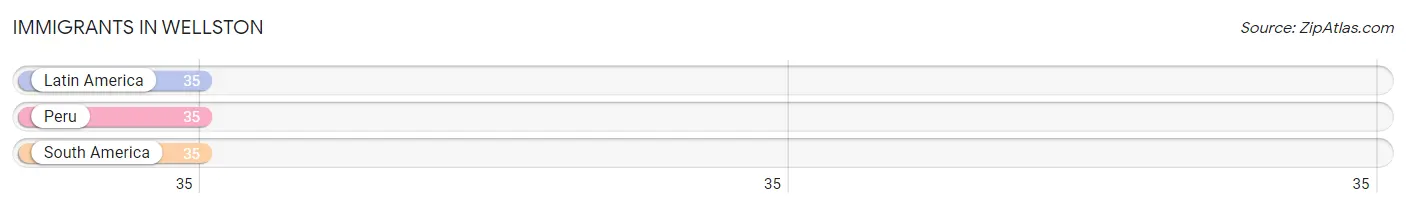
| Immigration Origin | # Population | % Population |
| Latin America | 35 | 0.6% |
| Peru | 35 | 0.6% |
| South America | 35 | 0.6% | View All 3 Rows |
Sex and Age in Wellston
Sex and Age in Wellston
The most populous age groups in Wellston are 5 to 9 Years (321 | 13.0%) for men and 60 to 64 Years (271 | 9.2%) for women.
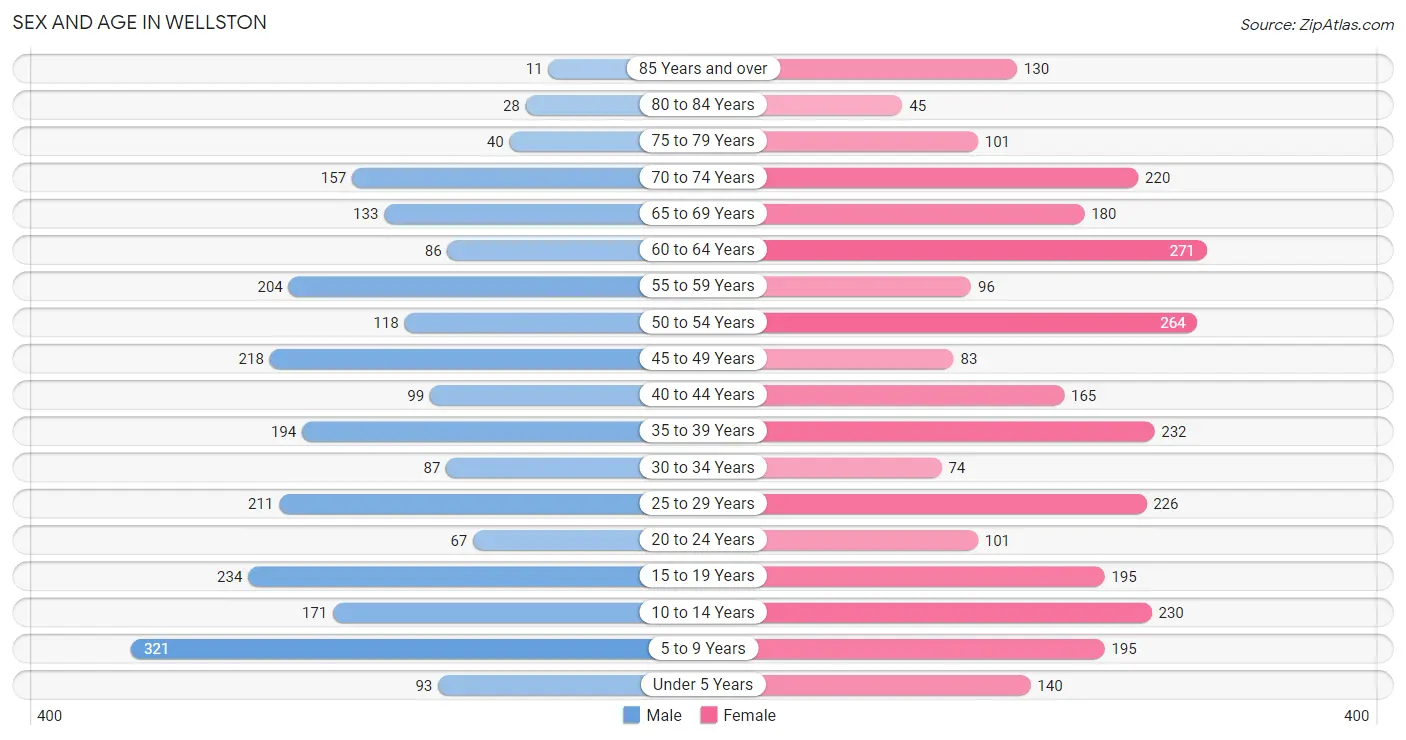
| Age Bracket | Male | Female |
| Under 5 Years | 93 (3.8%) | 140 (4.8%) |
| 5 to 9 Years | 321 (13.0%) | 195 (6.6%) |
| 10 to 14 Years | 171 (6.9%) | 230 (7.8%) |
| 15 to 19 Years | 234 (9.5%) | 195 (6.6%) |
| 20 to 24 Years | 67 (2.7%) | 101 (3.4%) |
| 25 to 29 Years | 211 (8.5%) | 226 (7.7%) |
| 30 to 34 Years | 87 (3.5%) | 74 (2.5%) |
| 35 to 39 Years | 194 (7.9%) | 232 (7.9%) |
| 40 to 44 Years | 99 (4.0%) | 165 (5.6%) |
| 45 to 49 Years | 218 (8.8%) | 83 (2.8%) |
| 50 to 54 Years | 118 (4.8%) | 264 (9.0%) |
| 55 to 59 Years | 204 (8.3%) | 96 (3.3%) |
| 60 to 64 Years | 86 (3.5%) | 271 (9.2%) |
| 65 to 69 Years | 133 (5.4%) | 180 (6.1%) |
| 70 to 74 Years | 157 (6.4%) | 220 (7.5%) |
| 75 to 79 Years | 40 (1.6%) | 101 (3.4%) |
| 80 to 84 Years | 28 (1.1%) | 45 (1.5%) |
| 85 Years and over | 11 (0.4%) | 130 (4.4%) |
| Total | 2,472 (100.0%) | 2,948 (100.0%) |
Families and Households in Wellston
Median Family Size in Wellston
The median family size in Wellston is 2.66 persons per family, with married-couple families (789 | 53.9%) accounting for the largest median family size of 2.69 persons per family. On the other hand, single male/father families (122 | 8.3%) represent the smallest median family size with 2.42 persons per family.
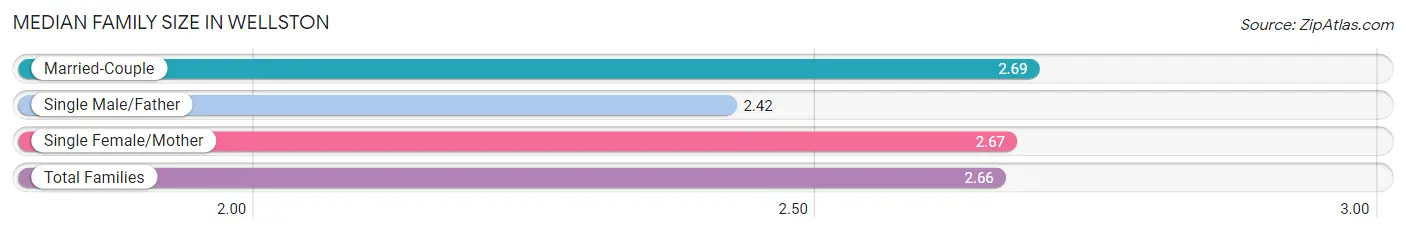
| Family Type | # Families | Family Size |
| Married-Couple | 789 (53.9%) | 2.69 |
| Single Male/Father | 122 (8.3%) | 2.42 |
| Single Female/Mother | 553 (37.8%) | 2.67 |
| Total Families | 1,464 (100.0%) | 2.66 |
Median Household Size in Wellston
The median household size in Wellston is 2.40 persons per household, with single male/father households (122 | 5.5%) accounting for the largest median household size of 4.14 persons per household. non-family households (747 | 33.8%) represent the smallest median household size with 1.46 persons per household.
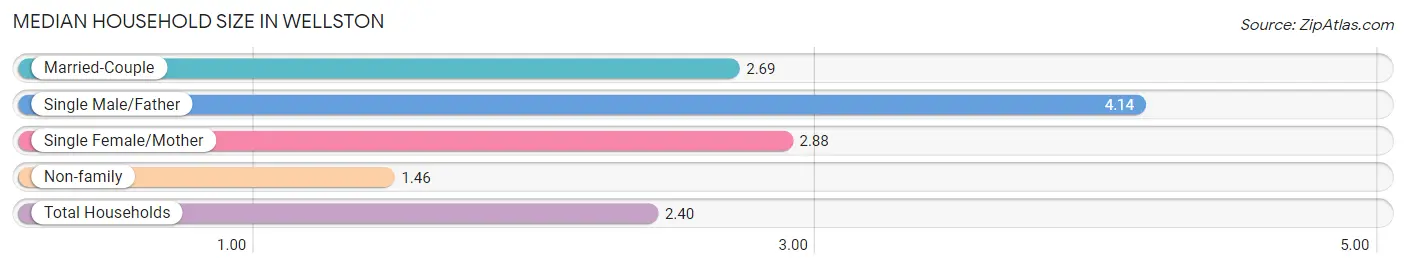
| Household Type | # Households | Household Size |
| Married-Couple | 789 (35.7%) | 2.69 |
| Single Male/Father | 122 (5.5%) | 4.14 |
| Single Female/Mother | 553 (25.0%) | 2.88 |
| Non-family | 747 (33.8%) | 1.46 |
| Total Households | 2,211 (100.0%) | 2.40 |
Household Size by Marriage Status in Wellston
Out of a total of 2,211 households in Wellston, 1,464 (66.2%) are family households, while 747 (33.8%) are nonfamily households. The most numerous type of family households are 2-person households, comprising 766, and the most common type of nonfamily households are 1-person households, comprising 606.
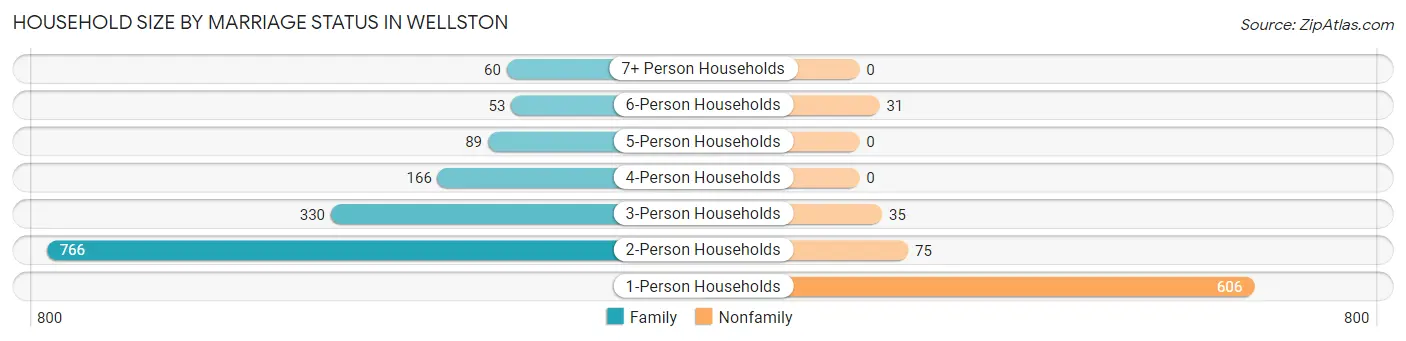
| Household Size | Family Households | Nonfamily Households |
| 1-Person Households | - | 606 (27.4%) |
| 2-Person Households | 766 (34.6%) | 75 (3.4%) |
| 3-Person Households | 330 (14.9%) | 35 (1.6%) |
| 4-Person Households | 166 (7.5%) | 0 (0.0%) |
| 5-Person Households | 89 (4.0%) | 0 (0.0%) |
| 6-Person Households | 53 (2.4%) | 31 (1.4%) |
| 7+ Person Households | 60 (2.7%) | 0 (0.0%) |
| Total | 1,464 (66.2%) | 747 (33.8%) |
Female Fertility in Wellston
Fertility by Age in Wellston
Average fertility rate in Wellston is 5.0 births per 1,000 women. Women in the age bracket of 20 to 34 years have the highest fertility rate with 15.0 births per 1,000 women. Women in the age bracket of 20 to 34 years acount for 100.0% of all women with births.
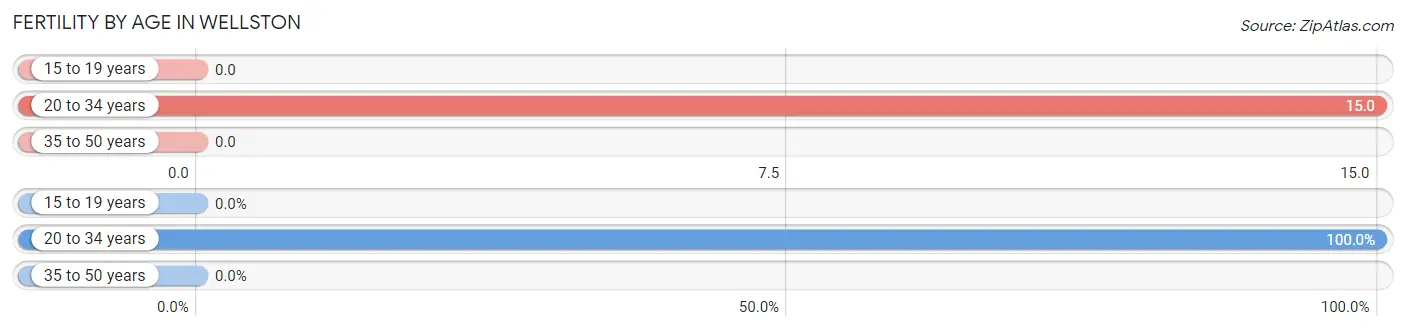
| Age Bracket | Women with Births | Births / 1,000 Women |
| 15 to 19 years | 0 (0.0%) | 0.0 |
| 20 to 34 years | 6 (100.0%) | 15.0 |
| 35 to 50 years | 0 (0.0%) | 0.0 |
| Total | 6 (100.0%) | 5.0 |
Fertility by Age by Marriage Status in Wellston
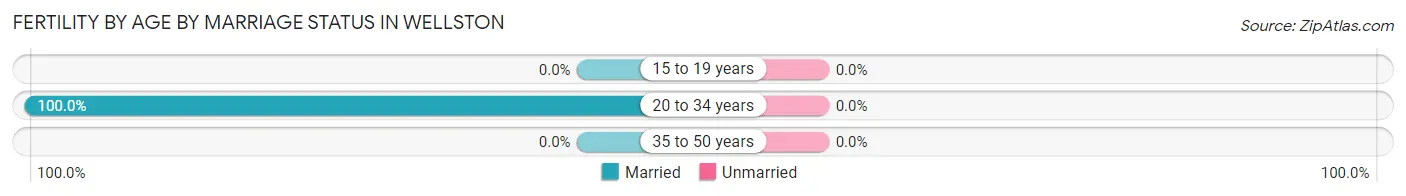
| Age Bracket | Married | Unmarried |
| 15 to 19 years | 0 (0.0%) | 0 (0.0%) |
| 20 to 34 years | 6 (100.0%) | 0 (0.0%) |
| 35 to 50 years | 0 (0.0%) | 0 (0.0%) |
| Total | 6 (100.0%) | 0 (0.0%) |
Fertility by Education in Wellston
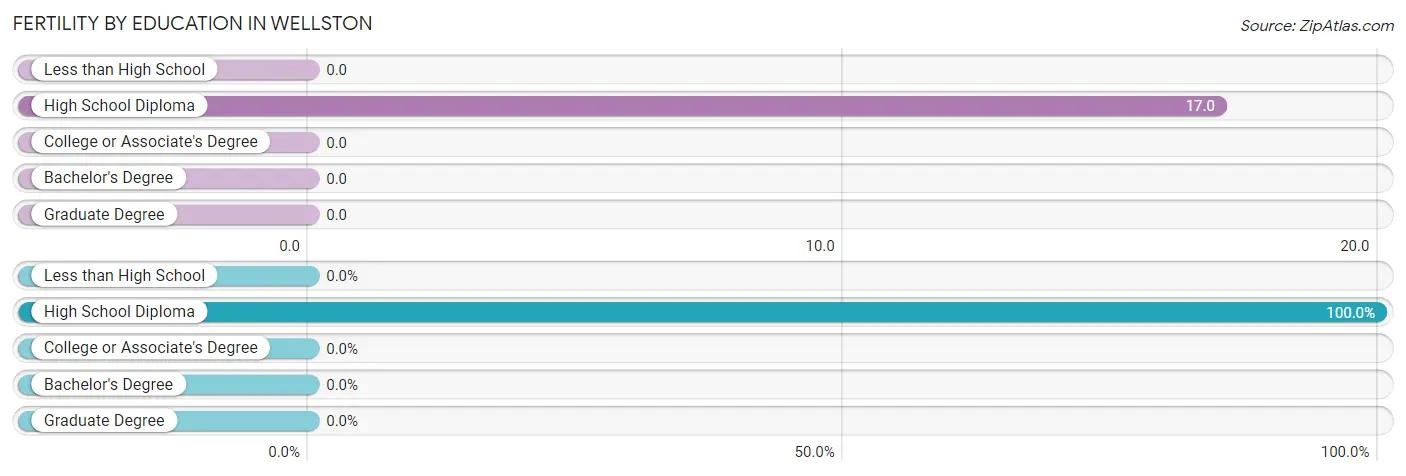
| Educational Attainment | Women with Births | Births / 1,000 Women |
| Less than High School | 0 (0.0%) | 0.0 |
| High School Diploma | 6 (100.0%) | 17.0 |
| College or Associate's Degree | 0 (0.0%) | 0.0 |
| Bachelor's Degree | 0 (0.0%) | 0.0 |
| Graduate Degree | 0 (0.0%) | 0.0 |
| Total | 6 (100.0%) | 5.0 |
Fertility by Education by Marriage Status in Wellston
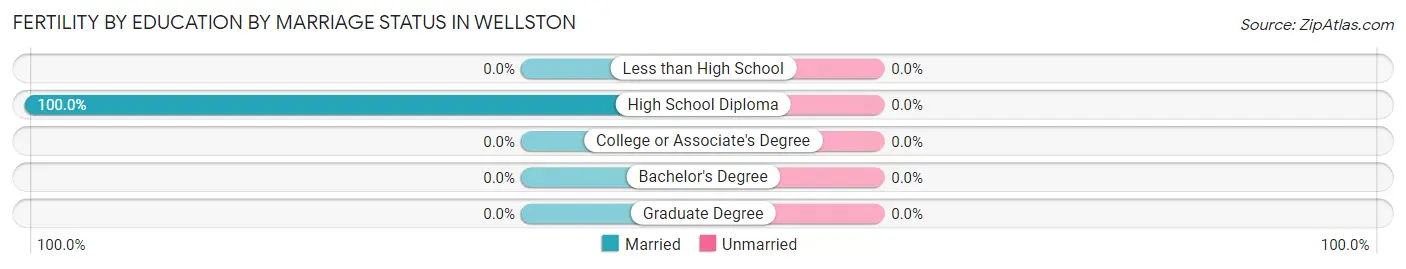
| Educational Attainment | Married | Unmarried |
| Less than High School | 0 (0.0%) | 0 (0.0%) |
| High School Diploma | 6 (100.0%) | 0 (0.0%) |
| College or Associate's Degree | 0 (0.0%) | 0 (0.0%) |
| Bachelor's Degree | 0 (0.0%) | 0 (0.0%) |
| Graduate Degree | 0 (0.0%) | 0 (0.0%) |
| Total | 6 (100.0%) | 0 (0.0%) |
Employment Characteristics in Wellston
Employment by Class of Employer in Wellston
Among the 1,998 employed individuals in Wellston, private company employees (1,485 | 74.3%), not-for-profit organizations (173 | 8.7%), and federal government employees (173 | 8.7%) make up the most common classes of employment.
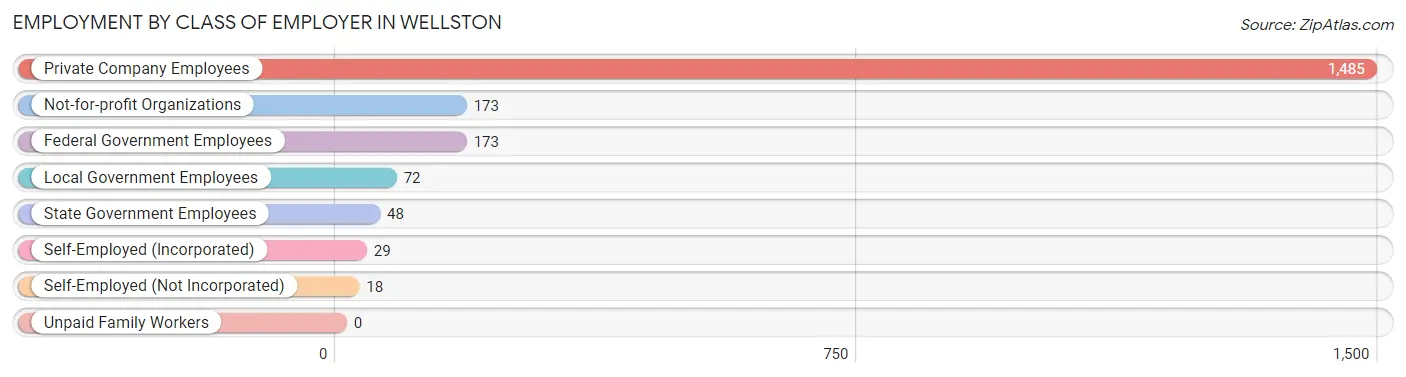
| Employer Class | # Employees | % Employees |
| Private Company Employees | 1,485 | 74.3% |
| Self-Employed (Incorporated) | 29 | 1.5% |
| Self-Employed (Not Incorporated) | 18 | 0.9% |
| Not-for-profit Organizations | 173 | 8.7% |
| Local Government Employees | 72 | 3.6% |
| State Government Employees | 48 | 2.4% |
| Federal Government Employees | 173 | 8.7% |
| Unpaid Family Workers | 0 | 0.0% |
| Total | 1,998 | 100.0% |
Employment Status by Age in Wellston
According to the labor force statistics for Wellston, out of the total population over 16 years of age (4,270), 51.5% or 2,199 individuals are in the labor force, with 5.6% or 123 of them unemployed. The age group with the highest labor force participation rate is 30 to 34 years, with 100.0% or 161 individuals in the labor force. Within the labor force, the 16 to 19 years age range has the highest percentage of unemployed individuals, with 22.9% or 35 of them being unemployed.
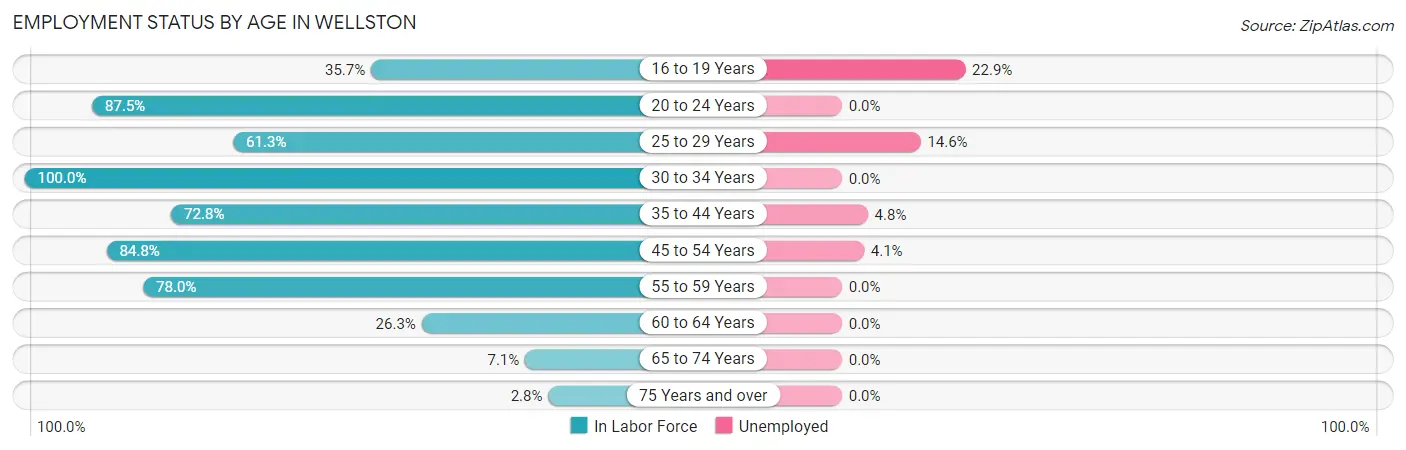
| Age Bracket | In Labor Force | Unemployed |
| 16 to 19 Years | 153 (35.7%) | 35 (22.9%) |
| 20 to 24 Years | 147 (87.5%) | 0 (0.0%) |
| 25 to 29 Years | 268 (61.3%) | 39 (14.6%) |
| 30 to 34 Years | 161 (100.0%) | 0 (0.0%) |
| 35 to 44 Years | 502 (72.8%) | 24 (4.8%) |
| 45 to 54 Years | 579 (84.8%) | 24 (4.1%) |
| 55 to 59 Years | 234 (78.0%) | 0 (0.0%) |
| 60 to 64 Years | 94 (26.3%) | 0 (0.0%) |
| 65 to 74 Years | 49 (7.1%) | 0 (0.0%) |
| 75 Years and over | 10 (2.8%) | 0 (0.0%) |
| Total | 2,199 (51.5%) | 123 (5.6%) |
Employment Status by Educational Attainment in Wellston
According to labor force statistics for Wellston, 69.9% of individuals (1,837) out of the total population between 25 and 64 years of age (2,628) are in the labor force, with 4.7% or 86 of them being unemployed. The group with the highest labor force participation rate are those with the educational attainment of bachelor's degree or higher, with 100.0% or 202 individuals in the labor force. Within the labor force, individuals with college / associate degree education have the highest percentage of unemployment, with 9.8% or 39 of them being unemployed.
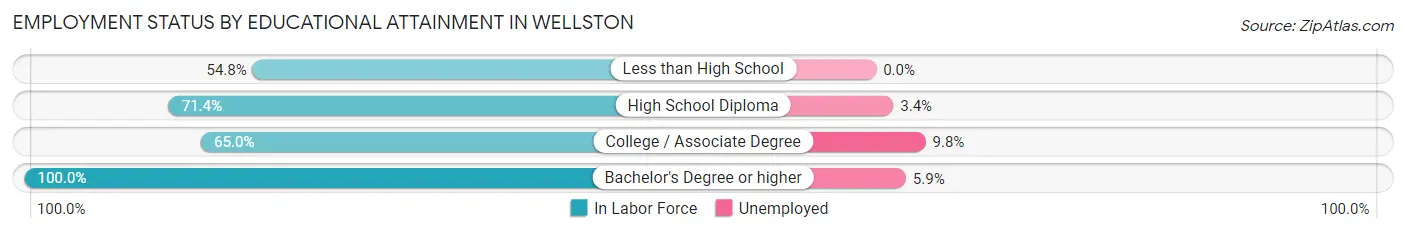
| Educational Attainment | In Labor Force | Unemployed |
| Less than High School | 189 (54.8%) | 0 (0.0%) |
| High School Diploma | 1,050 (71.4%) | 50 (3.4%) |
| College / Associate Degree | 397 (65.0%) | 60 (9.8%) |
| Bachelor's Degree or higher | 202 (100.0%) | 12 (5.9%) |
| Total | 1,837 (69.9%) | 124 (4.7%) |
Employment Occupations by Sex in Wellston
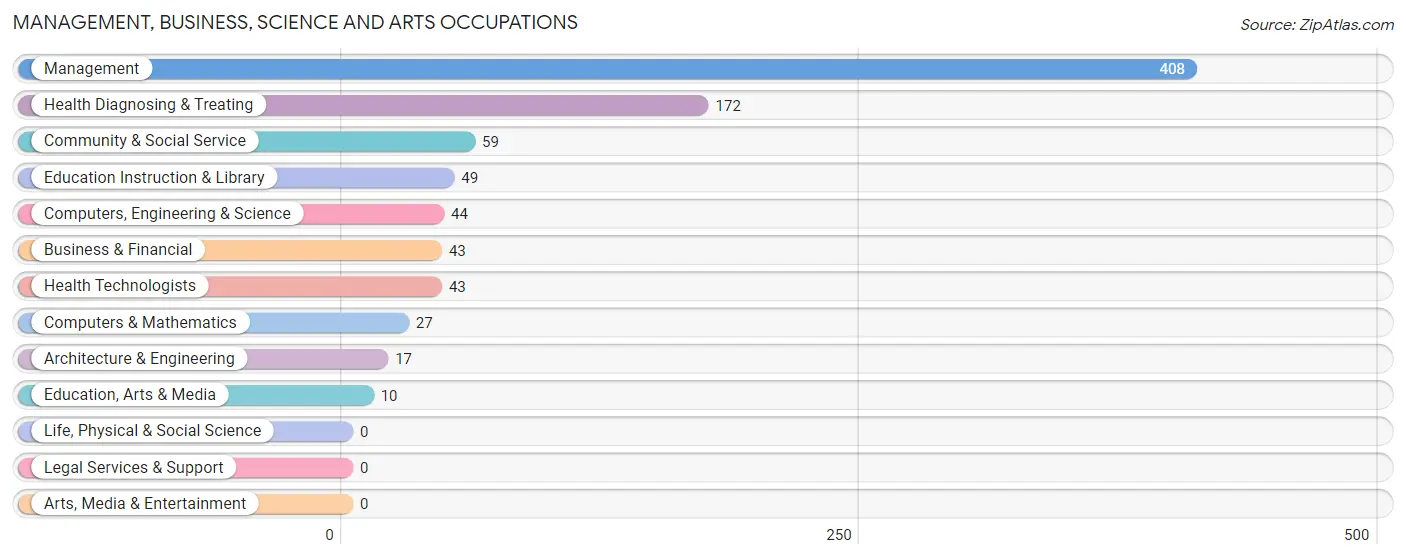
Management, Business, Science and Arts Occupations
The most common Management, Business, Science and Arts occupations in Wellston are Management (408 | 19.7%), Health Diagnosing & Treating (172 | 8.3%), Community & Social Service (59 | 2.8%), Education Instruction & Library (49 | 2.4%), and Computers, Engineering & Science (44 | 2.1%).
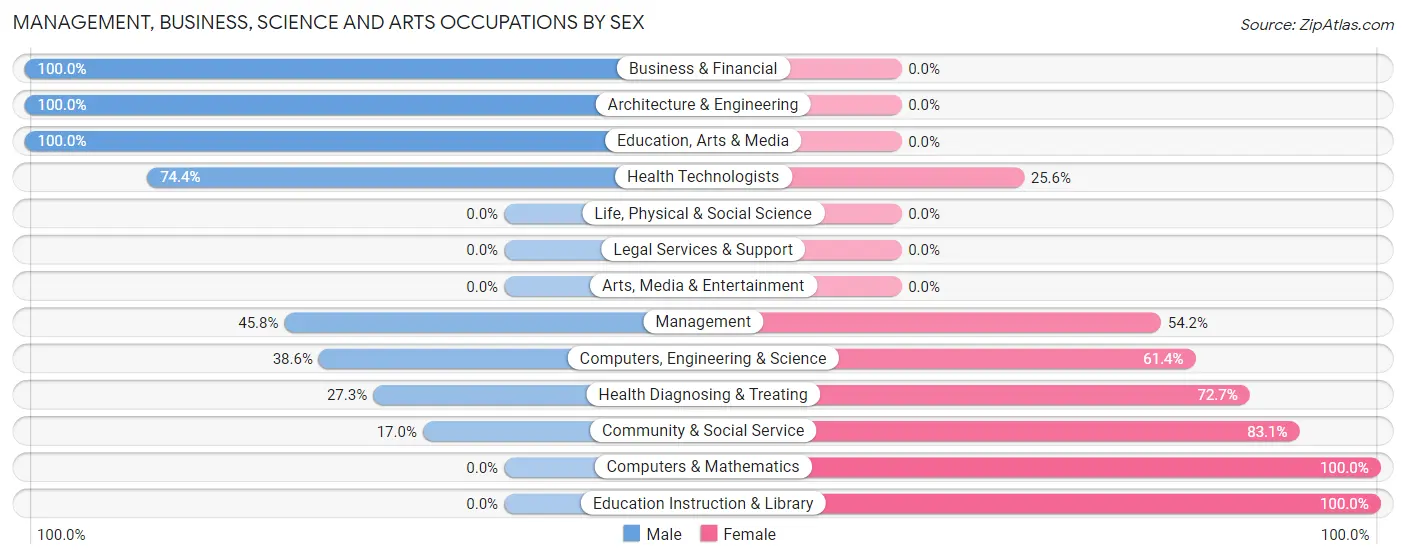
Management, Business, Science and Arts Occupations by Sex
Within the Management, Business, Science and Arts occupations in Wellston, the most male-oriented occupations are Business & Financial (100.0%), Architecture & Engineering (100.0%), and Education, Arts & Media (100.0%), while the most female-oriented occupations are Computers & Mathematics (100.0%), Education Instruction & Library (100.0%), and Community & Social Service (83.1%).
| Occupation | Male | Female |
| Management | 187 (45.8%) | 221 (54.2%) |
| Business & Financial | 43 (100.0%) | 0 (0.0%) |
| Computers, Engineering & Science | 17 (38.6%) | 27 (61.4%) |
| Computers & Mathematics | 0 (0.0%) | 27 (100.0%) |
| Architecture & Engineering | 17 (100.0%) | 0 (0.0%) |
| Life, Physical & Social Science | 0 (0.0%) | 0 (0.0%) |
| Community & Social Service | 10 (17.0%) | 49 (83.1%) |
| Education, Arts & Media | 10 (100.0%) | 0 (0.0%) |
| Legal Services & Support | 0 (0.0%) | 0 (0.0%) |
| Education Instruction & Library | 0 (0.0%) | 49 (100.0%) |
| Arts, Media & Entertainment | 0 (0.0%) | 0 (0.0%) |
| Health Diagnosing & Treating | 47 (27.3%) | 125 (72.7%) |
| Health Technologists | 32 (74.4%) | 11 (25.6%) |
| Total (Category) | 304 (41.9%) | 422 (58.1%) |
| Total (Overall) | 1,032 (49.7%) | 1,043 (50.3%) |
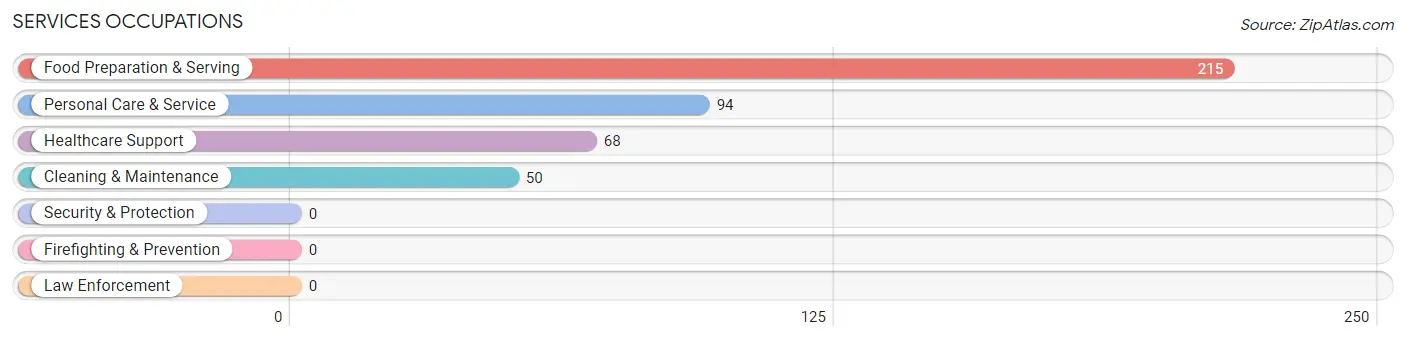
Services Occupations
The most common Services occupations in Wellston are Food Preparation & Serving (215 | 10.4%), Personal Care & Service (94 | 4.5%), Healthcare Support (68 | 3.3%), and Cleaning & Maintenance (50 | 2.4%).
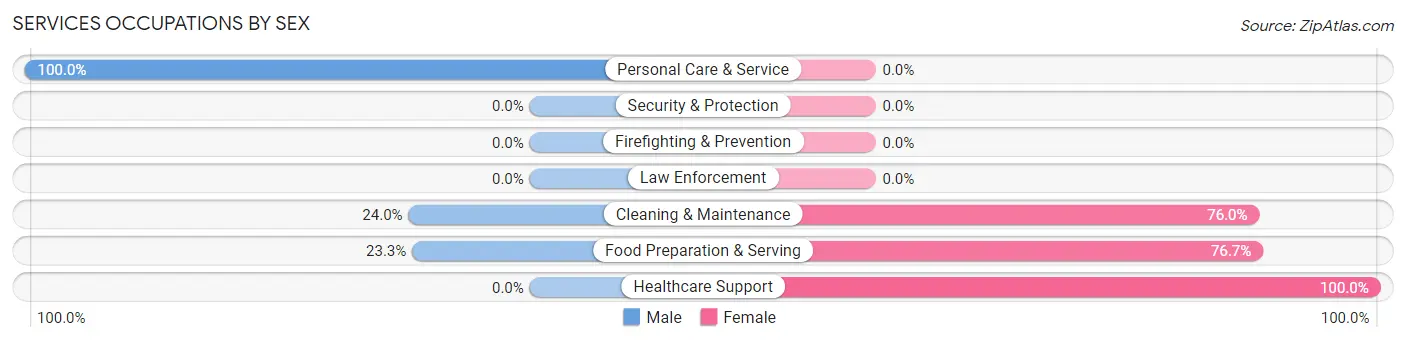
Services Occupations by Sex
Within the Services occupations in Wellston, the most male-oriented occupations are Personal Care & Service (100.0%), Cleaning & Maintenance (24.0%), and Food Preparation & Serving (23.3%), while the most female-oriented occupations are Healthcare Support (100.0%), Food Preparation & Serving (76.7%), and Cleaning & Maintenance (76.0%).
| Occupation | Male | Female |
| Healthcare Support | 0 (0.0%) | 68 (100.0%) |
| Security & Protection | 0 (0.0%) | 0 (0.0%) |
| Firefighting & Prevention | 0 (0.0%) | 0 (0.0%) |
| Law Enforcement | 0 (0.0%) | 0 (0.0%) |
| Food Preparation & Serving | 50 (23.3%) | 165 (76.7%) |
| Cleaning & Maintenance | 12 (24.0%) | 38 (76.0%) |
| Personal Care & Service | 94 (100.0%) | 0 (0.0%) |
| Total (Category) | 156 (36.5%) | 271 (63.5%) |
| Total (Overall) | 1,032 (49.7%) | 1,043 (50.3%) |
Sales and Office Occupations
The most common Sales and Office occupations in Wellston are Sales & Related (155 | 7.5%), and Office & Administration (141 | 6.8%).
Sales and Office Occupations by Sex
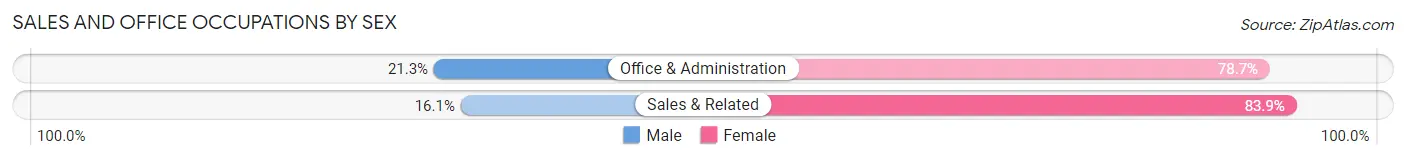
| Occupation | Male | Female |
| Sales & Related | 25 (16.1%) | 130 (83.9%) |
| Office & Administration | 30 (21.3%) | 111 (78.7%) |
| Total (Category) | 55 (18.6%) | 241 (81.4%) |
| Total (Overall) | 1,032 (49.7%) | 1,043 (50.3%) |
Natural Resources, Construction and Maintenance Occupations
The most common Natural Resources, Construction and Maintenance occupations in Wellston are Construction & Extraction (96 | 4.6%), and Installation, Maintenance & Repair (43 | 2.1%).
Natural Resources, Construction and Maintenance Occupations by Sex
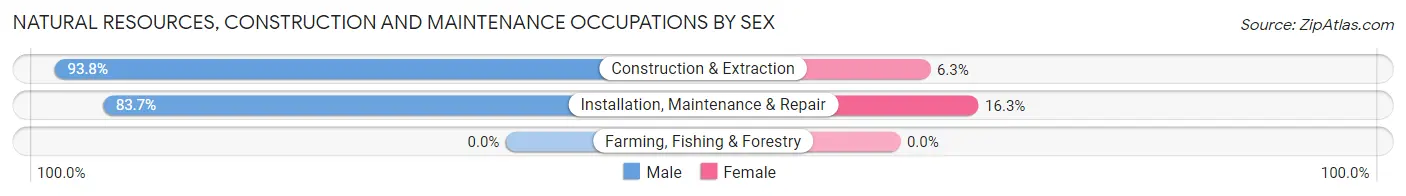
| Occupation | Male | Female |
| Farming, Fishing & Forestry | 0 (0.0%) | 0 (0.0%) |
| Construction & Extraction | 90 (93.8%) | 6 (6.2%) |
| Installation, Maintenance & Repair | 36 (83.7%) | 7 (16.3%) |
| Total (Category) | 126 (90.6%) | 13 (9.3%) |
| Total (Overall) | 1,032 (49.7%) | 1,043 (50.3%) |
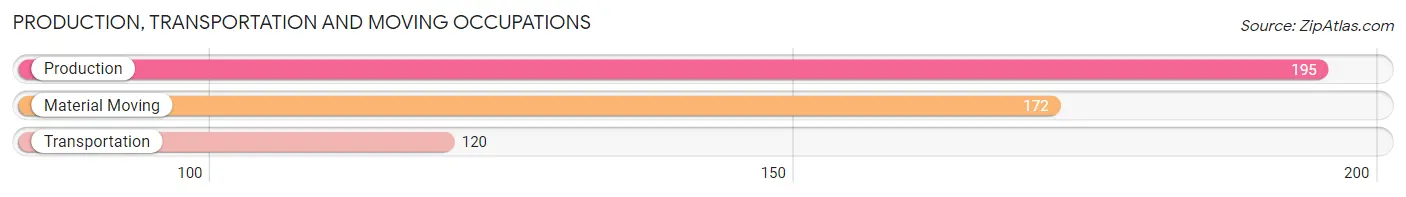
Production, Transportation and Moving Occupations
The most common Production, Transportation and Moving occupations in Wellston are Production (195 | 9.4%), Material Moving (172 | 8.3%), and Transportation (120 | 5.8%).
Production, Transportation and Moving Occupations by Sex
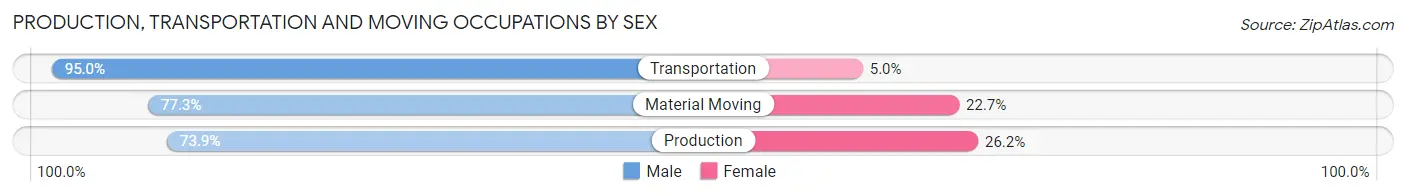
| Occupation | Male | Female |
| Production | 144 (73.9%) | 51 (26.2%) |
| Transportation | 114 (95.0%) | 6 (5.0%) |
| Material Moving | 133 (77.3%) | 39 (22.7%) |
| Total (Category) | 391 (80.3%) | 96 (19.7%) |
| Total (Overall) | 1,032 (49.7%) | 1,043 (50.3%) |
Employment Industries by Sex in Wellston
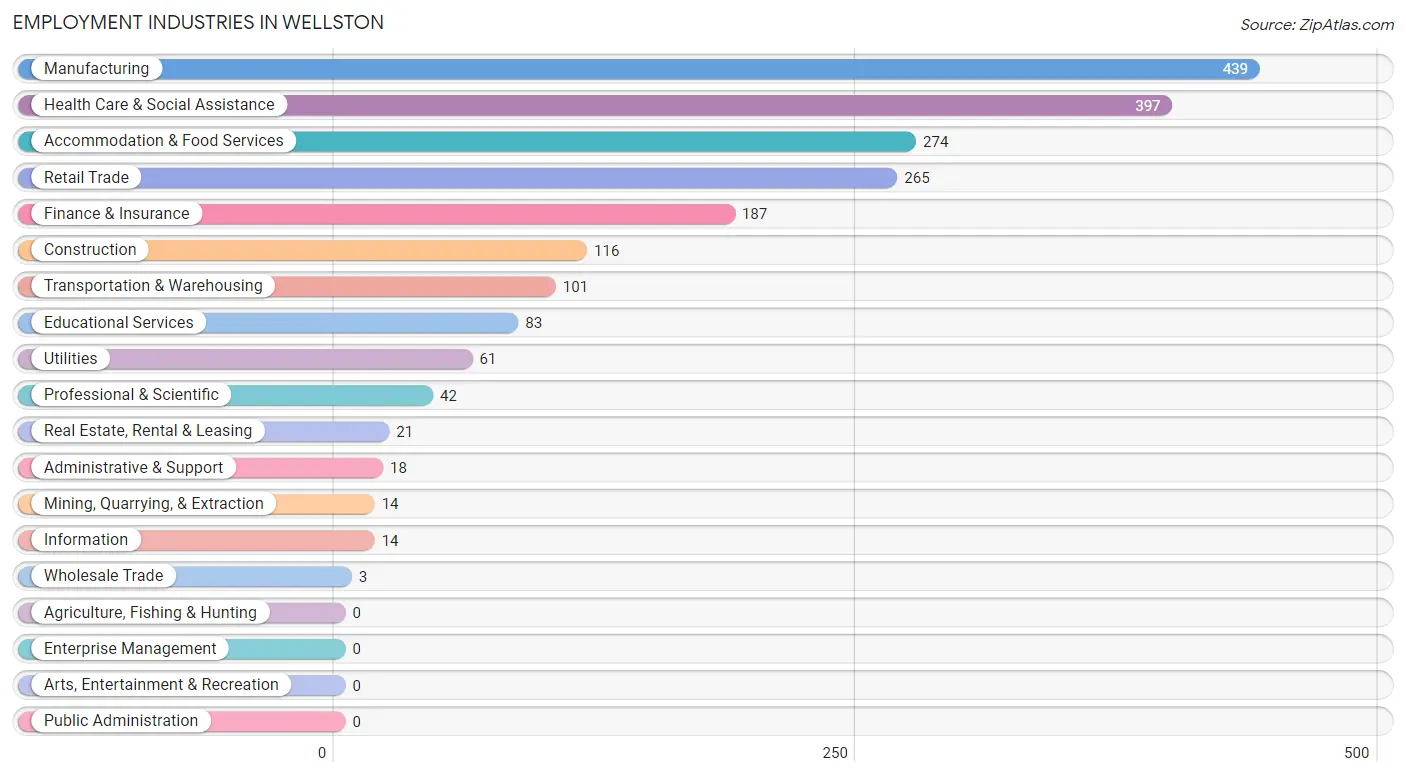
Employment Industries in Wellston
The major employment industries in Wellston include Manufacturing (439 | 21.2%), Health Care & Social Assistance (397 | 19.1%), Accommodation & Food Services (274 | 13.2%), Retail Trade (265 | 12.8%), and Finance & Insurance (187 | 9.0%).
Employment Industries by Sex in Wellston
The Wellston industries that see more men than women are Mining, Quarrying, & Extraction (100.0%), Wholesale Trade (100.0%), and Transportation & Warehousing (100.0%), whereas the industries that tend to have a higher number of women are Information (100.0%), Educational Services (85.5%), and Retail Trade (83.4%).
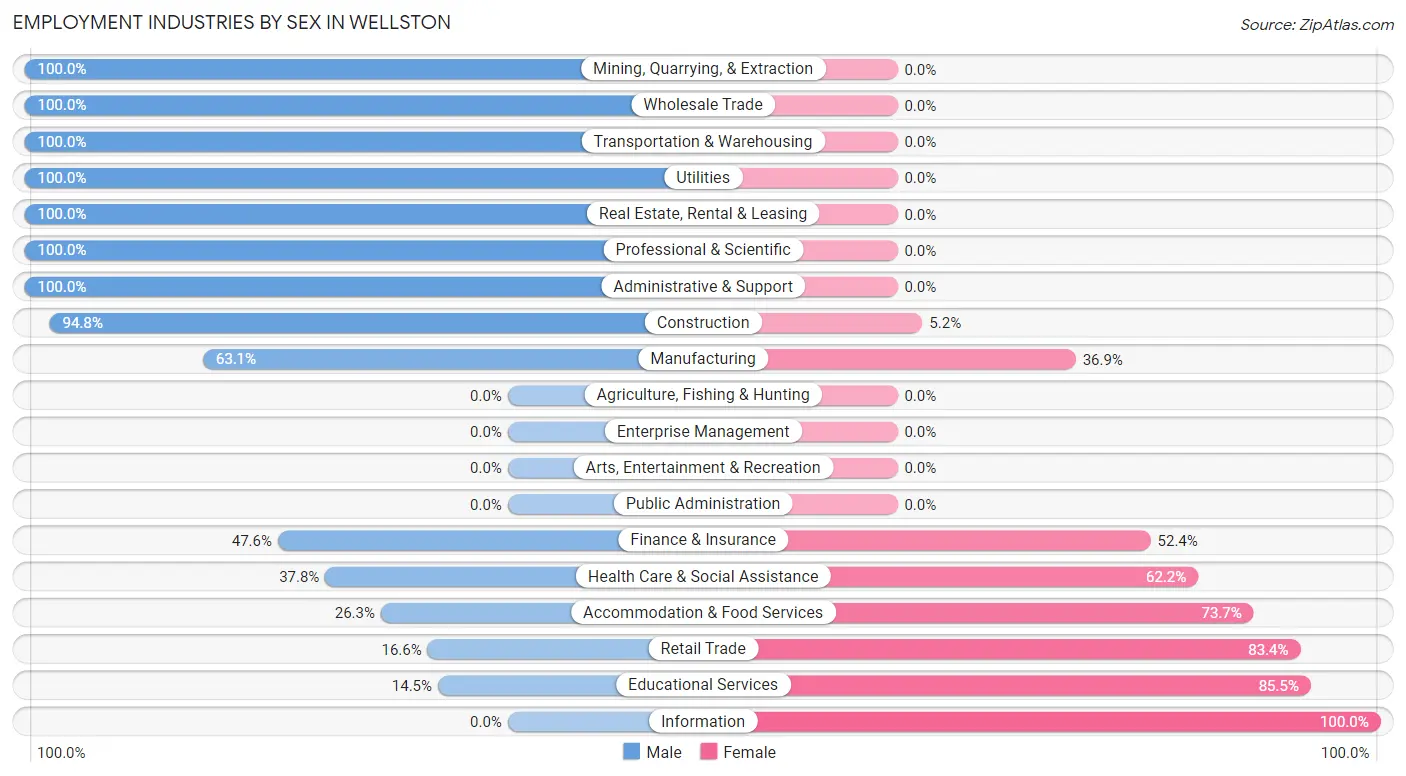
| Industry | Male | Female |
| Agriculture, Fishing & Hunting | 0 (0.0%) | 0 (0.0%) |
| Mining, Quarrying, & Extraction | 14 (100.0%) | 0 (0.0%) |
| Construction | 110 (94.8%) | 6 (5.2%) |
| Manufacturing | 277 (63.1%) | 162 (36.9%) |
| Wholesale Trade | 3 (100.0%) | 0 (0.0%) |
| Retail Trade | 44 (16.6%) | 221 (83.4%) |
| Transportation & Warehousing | 101 (100.0%) | 0 (0.0%) |
| Utilities | 61 (100.0%) | 0 (0.0%) |
| Information | 0 (0.0%) | 14 (100.0%) |
| Finance & Insurance | 89 (47.6%) | 98 (52.4%) |
| Real Estate, Rental & Leasing | 21 (100.0%) | 0 (0.0%) |
| Professional & Scientific | 42 (100.0%) | 0 (0.0%) |
| Enterprise Management | 0 (0.0%) | 0 (0.0%) |
| Administrative & Support | 18 (100.0%) | 0 (0.0%) |
| Educational Services | 12 (14.5%) | 71 (85.5%) |
| Health Care & Social Assistance | 150 (37.8%) | 247 (62.2%) |
| Arts, Entertainment & Recreation | 0 (0.0%) | 0 (0.0%) |
| Accommodation & Food Services | 72 (26.3%) | 202 (73.7%) |
| Public Administration | 0 (0.0%) | 0 (0.0%) |
| Total | 1,032 (49.7%) | 1,043 (50.3%) |
Education in Wellston
School Enrollment in Wellston
The most common levels of schooling among the 1,367 students in Wellston are elementary school (557 | 40.7%), high school (360 | 26.3%), and middle school (189 | 13.8%).
| School Level | # Students | % Students |
| Nursery / Preschool | 0 | 0.0% |
| Kindergarten | 55 | 4.0% |
| Elementary School | 557 | 40.7% |
| Middle School | 189 | 13.8% |
| High School | 360 | 26.3% |
| College / Undergraduate | 162 | 11.8% |
| Graduate / Professional | 44 | 3.2% |
| Total | 1,367 | 100.0% |
School Enrollment by Age by Funding Source in Wellston
Out of a total of 1,367 students who are enrolled in schools in Wellston, 137 (10.0%) attend a private institution, while the remaining 1,230 (90.0%) are enrolled in public schools. The age group of 35 years and over has the highest likelihood of being enrolled in private schools, with 44 (77.2% in the age bracket) enrolled. Conversely, the age group of 18 to 19 year olds has the lowest likelihood of being enrolled in a private school, with 57 (100.0% in the age bracket) attending a public institution.
| Age Bracket | Public School | Private School |
| 3 to 4 Year Olds | 0 (0.0%) | 0 (0.0%) |
| 5 to 9 Year Old | 477 (97.0%) | 15 (3.0%) |
| 10 to 14 Year Olds | 375 (93.5%) | 26 (6.5%) |
| 15 to 17 Year Olds | 199 (81.2%) | 46 (18.8%) |
| 18 to 19 Year Olds | 57 (100.0%) | 0 (0.0%) |
| 20 to 24 Year Olds | 39 (100.0%) | 0 (0.0%) |
| 25 to 34 Year Olds | 70 (92.1%) | 6 (7.9%) |
| 35 Years and over | 13 (22.8%) | 44 (77.2%) |
| Total | 1,230 (90.0%) | 137 (10.0%) |
Educational Attainment by Field of Study in Wellston
Business (101 | 35.6%), education (36 | 12.7%), science & technology (31 | 10.9%), social sciences (23 | 8.1%), and engineering (23 | 8.1%) are the most common fields of study among 284 individuals in Wellston who have obtained a bachelor's degree or higher.
| Field of Study | # Graduates | % Graduates |
| Computers & Mathematics | 5 | 1.8% |
| Bio, Nature & Agricultural | 0 | 0.0% |
| Physical & Health Sciences | 19 | 6.7% |
| Psychology | 14 | 4.9% |
| Social Sciences | 23 | 8.1% |
| Engineering | 23 | 8.1% |
| Multidisciplinary Studies | 0 | 0.0% |
| Science & Technology | 31 | 10.9% |
| Business | 101 | 35.6% |
| Education | 36 | 12.7% |
| Literature & Languages | 12 | 4.2% |
| Liberal Arts & History | 20 | 7.0% |
| Visual & Performing Arts | 0 | 0.0% |
| Communications | 0 | 0.0% |
| Arts & Humanities | 0 | 0.0% |
| Total | 284 | 100.0% |
Transportation & Commute in Wellston
Vehicle Availability by Sex in Wellston
The most prevalent vehicle ownership categories in Wellston are males with 2 vehicles (403, accounting for 41.8%) and females with 2 vehicles (318, making up 39.0%).
| Vehicles Available | Male | Female |
| No Vehicle | 0 (0.0%) | 0 (0.0%) |
| 1 Vehicle | 37 (3.8%) | 310 (30.0%) |
| 2 Vehicles | 403 (41.8%) | 318 (30.8%) |
| 3 Vehicles | 238 (24.7%) | 116 (11.2%) |
| 4 Vehicles | 141 (14.6%) | 224 (21.7%) |
| 5 or more Vehicles | 146 (15.1%) | 65 (6.3%) |
| Total | 965 (100.0%) | 1,033 (100.0%) |
Commute Time in Wellston
The most frequently occuring commute durations in Wellston are 15 to 19 minutes (441 commuters, 22.3%), 5 to 9 minutes (235 commuters, 11.9%), and 20 to 24 minutes (231 commuters, 11.7%).
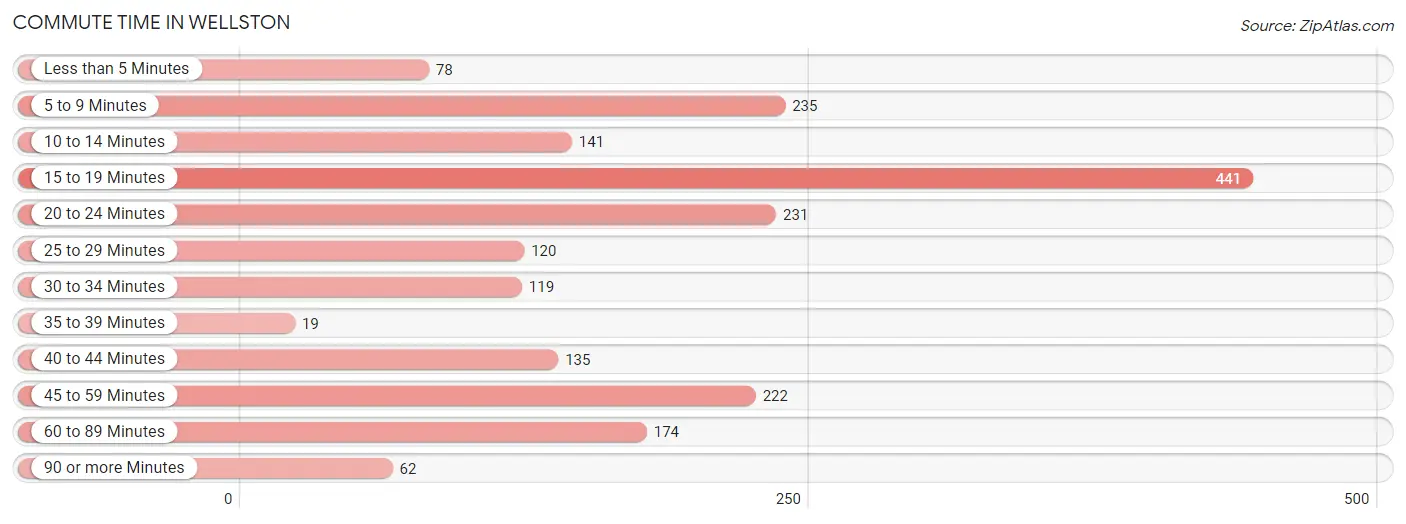
| Commute Time | # Commuters | % Commuters |
| Less than 5 Minutes | 78 | 4.0% |
| 5 to 9 Minutes | 235 | 11.9% |
| 10 to 14 Minutes | 141 | 7.1% |
| 15 to 19 Minutes | 441 | 22.3% |
| 20 to 24 Minutes | 231 | 11.7% |
| 25 to 29 Minutes | 120 | 6.1% |
| 30 to 34 Minutes | 119 | 6.0% |
| 35 to 39 Minutes | 19 | 1.0% |
| 40 to 44 Minutes | 135 | 6.8% |
| 45 to 59 Minutes | 222 | 11.2% |
| 60 to 89 Minutes | 174 | 8.8% |
| 90 or more Minutes | 62 | 3.1% |
Commute Time by Sex in Wellston
The most common commute times in Wellston are 15 to 19 minutes (200 commuters, 21.2%) for males and 15 to 19 minutes (241 commuters, 23.3%) for females.
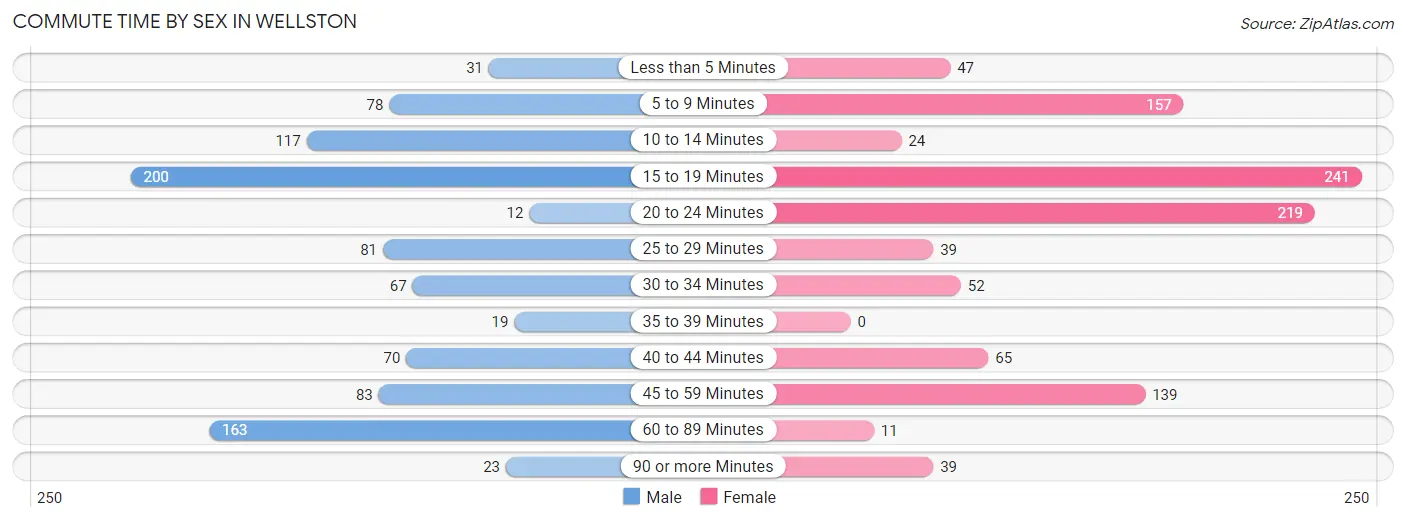
| Commute Time | Male | Female |
| Less than 5 Minutes | 31 (3.3%) | 47 (4.5%) |
| 5 to 9 Minutes | 78 (8.3%) | 157 (15.2%) |
| 10 to 14 Minutes | 117 (12.4%) | 24 (2.3%) |
| 15 to 19 Minutes | 200 (21.2%) | 241 (23.3%) |
| 20 to 24 Minutes | 12 (1.3%) | 219 (21.2%) |
| 25 to 29 Minutes | 81 (8.6%) | 39 (3.8%) |
| 30 to 34 Minutes | 67 (7.1%) | 52 (5.0%) |
| 35 to 39 Minutes | 19 (2.0%) | 0 (0.0%) |
| 40 to 44 Minutes | 70 (7.4%) | 65 (6.3%) |
| 45 to 59 Minutes | 83 (8.8%) | 139 (13.5%) |
| 60 to 89 Minutes | 163 (17.3%) | 11 (1.1%) |
| 90 or more Minutes | 23 (2.4%) | 39 (3.8%) |
Time of Departure to Work by Sex in Wellston
The most frequent times of departure to work in Wellston are 7:30 AM to 7:59 AM (178, 18.9%) for males and 6:30 AM to 6:59 AM (228, 22.1%) for females.
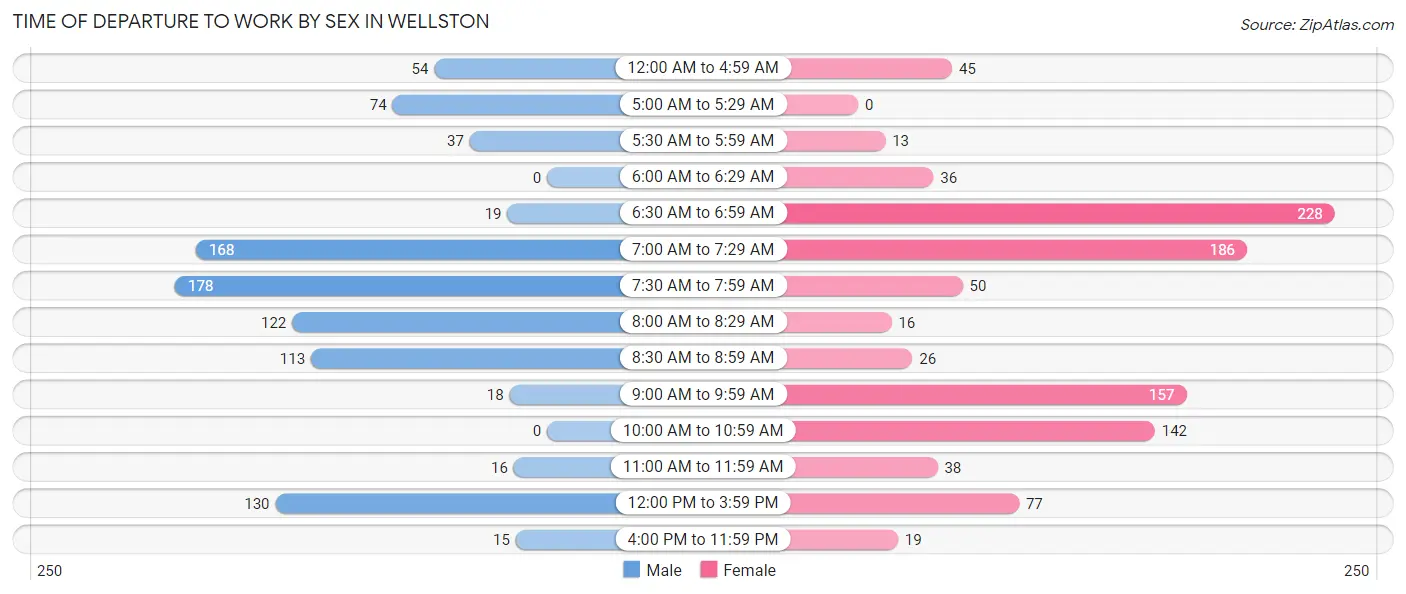
| Time of Departure | Male | Female |
| 12:00 AM to 4:59 AM | 54 (5.7%) | 45 (4.4%) |
| 5:00 AM to 5:29 AM | 74 (7.8%) | 0 (0.0%) |
| 5:30 AM to 5:59 AM | 37 (3.9%) | 13 (1.3%) |
| 6:00 AM to 6:29 AM | 0 (0.0%) | 36 (3.5%) |
| 6:30 AM to 6:59 AM | 19 (2.0%) | 228 (22.1%) |
| 7:00 AM to 7:29 AM | 168 (17.8%) | 186 (18.0%) |
| 7:30 AM to 7:59 AM | 178 (18.9%) | 50 (4.8%) |
| 8:00 AM to 8:29 AM | 122 (12.9%) | 16 (1.5%) |
| 8:30 AM to 8:59 AM | 113 (12.0%) | 26 (2.5%) |
| 9:00 AM to 9:59 AM | 18 (1.9%) | 157 (15.2%) |
| 10:00 AM to 10:59 AM | 0 (0.0%) | 142 (13.8%) |
| 11:00 AM to 11:59 AM | 16 (1.7%) | 38 (3.7%) |
| 12:00 PM to 3:59 PM | 130 (13.8%) | 77 (7.4%) |
| 4:00 PM to 11:59 PM | 15 (1.6%) | 19 (1.8%) |
| Total | 944 (100.0%) | 1,033 (100.0%) |
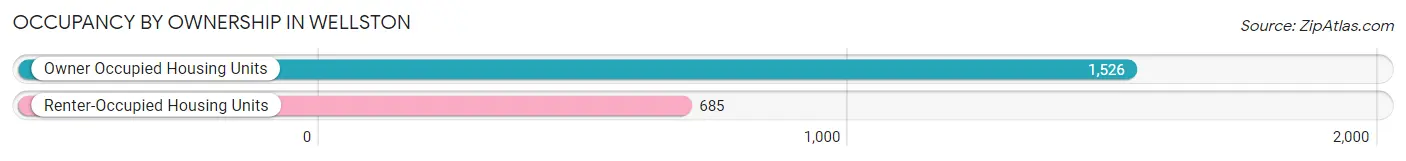
Housing Occupancy in Wellston
Occupancy by Ownership in Wellston
Of the total 2,211 dwellings in Wellston, owner-occupied units account for 1,526 (69.0%), while renter-occupied units make up 685 (31.0%).
| Occupancy | # Housing Units | % Housing Units |
| Owner Occupied Housing Units | 1,526 | 69.0% |
| Renter-Occupied Housing Units | 685 | 31.0% |
| Total Occupied Housing Units | 2,211 | 100.0% |
Occupancy by Household Size in Wellston
| Household Size | # Housing Units | % Housing Units |
| 1-Person Household | 606 | 27.4% |
| 2-Person Household | 841 | 38.0% |
| 3-Person Household | 365 | 16.5% |
| 4+ Person Household | 399 | 18.0% |
| Total Housing Units | 2,211 | 100.0% |
Occupancy by Ownership by Household Size in Wellston
| Household Size | Owner-occupied | Renter-occupied |
| 1-Person Household | 425 (70.1%) | 181 (29.9%) |
| 2-Person Household | 477 (56.7%) | 364 (43.3%) |
| 3-Person Household | 260 (71.2%) | 105 (28.8%) |
| 4+ Person Household | 364 (91.2%) | 35 (8.8%) |
| Total Housing Units | 1,526 (69.0%) | 685 (31.0%) |
Occupancy by Educational Attainment in Wellston
| Household Size | Owner-occupied | Renter-occupied |
| Less than High School | 231 (72.0%) | 90 (28.0%) |
| High School Diploma | 842 (70.4%) | 354 (29.6%) |
| College/Associate Degree | 268 (52.6%) | 241 (47.3%) |
| Bachelor's Degree or higher | 185 (100.0%) | 0 (0.0%) |
Occupancy by Age of Householder in Wellston
| Age Bracket | # Households | % Households |
| Under 35 Years | 366 | 16.6% |
| 35 to 44 Years | 347 | 15.7% |
| 45 to 54 Years | 381 | 17.2% |
| 55 to 64 Years | 412 | 18.6% |
| 65 to 74 Years | 462 | 20.9% |
| 75 to 84 Years | 139 | 6.3% |
| 85 Years and Over | 104 | 4.7% |
| Total | 2,211 | 100.0% |
Housing Finances in Wellston
Median Income by Occupancy in Wellston
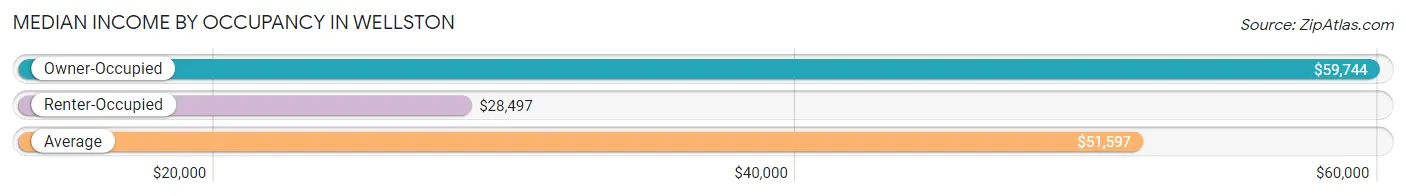
| Occupancy Type | # Households | Median Income |
| Owner-Occupied | 1,526 (69.0%) | $59,744 |
| Renter-Occupied | 685 (31.0%) | $28,497 |
| Average | 2,211 (100.0%) | $51,597 |
Occupancy by Householder Income Bracket in Wellston
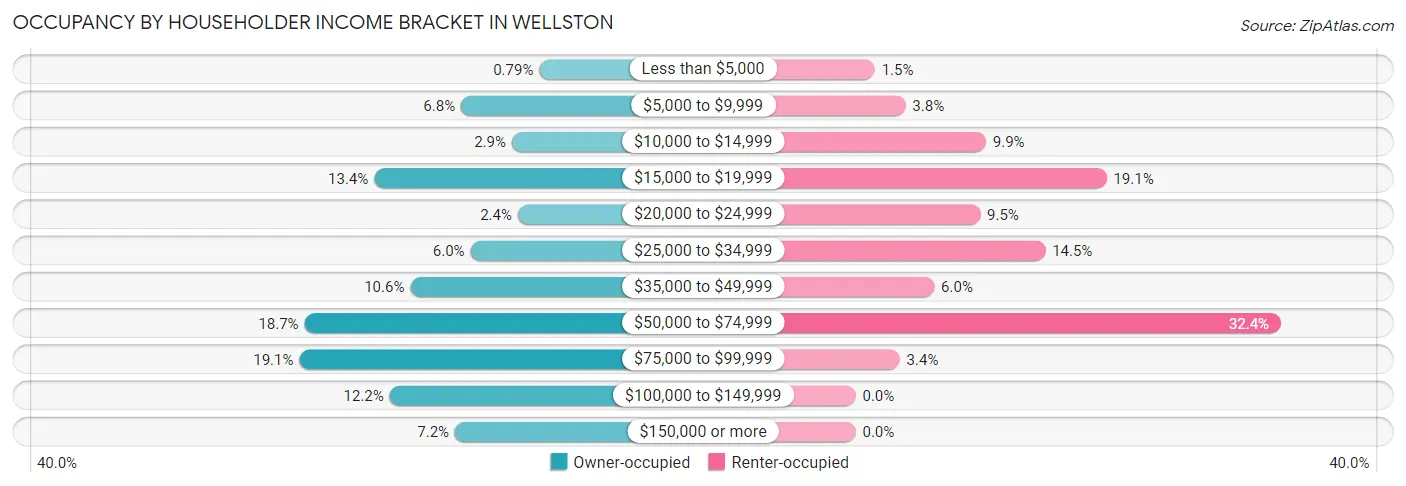
| Income Bracket | Owner-occupied | Renter-occupied |
| Less than $5,000 | 12 (0.8%) | 10 (1.5%) |
| $5,000 to $9,999 | 103 (6.8%) | 26 (3.8%) |
| $10,000 to $14,999 | 44 (2.9%) | 68 (9.9%) |
| $15,000 to $19,999 | 204 (13.4%) | 131 (19.1%) |
| $20,000 to $24,999 | 37 (2.4%) | 65 (9.5%) |
| $25,000 to $34,999 | 92 (6.0%) | 99 (14.4%) |
| $35,000 to $49,999 | 162 (10.6%) | 41 (6.0%) |
| $50,000 to $74,999 | 285 (18.7%) | 222 (32.4%) |
| $75,000 to $99,999 | 291 (19.1%) | 23 (3.4%) |
| $100,000 to $149,999 | 186 (12.2%) | 0 (0.0%) |
| $150,000 or more | 110 (7.2%) | 0 (0.0%) |
| Total | 1,526 (100.0%) | 685 (100.0%) |
Monthly Housing Cost Tiers in Wellston
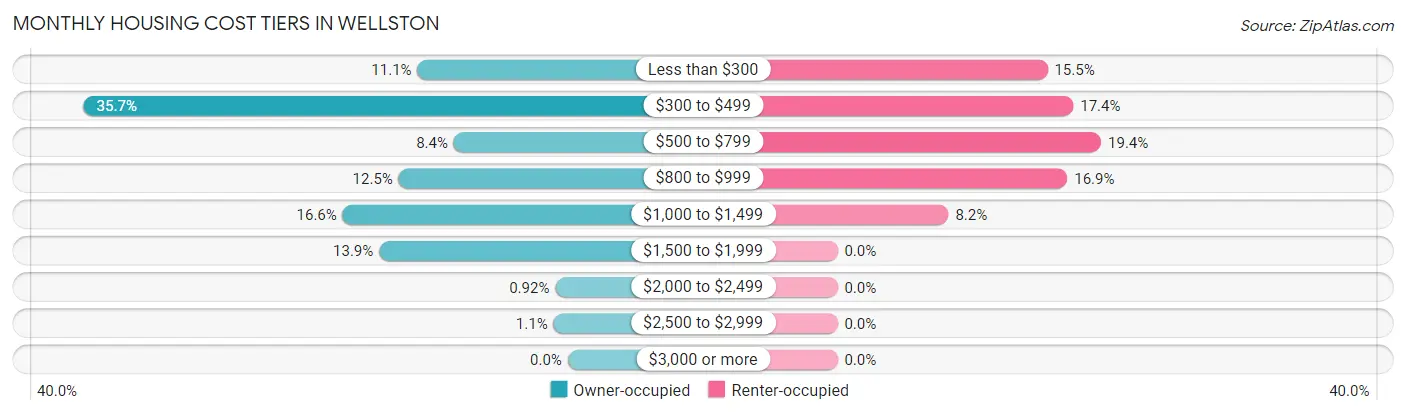
| Monthly Cost | Owner-occupied | Renter-occupied |
| Less than $300 | 169 (11.1%) | 106 (15.5%) |
| $300 to $499 | 544 (35.6%) | 119 (17.4%) |
| $500 to $799 | 128 (8.4%) | 133 (19.4%) |
| $800 to $999 | 190 (12.4%) | 116 (16.9%) |
| $1,000 to $1,499 | 253 (16.6%) | 56 (8.2%) |
| $1,500 to $1,999 | 212 (13.9%) | 0 (0.0%) |
| $2,000 to $2,499 | 14 (0.9%) | 0 (0.0%) |
| $2,500 to $2,999 | 16 (1.1%) | 0 (0.0%) |
| $3,000 or more | 0 (0.0%) | 0 (0.0%) |
| Total | 1,526 (100.0%) | 685 (100.0%) |
Physical Housing Characteristics in Wellston
Housing Structures in Wellston
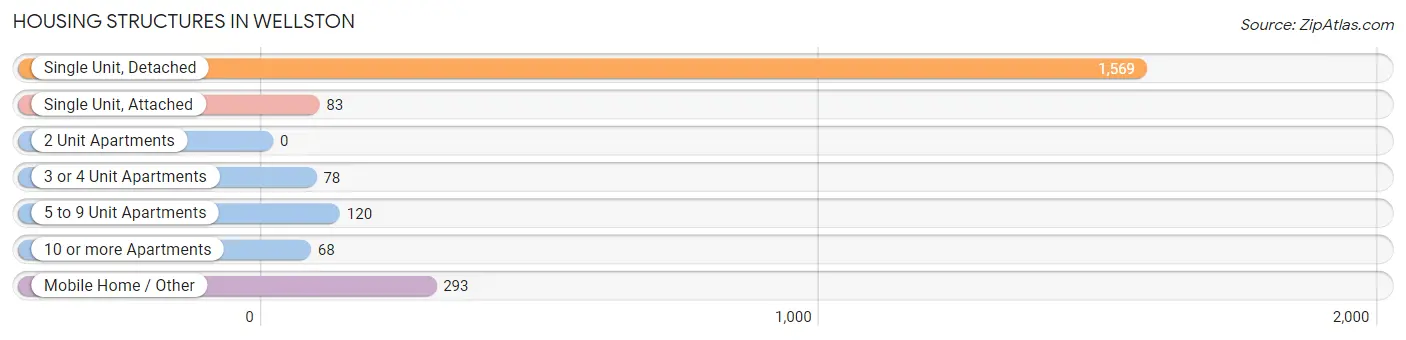
| Structure Type | # Housing Units | % Housing Units |
| Single Unit, Detached | 1,569 | 71.0% |
| Single Unit, Attached | 83 | 3.7% |
| 2 Unit Apartments | 0 | 0.0% |
| 3 or 4 Unit Apartments | 78 | 3.5% |
| 5 to 9 Unit Apartments | 120 | 5.4% |
| 10 or more Apartments | 68 | 3.1% |
| Mobile Home / Other | 293 | 13.3% |
| Total | 2,211 | 100.0% |
Housing Structures by Occupancy in Wellston
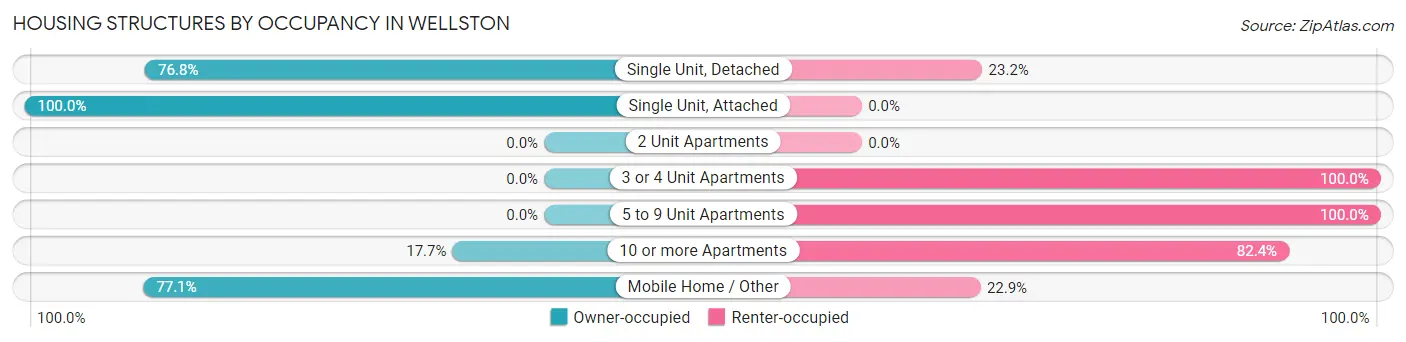
| Structure Type | Owner-occupied | Renter-occupied |
| Single Unit, Detached | 1,205 (76.8%) | 364 (23.2%) |
| Single Unit, Attached | 83 (100.0%) | 0 (0.0%) |
| 2 Unit Apartments | 0 (0.0%) | 0 (0.0%) |
| 3 or 4 Unit Apartments | 0 (0.0%) | 78 (100.0%) |
| 5 to 9 Unit Apartments | 0 (0.0%) | 120 (100.0%) |
| 10 or more Apartments | 12 (17.6%) | 56 (82.4%) |
| Mobile Home / Other | 226 (77.1%) | 67 (22.9%) |
| Total | 1,526 (69.0%) | 685 (31.0%) |
Housing Structures by Number of Rooms in Wellston
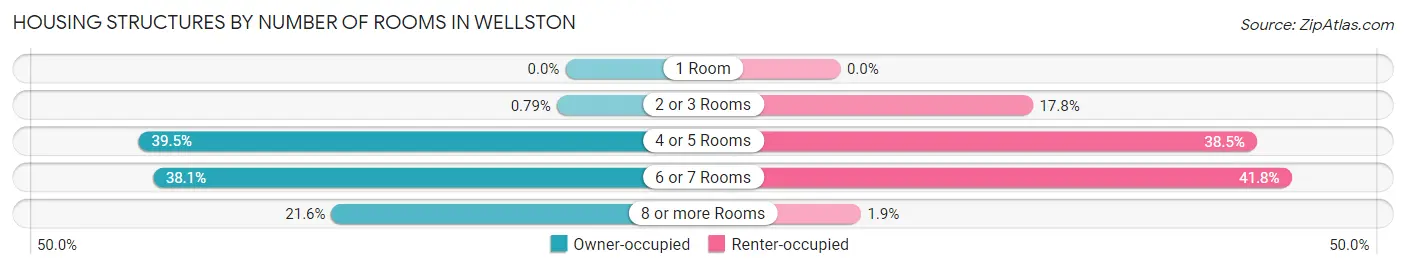
| Number of Rooms | Owner-occupied | Renter-occupied |
| 1 Room | 0 (0.0%) | 0 (0.0%) |
| 2 or 3 Rooms | 12 (0.8%) | 122 (17.8%) |
| 4 or 5 Rooms | 602 (39.5%) | 264 (38.5%) |
| 6 or 7 Rooms | 582 (38.1%) | 286 (41.7%) |
| 8 or more Rooms | 330 (21.6%) | 13 (1.9%) |
| Total | 1,526 (100.0%) | 685 (100.0%) |
Housing Structure by Heating Type in Wellston
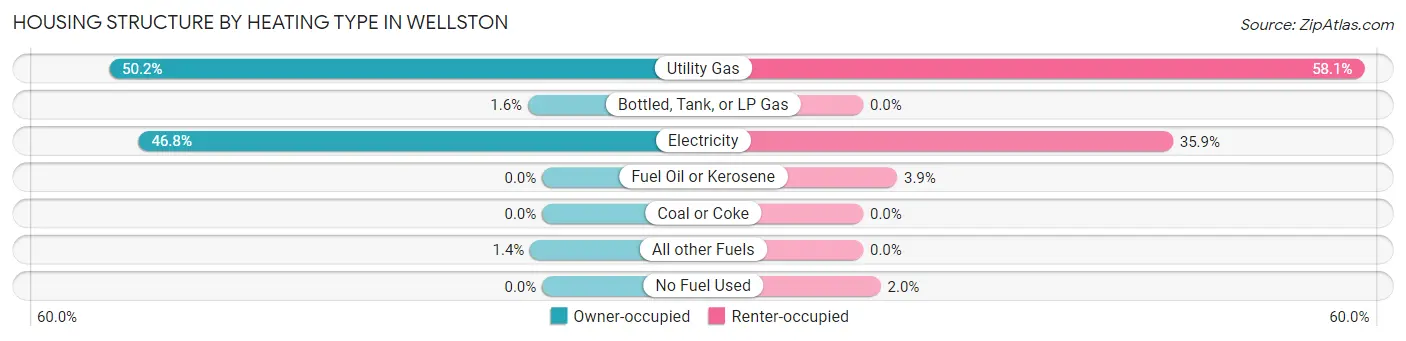
| Heating Type | Owner-occupied | Renter-occupied |
| Utility Gas | 766 (50.2%) | 398 (58.1%) |
| Bottled, Tank, or LP Gas | 25 (1.6%) | 0 (0.0%) |
| Electricity | 714 (46.8%) | 246 (35.9%) |
| Fuel Oil or Kerosene | 0 (0.0%) | 27 (3.9%) |
| Coal or Coke | 0 (0.0%) | 0 (0.0%) |
| All other Fuels | 21 (1.4%) | 0 (0.0%) |
| No Fuel Used | 0 (0.0%) | 14 (2.0%) |
| Total | 1,526 (100.0%) | 685 (100.0%) |
Household Vehicle Usage in Wellston
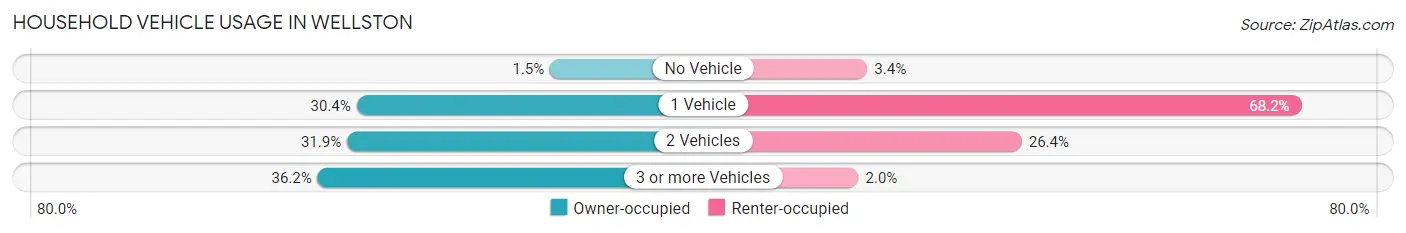
| Vehicles per Household | Owner-occupied | Renter-occupied |
| No Vehicle | 23 (1.5%) | 23 (3.4%) |
| 1 Vehicle | 464 (30.4%) | 467 (68.2%) |
| 2 Vehicles | 486 (31.9%) | 181 (26.4%) |
| 3 or more Vehicles | 553 (36.2%) | 14 (2.0%) |
| Total | 1,526 (100.0%) | 685 (100.0%) |
Real Estate & Mortgages in Wellston
Real Estate and Mortgage Overview in Wellston
| Characteristic | Without Mortgage | With Mortgage |
| Housing Units | 808 | 718 |
| Median Property Value | $90,400 | $139,300 |
| Median Household Income | $54,200 | $19 |
| Monthly Housing Costs | $395 | $0 |
| Real Estate Taxes | $1,198 | $44 |
Property Value by Mortgage Status in Wellston
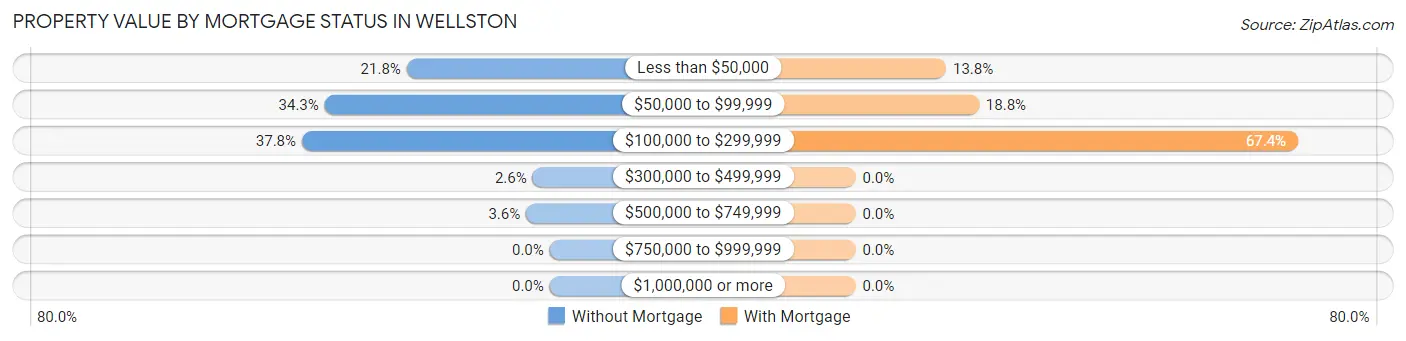
| Property Value | Without Mortgage | With Mortgage |
| Less than $50,000 | 176 (21.8%) | 99 (13.8%) |
| $50,000 to $99,999 | 277 (34.3%) | 135 (18.8%) |
| $100,000 to $299,999 | 305 (37.8%) | 484 (67.4%) |
| $300,000 to $499,999 | 21 (2.6%) | 0 (0.0%) |
| $500,000 to $749,999 | 29 (3.6%) | 0 (0.0%) |
| $750,000 to $999,999 | 0 (0.0%) | 0 (0.0%) |
| $1,000,000 or more | 0 (0.0%) | 0 (0.0%) |
| Total | 808 (100.0%) | 718 (100.0%) |
Household Income by Mortgage Status in Wellston
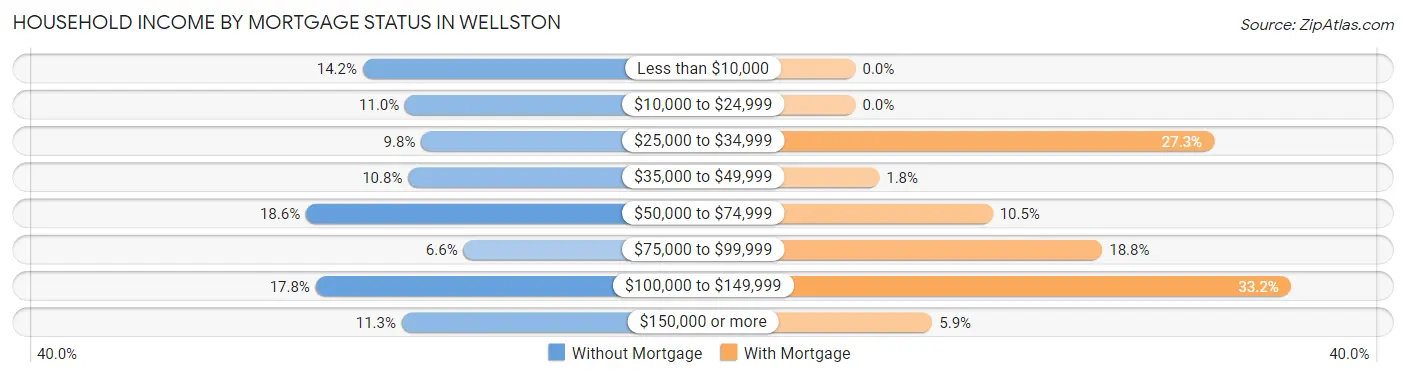
| Household Income | Without Mortgage | With Mortgage |
| Less than $10,000 | 115 (14.2%) | 0 (0.0%) |
| $10,000 to $24,999 | 89 (11.0%) | 0 (0.0%) |
| $25,000 to $34,999 | 79 (9.8%) | 196 (27.3%) |
| $35,000 to $49,999 | 87 (10.8%) | 13 (1.8%) |
| $50,000 to $74,999 | 150 (18.6%) | 75 (10.4%) |
| $75,000 to $99,999 | 53 (6.6%) | 135 (18.8%) |
| $100,000 to $149,999 | 144 (17.8%) | 238 (33.2%) |
| $150,000 or more | 91 (11.3%) | 42 (5.9%) |
| Total | 808 (100.0%) | 718 (100.0%) |
Property Value to Household Income Ratio in Wellston
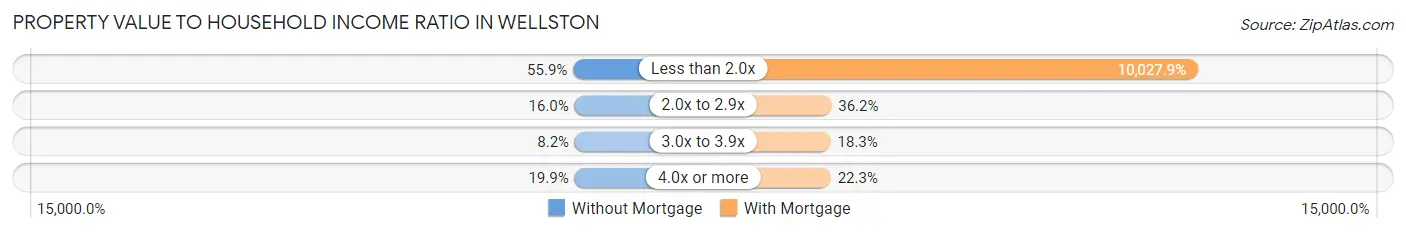
| Value-to-Income Ratio | Without Mortgage | With Mortgage |
| Less than 2.0x | 452 (55.9%) | 72,000 (10,027.9%) |
| 2.0x to 2.9x | 129 (16.0%) | 260 (36.2%) |
| 3.0x to 3.9x | 66 (8.2%) | 131 (18.2%) |
| 4.0x or more | 161 (19.9%) | 160 (22.3%) |
| Total | 808 (100.0%) | 718 (100.0%) |
Real Estate Taxes by Mortgage Status in Wellston
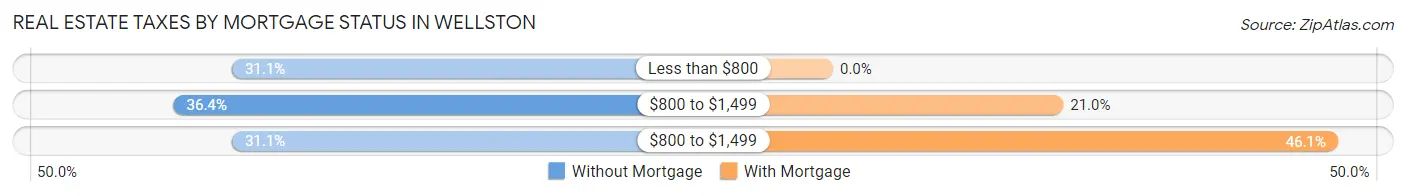
| Property Taxes | Without Mortgage | With Mortgage |
| Less than $800 | 251 (31.1%) | 0 (0.0%) |
| $800 to $1,499 | 294 (36.4%) | 151 (21.0%) |
| $800 to $1,499 | 251 (31.1%) | 331 (46.1%) |
| Total | 808 (100.0%) | 718 (100.0%) |
Health & Disability in Wellston
Health Insurance Coverage by Age in Wellston
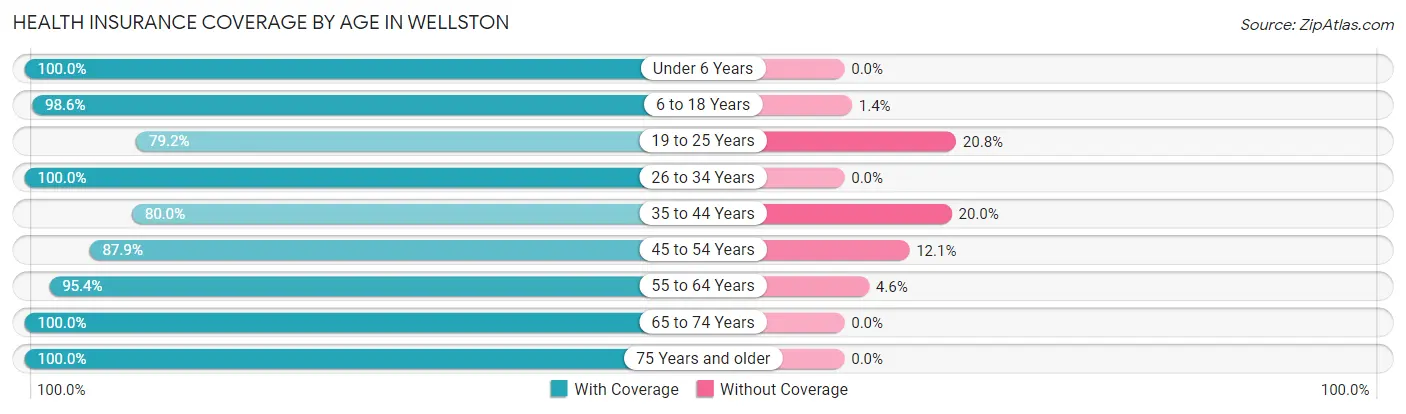
| Age Bracket | With Coverage | Without Coverage |
| Under 6 Years | 257 (100.0%) | 0 (0.0%) |
| 6 to 18 Years | 1,191 (98.6%) | 17 (1.4%) |
| 19 to 25 Years | 293 (79.2%) | 77 (20.8%) |
| 26 to 34 Years | 510 (100.0%) | 0 (0.0%) |
| 35 to 44 Years | 552 (80.0%) | 138 (20.0%) |
| 45 to 54 Years | 588 (87.9%) | 81 (12.1%) |
| 55 to 64 Years | 624 (95.4%) | 30 (4.6%) |
| 65 to 74 Years | 675 (100.0%) | 0 (0.0%) |
| 75 Years and older | 277 (100.0%) | 0 (0.0%) |
| Total | 4,967 (93.5%) | 343 (6.5%) |
Health Insurance Coverage by Citizenship Status in Wellston
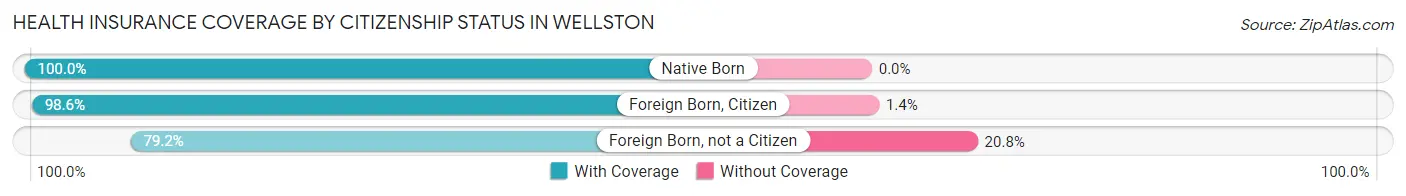
| Citizenship Status | With Coverage | Without Coverage |
| Native Born | 257 (100.0%) | 0 (0.0%) |
| Foreign Born, Citizen | 1,191 (98.6%) | 17 (1.4%) |
| Foreign Born, not a Citizen | 293 (79.2%) | 77 (20.8%) |
Health Insurance Coverage by Household Income in Wellston
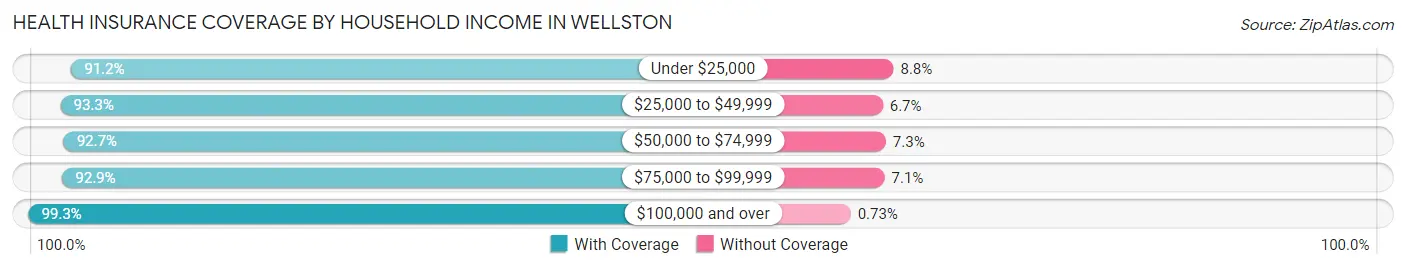
| Household Income | With Coverage | Without Coverage |
| Under $25,000 | 1,042 (91.2%) | 100 (8.8%) |
| $25,000 to $49,999 | 844 (93.3%) | 61 (6.7%) |
| $50,000 to $74,999 | 1,112 (92.7%) | 88 (7.3%) |
| $75,000 to $99,999 | 1,155 (92.9%) | 88 (7.1%) |
| $100,000 and over | 814 (99.3%) | 6 (0.7%) |
Public vs Private Health Insurance Coverage by Age in Wellston
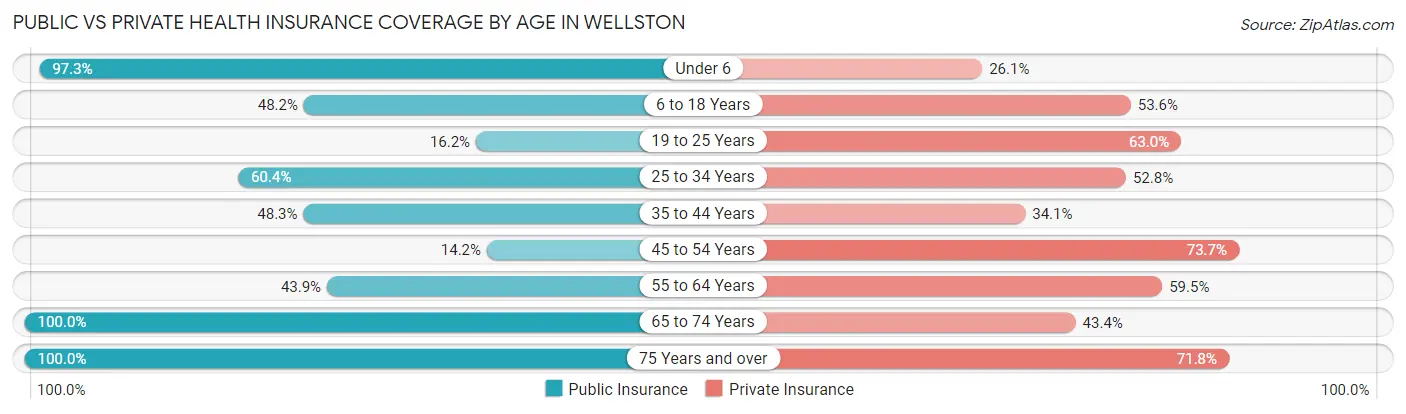
| Age Bracket | Public Insurance | Private Insurance |
| Under 6 | 250 (97.3%) | 67 (26.1%) |
| 6 to 18 Years | 582 (48.2%) | 648 (53.6%) |
| 19 to 25 Years | 60 (16.2%) | 233 (63.0%) |
| 25 to 34 Years | 308 (60.4%) | 269 (52.7%) |
| 35 to 44 Years | 333 (48.3%) | 235 (34.1%) |
| 45 to 54 Years | 95 (14.2%) | 493 (73.7%) |
| 55 to 64 Years | 287 (43.9%) | 389 (59.5%) |
| 65 to 74 Years | 675 (100.0%) | 293 (43.4%) |
| 75 Years and over | 277 (100.0%) | 199 (71.8%) |
| Total | 2,867 (54.0%) | 2,826 (53.2%) |
Disability Status by Sex by Age in Wellston
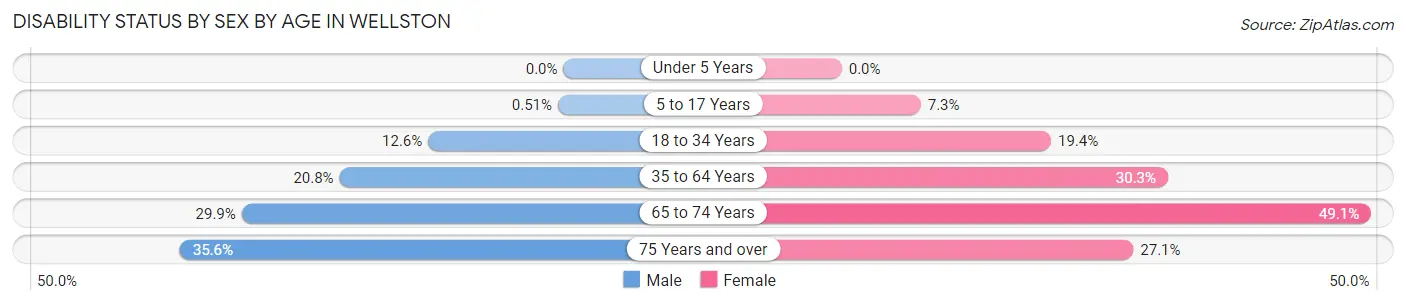
| Age Bracket | Male | Female |
| Under 5 Years | 0 (0.0%) | 0 (0.0%) |
| 5 to 17 Years | 3 (0.5%) | 42 (7.3%) |
| 18 to 34 Years | 63 (12.6%) | 87 (19.4%) |
| 35 to 64 Years | 191 (20.8%) | 331 (30.3%) |
| 65 to 74 Years | 83 (29.9%) | 195 (49.1%) |
| 75 Years and over | 21 (35.6%) | 59 (27.1%) |
Disability Class by Sex by Age in Wellston
Disability Class: Hearing Difficulty
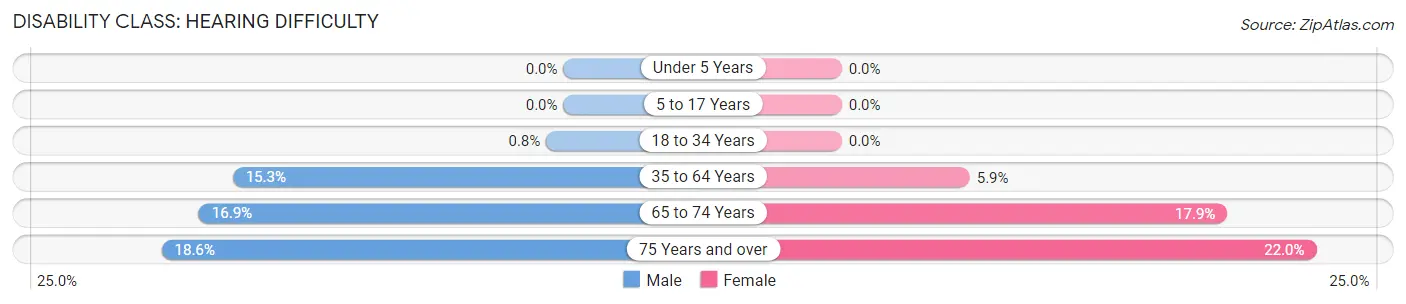
| Age Bracket | Male | Female |
| Under 5 Years | 0 (0.0%) | 0 (0.0%) |
| 5 to 17 Years | 0 (0.0%) | 0 (0.0%) |
| 18 to 34 Years | 4 (0.8%) | 0 (0.0%) |
| 35 to 64 Years | 141 (15.3%) | 65 (5.9%) |
| 65 to 74 Years | 47 (16.9%) | 71 (17.9%) |
| 75 Years and over | 11 (18.6%) | 48 (22.0%) |
Disability Class: Vision Difficulty
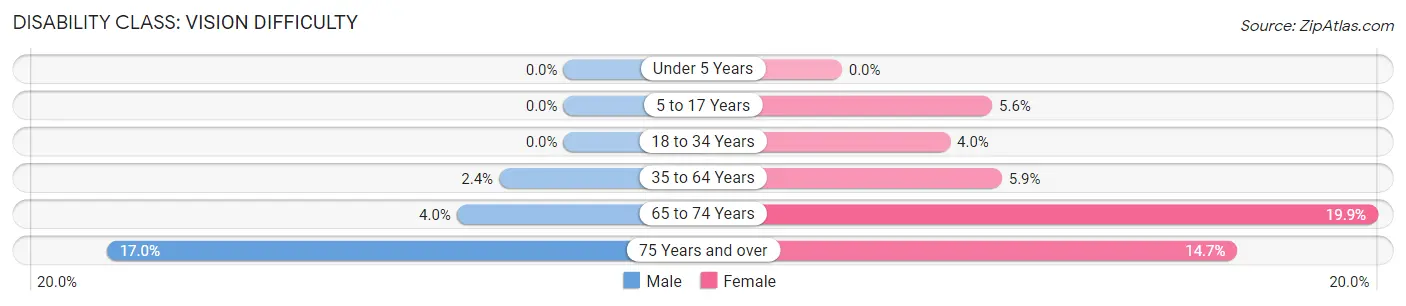
| Age Bracket | Male | Female |
| Under 5 Years | 0 (0.0%) | 0 (0.0%) |
| 5 to 17 Years | 0 (0.0%) | 32 (5.6%) |
| 18 to 34 Years | 0 (0.0%) | 18 (4.0%) |
| 35 to 64 Years | 22 (2.4%) | 65 (5.9%) |
| 65 to 74 Years | 11 (4.0%) | 79 (19.9%) |
| 75 Years and over | 10 (17.0%) | 32 (14.7%) |
Disability Class: Cognitive Difficulty
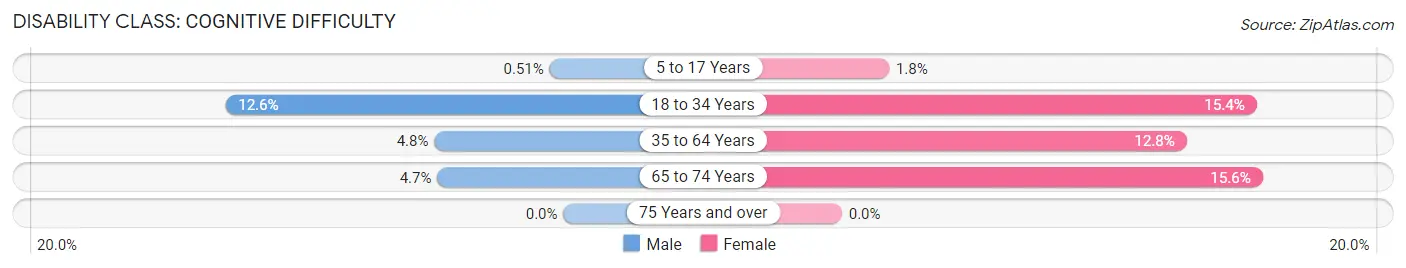
| Age Bracket | Male | Female |
| 5 to 17 Years | 3 (0.5%) | 10 (1.8%) |
| 18 to 34 Years | 63 (12.6%) | 69 (15.4%) |
| 35 to 64 Years | 44 (4.8%) | 140 (12.8%) |
| 65 to 74 Years | 13 (4.7%) | 62 (15.6%) |
| 75 Years and over | 0 (0.0%) | 0 (0.0%) |
Disability Class: Ambulatory Difficulty
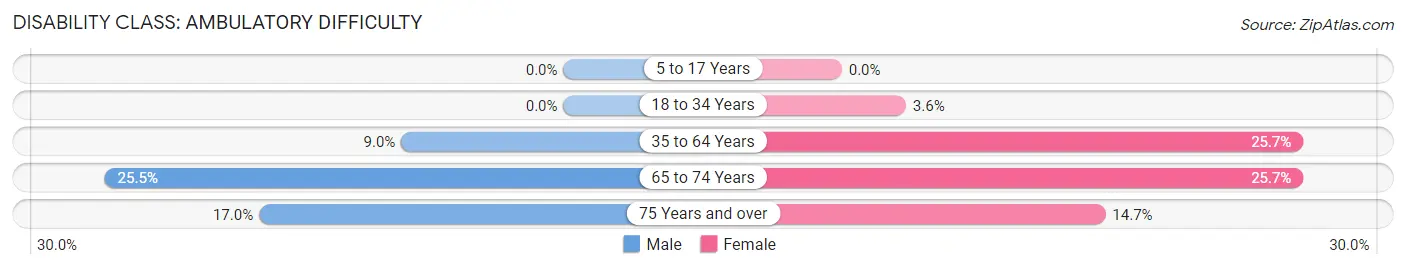
| Age Bracket | Male | Female |
| 5 to 17 Years | 0 (0.0%) | 0 (0.0%) |
| 18 to 34 Years | 0 (0.0%) | 16 (3.6%) |
| 35 to 64 Years | 83 (9.0%) | 281 (25.7%) |
| 65 to 74 Years | 71 (25.5%) | 102 (25.7%) |
| 75 Years and over | 10 (17.0%) | 32 (14.7%) |
Disability Class: Self-Care Difficulty
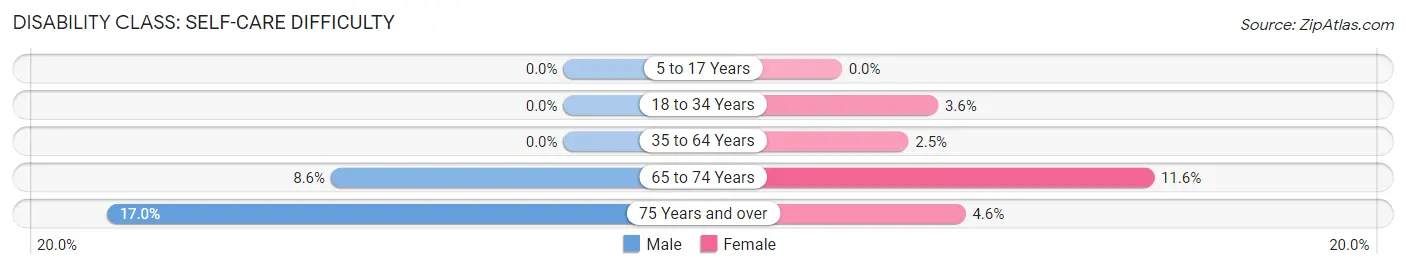
| Age Bracket | Male | Female |
| 5 to 17 Years | 0 (0.0%) | 0 (0.0%) |
| 18 to 34 Years | 0 (0.0%) | 16 (3.6%) |
| 35 to 64 Years | 0 (0.0%) | 27 (2.5%) |
| 65 to 74 Years | 24 (8.6%) | 46 (11.6%) |
| 75 Years and over | 10 (17.0%) | 10 (4.6%) |
Technology Access in Wellston
Computing Device Access in Wellston
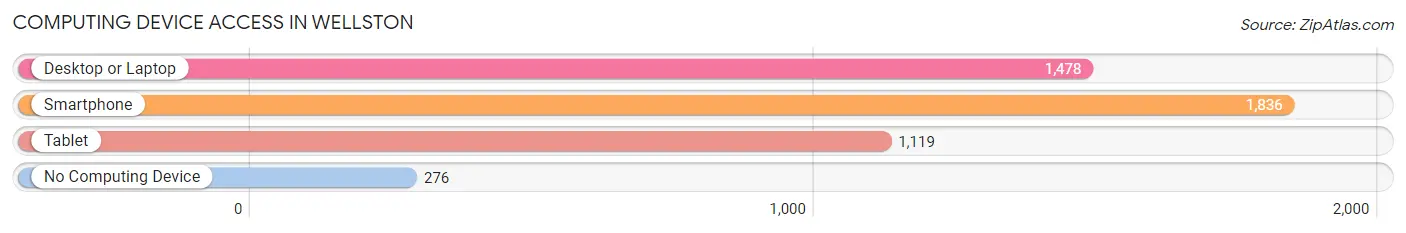
| Device Type | # Households | % Households |
| Desktop or Laptop | 1,478 | 66.8% |
| Smartphone | 1,836 | 83.0% |
| Tablet | 1,119 | 50.6% |
| No Computing Device | 276 | 12.5% |
| Total | 2,211 | 100.0% |
Internet Access in Wellston
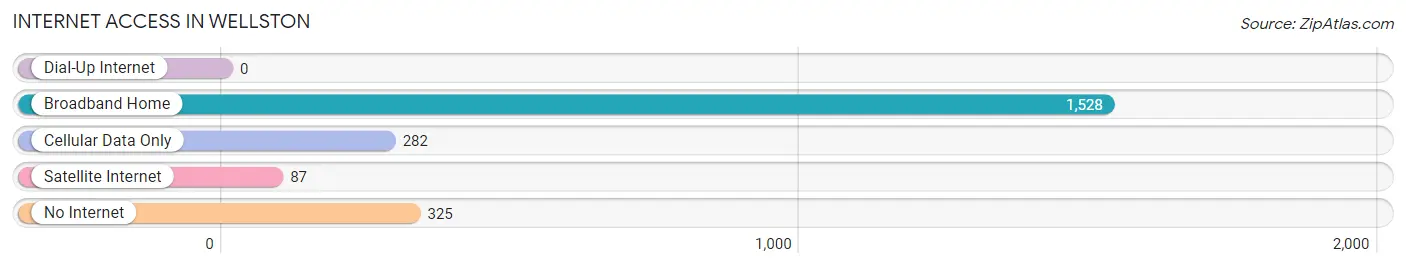
| Internet Type | # Households | % Households |
| Dial-Up Internet | 0 | 0.0% |
| Broadband Home | 1,528 | 69.1% |
| Cellular Data Only | 282 | 12.8% |
| Satellite Internet | 87 | 3.9% |
| No Internet | 325 | 14.7% |
| Total | 2,211 | 100.0% |
Wellston Summary
Wellston, Ohio is a small city located in Jackson County, Ohio. It is situated in the Appalachian foothills of the Appalachian Mountains, and is part of the larger Columbus-Marion-Zanesville Combined Statistical Area. The city has a population of approximately 4,000 people, and is the county seat of Jackson County.
History
Wellston was founded in 1817 by a group of settlers from Virginia. The city was named after the nearby Wellston Creek, which was named after a local settler, William Weller. The city was incorporated in 1837, and was the first city in Jackson County to be incorporated.
The city was an important stop on the Underground Railroad, and was home to several prominent abolitionists. During the Civil War, Wellston was a major supply center for the Union Army. After the war, the city experienced a period of growth and prosperity, and was home to several factories and businesses.
Geography
Wellston is located in the Appalachian foothills of the Appalachian Mountains. The city is situated in the Jackson County Valley, and is surrounded by rolling hills and forests. The city is located approximately 50 miles south of Columbus, Ohio, and is part of the larger Columbus-Marion-Zanesville Combined Statistical Area.
The city has a total area of 2.3 square miles, all of which is land. The city is located at an elevation of 890 feet above sea level. The climate in Wellston is classified as humid continental, with hot summers and cold winters.
Economy
Wellston’s economy is largely based on manufacturing and agriculture. The city is home to several factories and businesses, including a paper mill, a furniture factory, and a metal fabrication plant. The city is also home to several farms, which produce a variety of crops, including corn, soybeans, and wheat.
The city is also home to several retail stores, restaurants, and other businesses. The city is served by the Jackson County Airport, which provides air service to the surrounding area.
Demographics
As of the 2010 census, the population of Wellston was 4,000. The racial makeup of the city was 95.3% White, 1.2% African American, 0.3% Native American, 0.2% Asian, 0.1% Pacific Islander, and 2.9% from other races. Hispanic or Latino of any race were 1.7% of the population.
The median household income in Wellston was $30,938, and the median family income was $37,813. The per capita income in the city was $15,945. About 17.2% of the population was below the poverty line.
Wellston is served by the Jackson County School District, which includes two elementary schools, one middle school, and one high school. The city is also home to several churches, including the First United Methodist Church, the First Presbyterian Church, and the Wellston Church of Christ.
Common Questions
What is Per Capita Income in Wellston?
Per Capita income in Wellston is $25,489.
What is the Median Family Income in Wellston?
Median Family Income in Wellston is $61,292.
What is the Median Household income in Wellston?
Median Household Income in Wellston is $51,597.
What is Income or Wage Gap in Wellston?
Income or Wage Gap in Wellston is 31.6%.
Women in Wellston earn 68.4 cents for every dollar earned by a man.
What is Family Income Deficit in Wellston?
Family Income Deficit in Wellston is $5,853.
Families that are below poverty line in Wellston earn $5,853 less on average than the poverty threshold level.
What is Inequality or Gini Index in Wellston?
Inequality or Gini Index in Wellston is 0.43.
What is the Total Population of Wellston?
Total Population of Wellston is 5,420.
What is the Total Male Population of Wellston?
Total Male Population of Wellston is 2,472.
What is the Total Female Population of Wellston?
Total Female Population of Wellston is 2,948.
What is the Ratio of Males per 100 Females in Wellston?
There are 83.85 Males per 100 Females in Wellston.
What is the Ratio of Females per 100 Males in Wellston?
There are 119.26 Females per 100 Males in Wellston.
What is the Median Population Age in Wellston?
Median Population Age in Wellston is 38.8 Years.
What is the Average Family Size in Wellston
Average Family Size in Wellston is 2.7 People.
What is the Average Household Size in Wellston
Average Household Size in Wellston is 2.4 People.
How Large is the Labor Force in Wellston?
There are 2,199 People in the Labor Forcein in Wellston.
What is the Percentage of People in the Labor Force in Wellston?
51.5% of People are in the Labor Force in Wellston.
What is the Unemployment Rate in Wellston?
Unemployment Rate in Wellston is 5.6%.