Castine, OH Map & Demographics
Castine Map
Castine Overview
$20,739
PER CAPITA INCOME
$63,438
AVG FAMILY INCOME
$46,250
AVG HOUSEHOLD INCOME
0.42
INEQUALITY / GINI INDEX
121
TOTAL POPULATION
54
MALE POPULATION
67
FEMALE POPULATION
80.60
MALES / 100 FEMALES
124.07
FEMALES / 100 MALES
34.5
MEDIAN AGE
3.6
AVG FAMILY SIZE
3.0
AVG HOUSEHOLD SIZE
45
LABOR FORCE [ PEOPLE ]
57.7%
PERCENT IN LABOR FORCE
Castine Area Codes
Income in Castine
Income Overview in Castine
Per Capita Income in Castine is $20,739, while median incomes of families and households are $63,438 and $46,250 respectively.
| Characteristic | Number | Measure |
| Per Capita Income | 121 | $20,739 |
| Median Family Income | 31 | $63,438 |
| Mean Family Income | 31 | $67,642 |
| Median Household Income | 41 | $46,250 |
| Mean Household Income | 41 | $58,056 |
| Income Deficit | 31 | $0 |
| Wage / Income Gap (%) | 121 | 0.00% |
| Wage / Income Gap ($) | 121 | 100.00¢ per $1 |
| Gini / Inequality Index | 121 | 0.42 |
Earnings by Sex in Castine
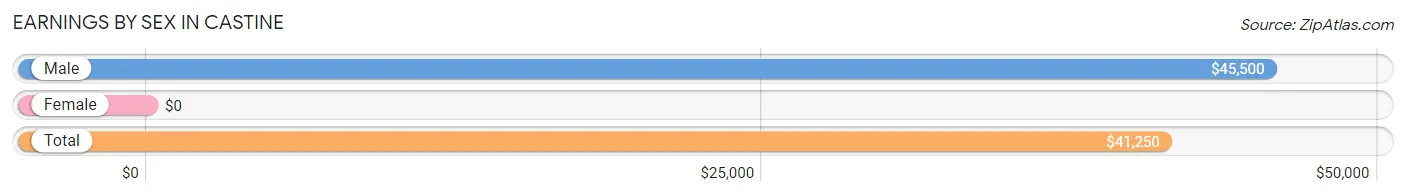
| Sex | Number | Average Earnings |
| Male | 32 (62.7%) | $45,500 |
| Female | 19 (37.2%) | $0 |
| Total | 51 (100.0%) | $41,250 |
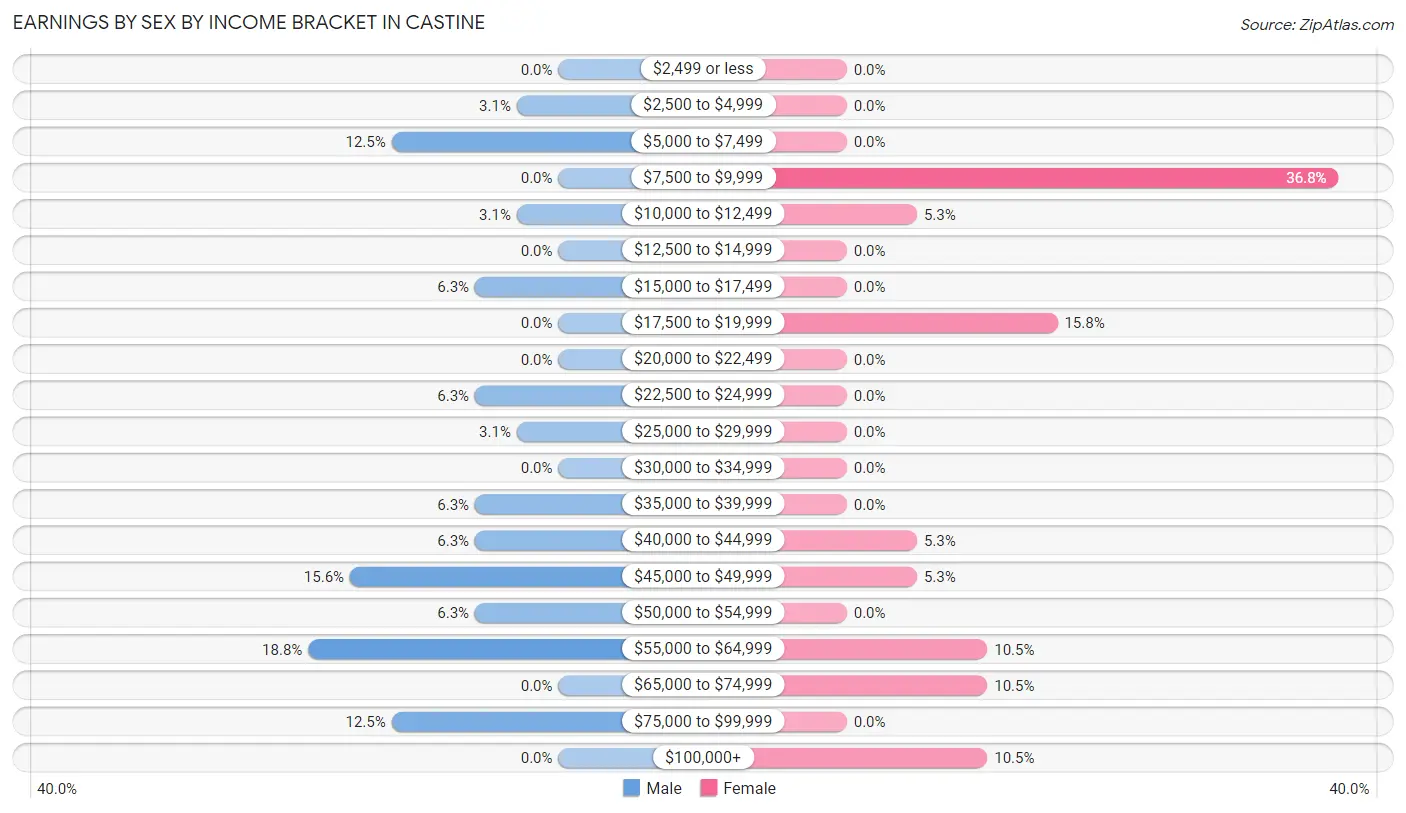
Earnings by Sex by Income Bracket in Castine
The most common earnings brackets in Castine are $55,000 to $64,999 for men (6 | 18.8%) and $7,500 to $9,999 for women (7 | 36.8%).
| Income | Male | Female |
| $2,499 or less | 0 (0.0%) | 0 (0.0%) |
| $2,500 to $4,999 | 1 (3.1%) | 0 (0.0%) |
| $5,000 to $7,499 | 4 (12.5%) | 0 (0.0%) |
| $7,500 to $9,999 | 0 (0.0%) | 7 (36.8%) |
| $10,000 to $12,499 | 1 (3.1%) | 1 (5.3%) |
| $12,500 to $14,999 | 0 (0.0%) | 0 (0.0%) |
| $15,000 to $17,499 | 2 (6.2%) | 0 (0.0%) |
| $17,500 to $19,999 | 0 (0.0%) | 3 (15.8%) |
| $20,000 to $22,499 | 0 (0.0%) | 0 (0.0%) |
| $22,500 to $24,999 | 2 (6.2%) | 0 (0.0%) |
| $25,000 to $29,999 | 1 (3.1%) | 0 (0.0%) |
| $30,000 to $34,999 | 0 (0.0%) | 0 (0.0%) |
| $35,000 to $39,999 | 2 (6.2%) | 0 (0.0%) |
| $40,000 to $44,999 | 2 (6.2%) | 1 (5.3%) |
| $45,000 to $49,999 | 5 (15.6%) | 1 (5.3%) |
| $50,000 to $54,999 | 2 (6.2%) | 0 (0.0%) |
| $55,000 to $64,999 | 6 (18.8%) | 2 (10.5%) |
| $65,000 to $74,999 | 0 (0.0%) | 2 (10.5%) |
| $75,000 to $99,999 | 4 (12.5%) | 0 (0.0%) |
| $100,000+ | 0 (0.0%) | 2 (10.5%) |
| Total | 32 (100.0%) | 19 (100.0%) |
Earnings by Sex by Educational Attainment in Castine
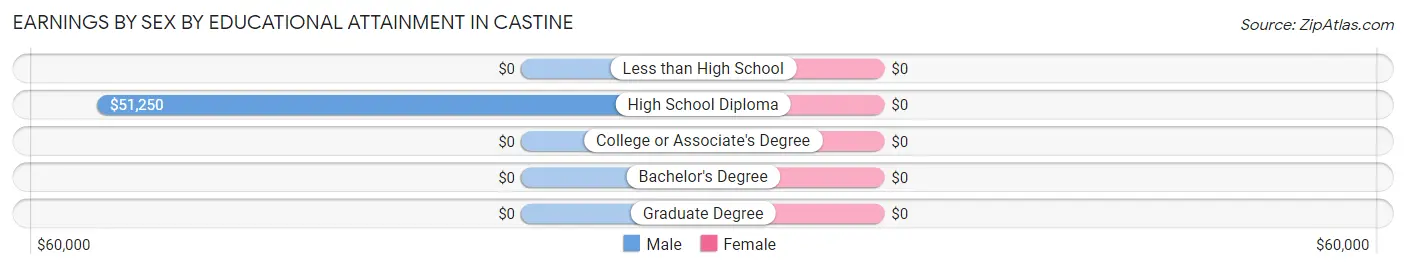
| Educational Attainment | Male Income | Female Income |
| Less than High School | - | - |
| High School Diploma | $51,250 | $0 |
| College or Associate's Degree | - | - |
| Bachelor's Degree | - | - |
| Graduate Degree | - | - |
| Total | $50,625 | $0 |
Family Income in Castine
Family Income Brackets in Castine
According to the Castine family income data, there are 7 families falling into the $50,000 to $74,999 income range, which is the most common income bracket and makes up 22.6% of all families.
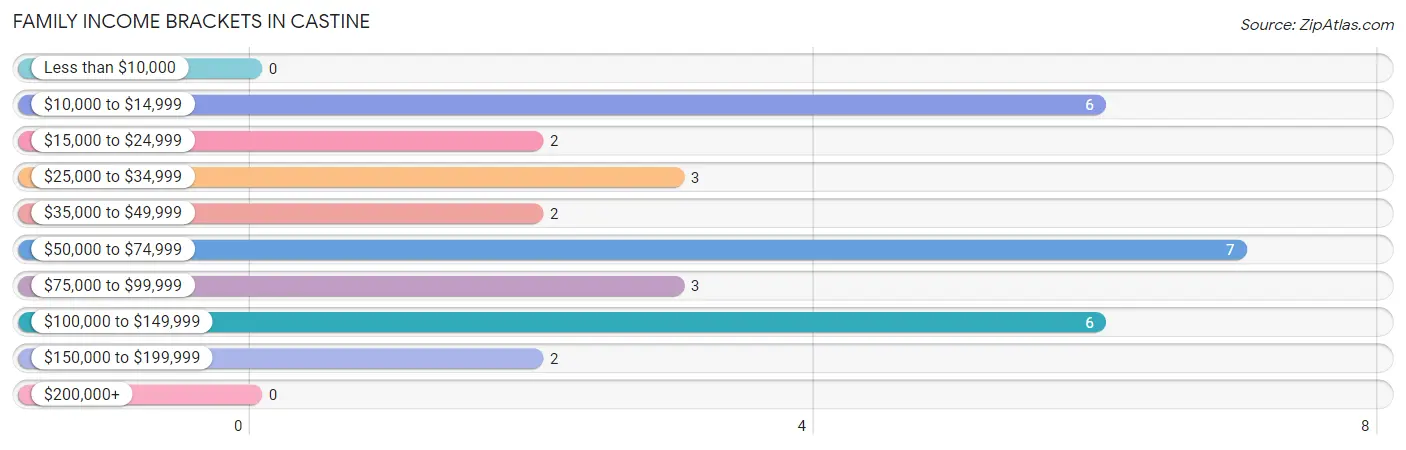
| Income Bracket | # Families | % Families |
| Less than $10,000 | 0 | 0.0% |
| $10,000 to $14,999 | 6 | 19.4% |
| $15,000 to $24,999 | 2 | 6.5% |
| $25,000 to $34,999 | 3 | 9.7% |
| $35,000 to $49,999 | 2 | 6.5% |
| $50,000 to $74,999 | 7 | 22.6% |
| $75,000 to $99,999 | 3 | 9.7% |
| $100,000 to $149,999 | 6 | 19.4% |
| $150,000 to $199,999 | 2 | 6.5% |
| $200,000+ | 0 | 0.0% |
Family Income by Famaliy Size in Castine
2-person families (11 | 35.5%) account for the highest median family income in Castine with $66,875 per family, while 2-person families (11 | 35.5%) have the highest median income of $33,438 per family member.
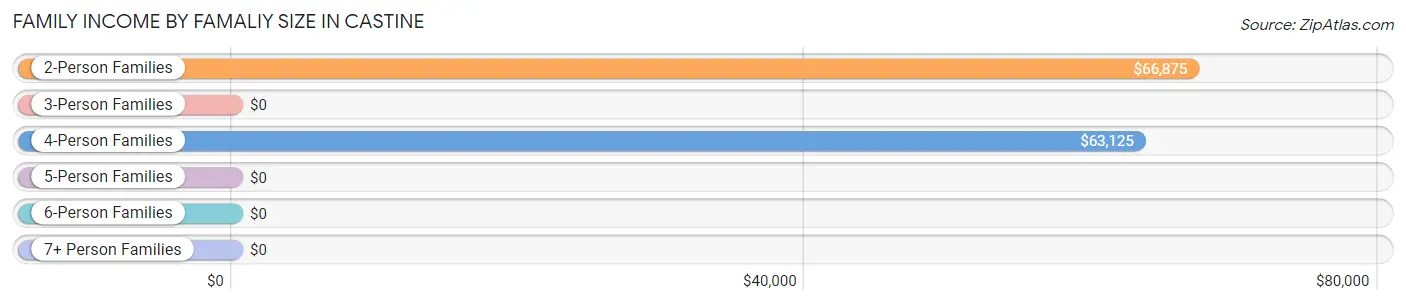
| Income Bracket | # Families | Median Income |
| 2-Person Families | 11 (35.5%) | $66,875 |
| 3-Person Families | 2 (6.5%) | $0 |
| 4-Person Families | 10 (32.3%) | $63,125 |
| 5-Person Families | 0 (0.0%) | $0 |
| 6-Person Families | 8 (25.8%) | $0 |
| 7+ Person Families | 0 (0.0%) | $0 |
| Total | 31 (100.0%) | $63,438 |
Family Income by Number of Earners in Castine
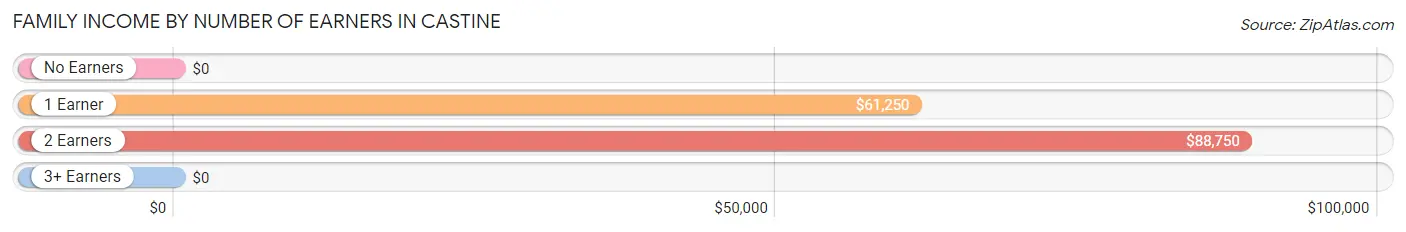
| Number of Earners | # Families | Median Income |
| No Earners | 4 (12.9%) | $0 |
| 1 Earner | 9 (29.0%) | $61,250 |
| 2 Earners | 18 (58.1%) | $88,750 |
| 3+ Earners | 0 (0.0%) | $0 |
| Total | 31 (100.0%) | $63,438 |
Household Income in Castine
Household Income Brackets in Castine
With 7 households falling in the category, the $35,000 to $49,999 income range is the most frequent in Castine, accounting for 17.1% of all households.
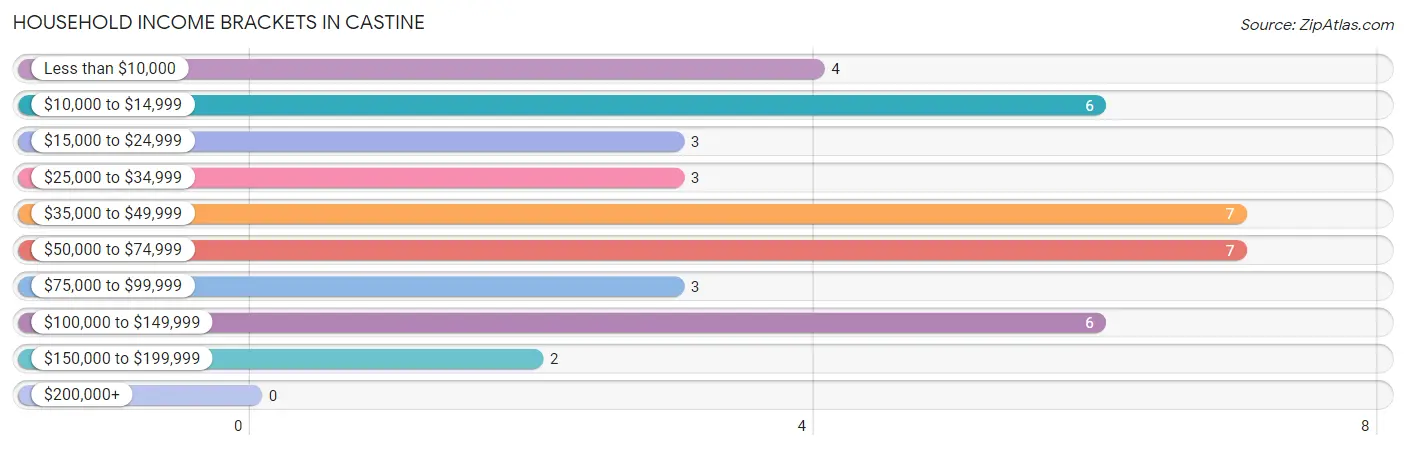
| Income Bracket | # Households | % Households |
| Less than $10,000 | 4 | 9.8% |
| $10,000 to $14,999 | 6 | 14.6% |
| $15,000 to $24,999 | 3 | 7.3% |
| $25,000 to $34,999 | 3 | 7.3% |
| $35,000 to $49,999 | 7 | 17.1% |
| $50,000 to $74,999 | 7 | 17.1% |
| $75,000 to $99,999 | 3 | 7.3% |
| $100,000 to $149,999 | 6 | 14.6% |
| $150,000 to $199,999 | 2 | 4.9% |
| $200,000+ | 0 | 0.0% |
Household Income by Householder Age in Castine
The median household income in Castine is $46,250, with the highest median household income of $42,500 found in the 65+ years age bracket for the primary householder. A total of 10 households (24.4%) fall into this category. Meanwhile, the 15 to 24 years age bracket for the primary householder has the lowest median household income of $0, with 2 households (4.9%) in this group.
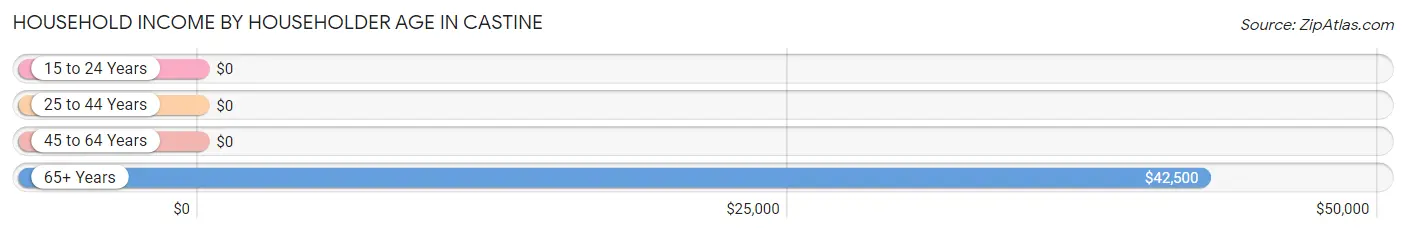
| Income Bracket | # Households | Median Income |
| 15 to 24 Years | 2 (4.9%) | $0 |
| 25 to 44 Years | 15 (36.6%) | $0 |
| 45 to 64 Years | 14 (34.2%) | $0 |
| 65+ Years | 10 (24.4%) | $42,500 |
| Total | 41 (100.0%) | $46,250 |
Poverty in Castine
Income Below Poverty by Sex and Age in Castine
With 25.9% poverty level for males and 49.2% for females among the residents of Castine, 6 to 11 year old males and 15 year old females are the most vulnerable to poverty, with 7 males (77.8%) and 6 females (100.0%) in their respective age groups living below the poverty level.
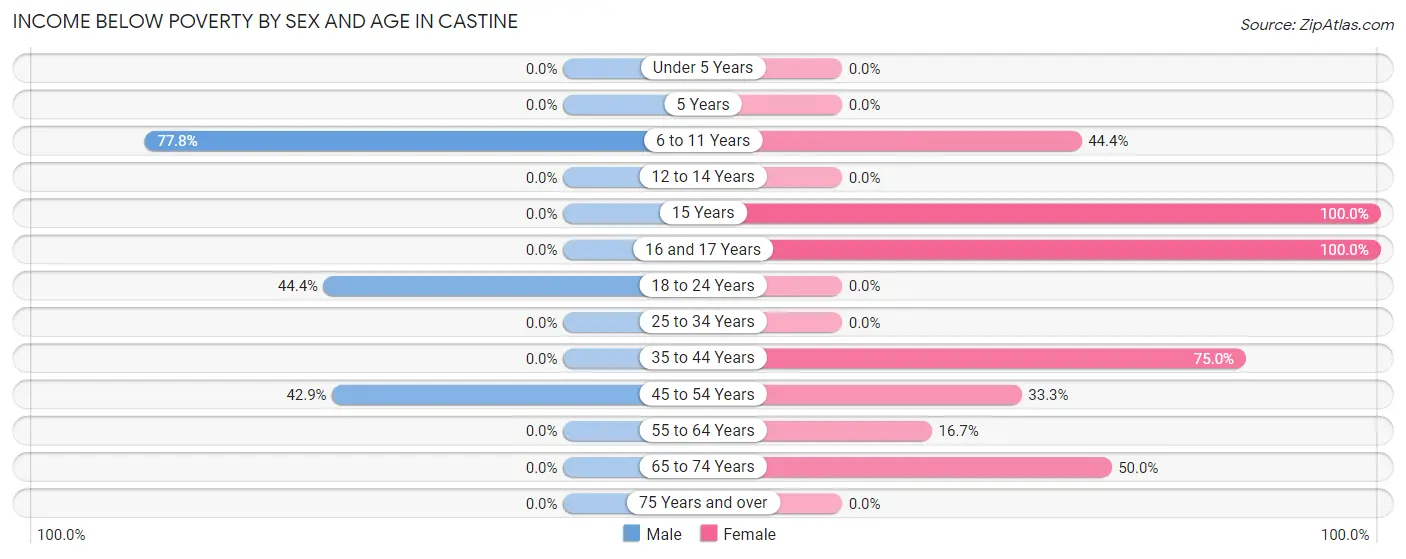
| Age Bracket | Male | Female |
| Under 5 Years | 0 (0.0%) | 0 (0.0%) |
| 5 Years | 0 (0.0%) | 0 (0.0%) |
| 6 to 11 Years | 7 (77.8%) | 8 (44.4%) |
| 12 to 14 Years | 0 (0.0%) | 0 (0.0%) |
| 15 Years | 0 (0.0%) | 6 (100.0%) |
| 16 and 17 Years | 0 (0.0%) | 5 (100.0%) |
| 18 to 24 Years | 4 (44.4%) | 0 (0.0%) |
| 25 to 34 Years | 0 (0.0%) | 0 (0.0%) |
| 35 to 44 Years | 0 (0.0%) | 6 (75.0%) |
| 45 to 54 Years | 3 (42.9%) | 3 (33.3%) |
| 55 to 64 Years | 0 (0.0%) | 1 (16.7%) |
| 65 to 74 Years | 0 (0.0%) | 4 (50.0%) |
| 75 Years and over | 0 (0.0%) | 0 (0.0%) |
| Total | 14 (25.9%) | 33 (49.2%) |
Income Above Poverty by Sex and Age in Castine
According to the poverty statistics in Castine, males aged under 5 years and females aged 12 to 14 years are the age groups that are most secure financially, with 100.0% of males and 100.0% of females in these age groups living above the poverty line.
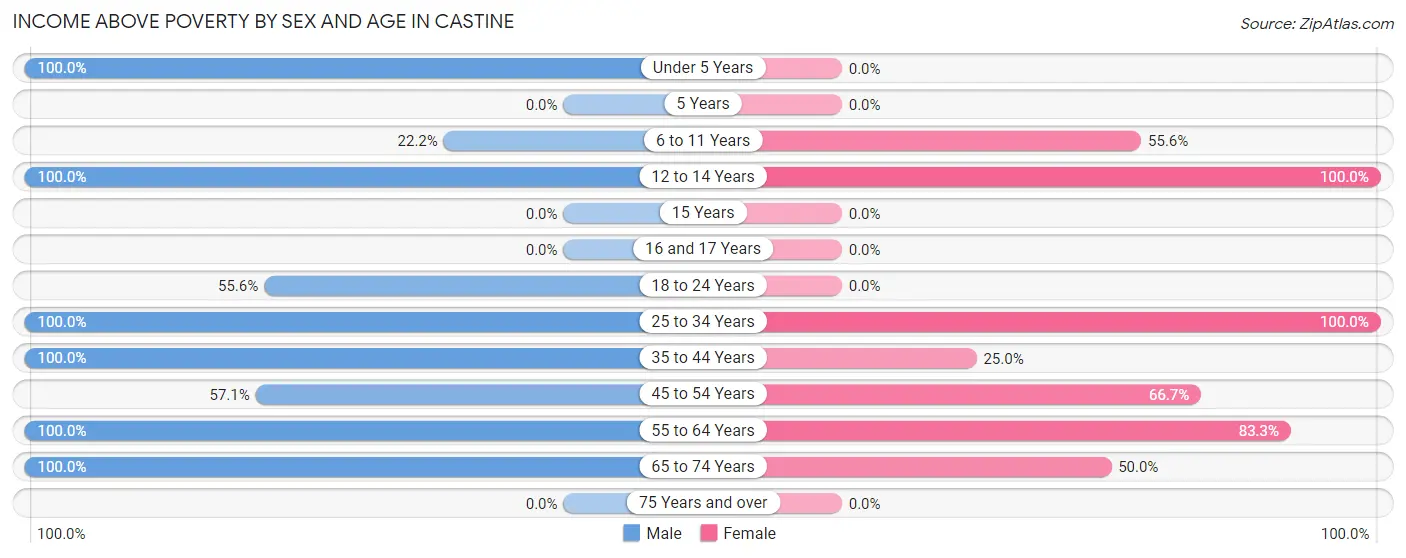
| Age Bracket | Male | Female |
| Under 5 Years | 1 (100.0%) | 0 (0.0%) |
| 5 Years | 0 (0.0%) | 0 (0.0%) |
| 6 to 11 Years | 2 (22.2%) | 10 (55.6%) |
| 12 to 14 Years | 7 (100.0%) | 2 (100.0%) |
| 15 Years | 0 (0.0%) | 0 (0.0%) |
| 16 and 17 Years | 0 (0.0%) | 0 (0.0%) |
| 18 to 24 Years | 5 (55.6%) | 0 (0.0%) |
| 25 to 34 Years | 1 (100.0%) | 5 (100.0%) |
| 35 to 44 Years | 15 (100.0%) | 2 (25.0%) |
| 45 to 54 Years | 4 (57.1%) | 6 (66.7%) |
| 55 to 64 Years | 1 (100.0%) | 5 (83.3%) |
| 65 to 74 Years | 4 (100.0%) | 4 (50.0%) |
| 75 Years and over | 0 (0.0%) | 0 (0.0%) |
| Total | 40 (74.1%) | 34 (50.7%) |
Income Below Poverty Among Married-Couple Families in Castine
The poverty statistics for married-couple families in Castine show that 16.7% or 3 of the total 18 families live below the poverty line. Families with 1 or 2 children have the highest poverty rate of 30.0%, comprising of 3 families. On the other hand, families with no children have the lowest poverty rate of 0.0%, which includes 0 families.
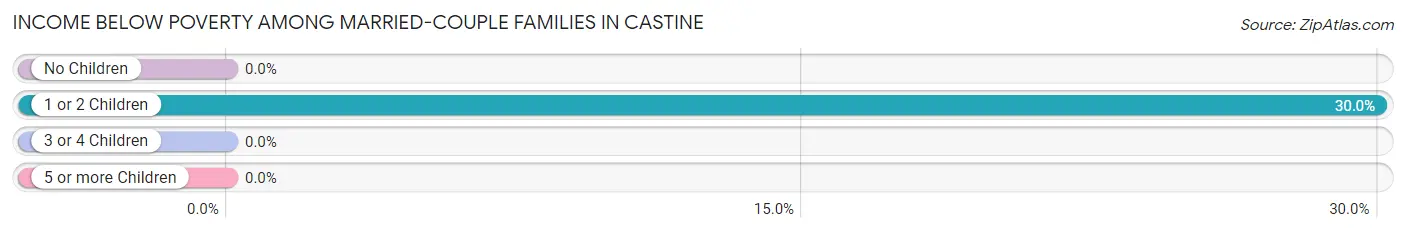
| Children | Above Poverty | Below Poverty |
| No Children | 6 (100.0%) | 0 (0.0%) |
| 1 or 2 Children | 7 (70.0%) | 3 (30.0%) |
| 3 or 4 Children | 2 (100.0%) | 0 (0.0%) |
| 5 or more Children | 0 (0.0%) | 0 (0.0%) |
| Total | 15 (83.3%) | 3 (16.7%) |
Income Below Poverty Among Single-Parent Households in Castine
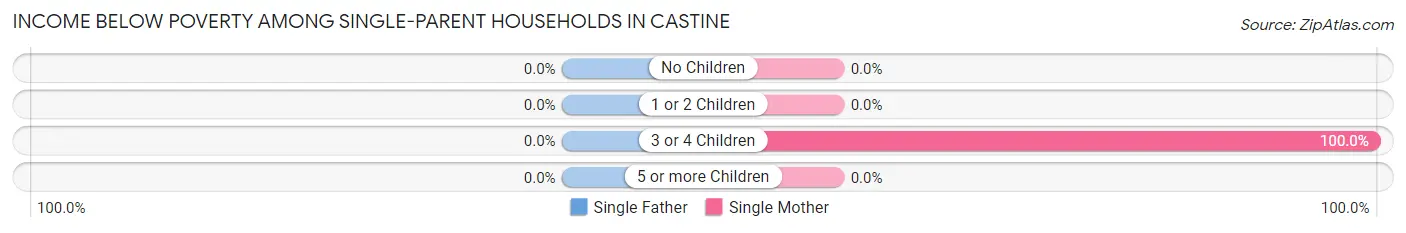
| Children | Single Father | Single Mother |
| No Children | 0 (0.0%) | 0 (0.0%) |
| 1 or 2 Children | 0 (0.0%) | 0 (0.0%) |
| 3 or 4 Children | 0 (0.0%) | 6 (100.0%) |
| 5 or more Children | 0 (0.0%) | 0 (0.0%) |
| Total | 0 (0.0%) | 6 (60.0%) |
Income Below Poverty Among Married-Couple vs Single-Parent Households in Castine
The poverty data for Castine shows that 3 of the married-couple family households (16.7%) and 6 of the single-parent households (46.2%) are living below the poverty level. Within the married-couple family households, those with 1 or 2 children have the highest poverty rate, with 3 households (30.0%) falling below the poverty line. Among the single-parent households, those with 3 or 4 children have the highest poverty rate, with 6 household (100.0%) living below poverty.
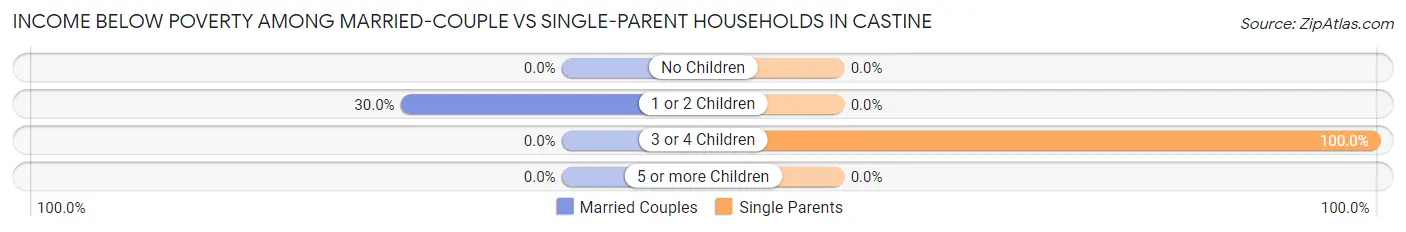
| Children | Married-Couple Families | Single-Parent Households |
| No Children | 0 (0.0%) | 0 (0.0%) |
| 1 or 2 Children | 3 (30.0%) | 0 (0.0%) |
| 3 or 4 Children | 0 (0.0%) | 6 (100.0%) |
| 5 or more Children | 0 (0.0%) | 0 (0.0%) |
| Total | 3 (16.7%) | 6 (46.2%) |
Race in Castine
The most populous races in Castine are White / Caucasian (113 | 93.4%), Two or more Races (5 | 4.1%), and Hispanic or Latino (3 | 2.5%).
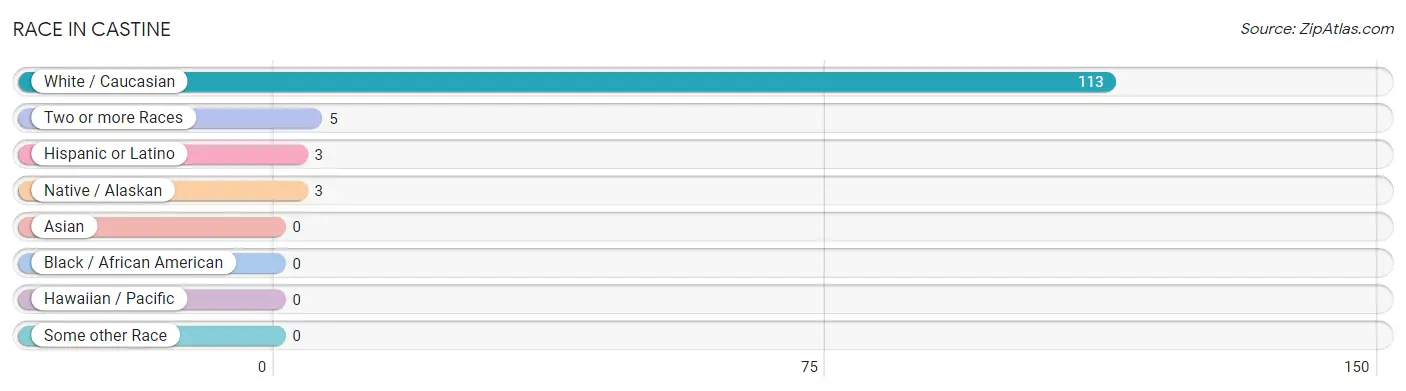
| Race | # Population | % Population |
| Asian | 0 | 0.0% |
| Black / African American | 0 | 0.0% |
| Hawaiian / Pacific | 0 | 0.0% |
| Hispanic or Latino | 3 | 2.5% |
| Native / Alaskan | 3 | 2.5% |
| White / Caucasian | 113 | 93.4% |
| Two or more Races | 5 | 4.1% |
| Some other Race | 0 | 0.0% |
| Total | 121 | 100.0% |
Ancestry in Castine
The most populous ancestries reported in Castine are American (31 | 25.6%), French Canadian (31 | 25.6%), German (17 | 14.1%), Irish (4 | 3.3%), and Dutch (3 | 2.5%), together accounting for 71.1% of all Castine residents.
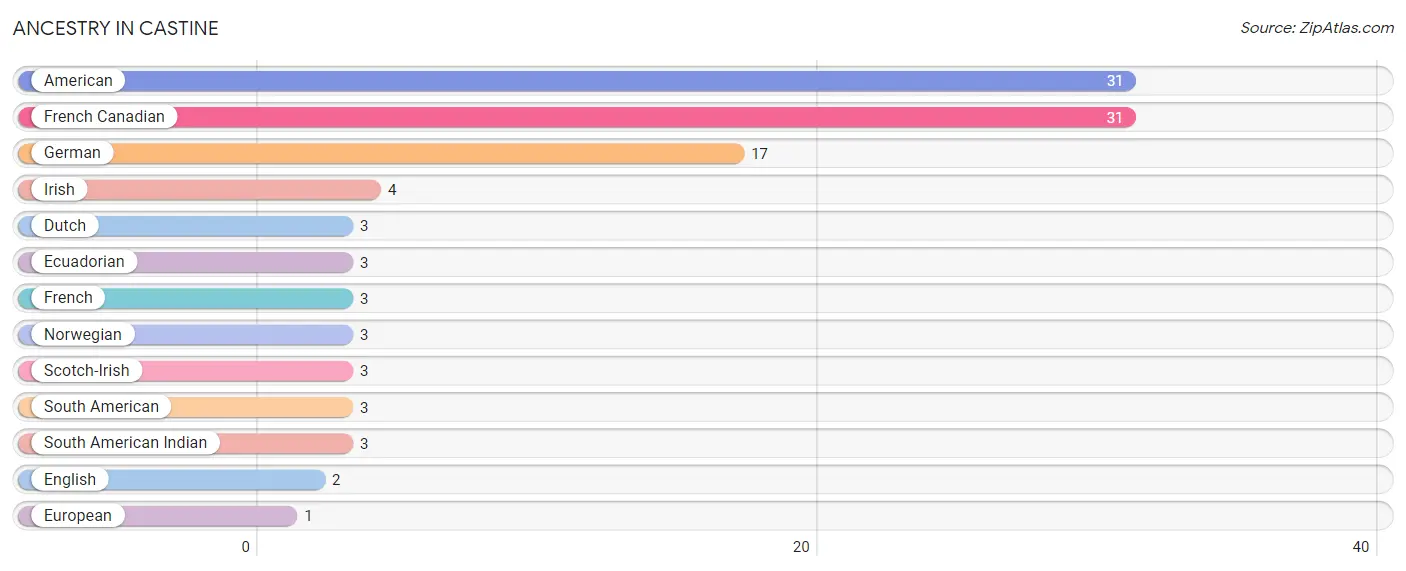
| Ancestry | # Population | % Population |
| American | 31 | 25.6% |
| Dutch | 3 | 2.5% |
| Ecuadorian | 3 | 2.5% |
| English | 2 | 1.7% |
| European | 1 | 0.8% |
| French | 3 | 2.5% |
| French Canadian | 31 | 25.6% |
| German | 17 | 14.1% |
| Irish | 4 | 3.3% |
| Norwegian | 3 | 2.5% |
| Scotch-Irish | 3 | 2.5% |
| South American | 3 | 2.5% |
| South American Indian | 3 | 2.5% | View All 13 Rows |
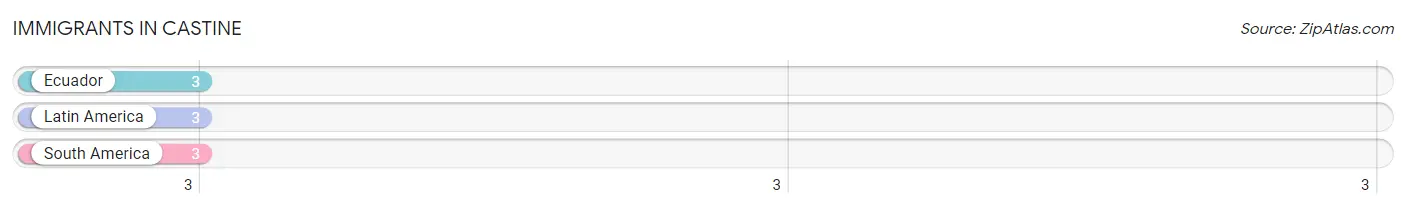
Immigrants in Castine
The most numerous immigrant groups reported in Castine came from Ecuador (3 | 2.5%), Latin America (3 | 2.5%), and South America (3 | 2.5%), together accounting for 7.4% of all Castine residents.
| Immigration Origin | # Population | % Population |
| Ecuador | 3 | 2.5% |
| Latin America | 3 | 2.5% |
| South America | 3 | 2.5% | View All 3 Rows |
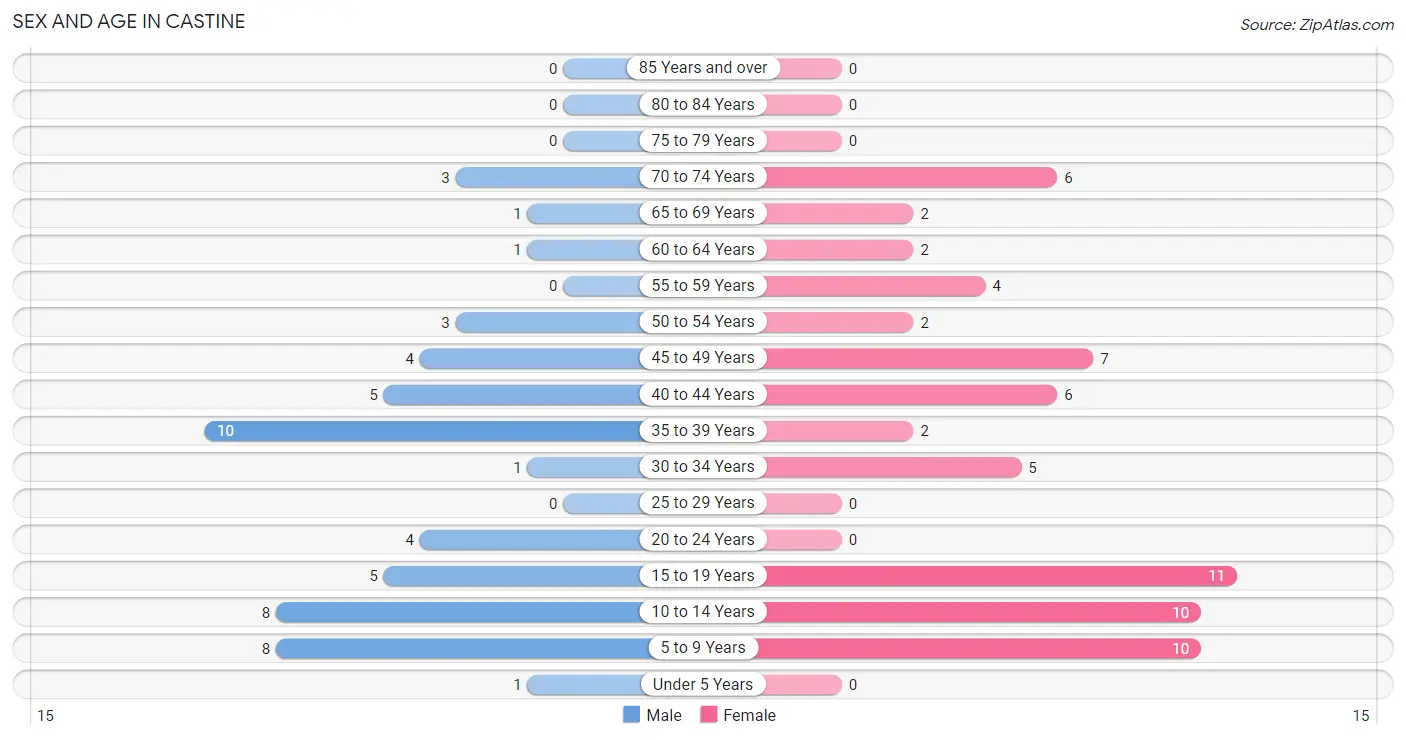
Sex and Age in Castine
Sex and Age in Castine
The most populous age groups in Castine are 35 to 39 Years (10 | 18.5%) for men and 15 to 19 Years (11 | 16.4%) for women.
| Age Bracket | Male | Female |
| Under 5 Years | 1 (1.8%) | 0 (0.0%) |
| 5 to 9 Years | 8 (14.8%) | 10 (14.9%) |
| 10 to 14 Years | 8 (14.8%) | 10 (14.9%) |
| 15 to 19 Years | 5 (9.3%) | 11 (16.4%) |
| 20 to 24 Years | 4 (7.4%) | 0 (0.0%) |
| 25 to 29 Years | 0 (0.0%) | 0 (0.0%) |
| 30 to 34 Years | 1 (1.8%) | 5 (7.5%) |
| 35 to 39 Years | 10 (18.5%) | 2 (3.0%) |
| 40 to 44 Years | 5 (9.3%) | 6 (9.0%) |
| 45 to 49 Years | 4 (7.4%) | 7 (10.4%) |
| 50 to 54 Years | 3 (5.6%) | 2 (3.0%) |
| 55 to 59 Years | 0 (0.0%) | 4 (6.0%) |
| 60 to 64 Years | 1 (1.8%) | 2 (3.0%) |
| 65 to 69 Years | 1 (1.8%) | 2 (3.0%) |
| 70 to 74 Years | 3 (5.6%) | 6 (9.0%) |
| 75 to 79 Years | 0 (0.0%) | 0 (0.0%) |
| 80 to 84 Years | 0 (0.0%) | 0 (0.0%) |
| 85 Years and over | 0 (0.0%) | 0 (0.0%) |
| Total | 54 (100.0%) | 67 (100.0%) |
Families and Households in Castine
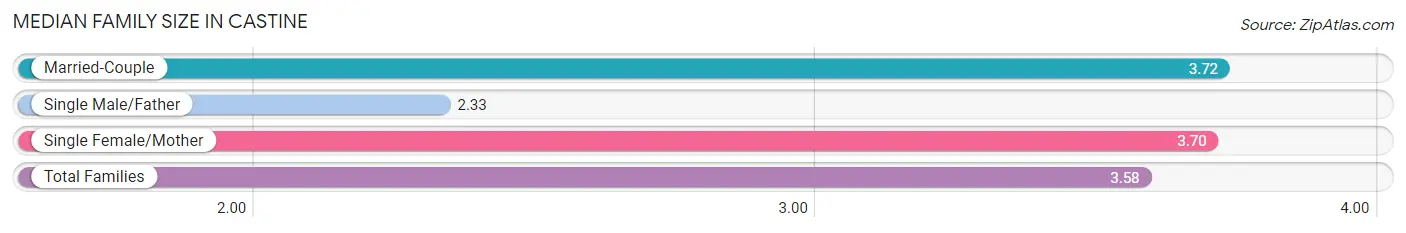
Median Family Size in Castine
The median family size in Castine is 3.58 persons per family, with married-couple families (18 | 58.1%) accounting for the largest median family size of 3.72 persons per family. On the other hand, single male/father families (3 | 9.7%) represent the smallest median family size with 2.33 persons per family.
| Family Type | # Families | Family Size |
| Married-Couple | 18 (58.1%) | 3.72 |
| Single Male/Father | 3 (9.7%) | 2.33 |
| Single Female/Mother | 10 (32.3%) | 3.70 |
| Total Families | 31 (100.0%) | 3.58 |
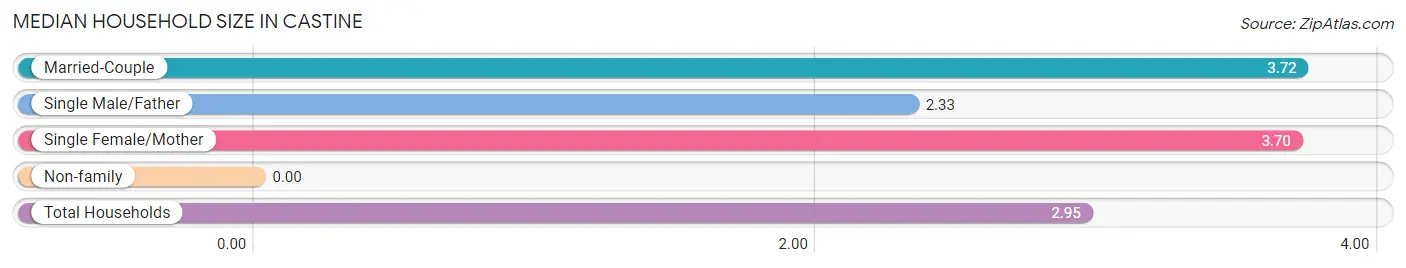
Median Household Size in Castine
| Household Type | # Households | Household Size |
| Married-Couple | 18 (43.9%) | 3.72 |
| Single Male/Father | 3 (7.3%) | 2.33 |
| Single Female/Mother | 10 (24.4%) | 3.70 |
| Non-family | 10 (24.4%) | - |
| Total Households | 41 (100.0%) | 2.95 |
Household Size by Marriage Status in Castine
Out of a total of 41 households in Castine, 31 (75.6%) are family households, while 10 (24.4%) are nonfamily households. The most numerous type of family households are 2-person households, comprising 11, and the most common type of nonfamily households are 1-person households, comprising 10.
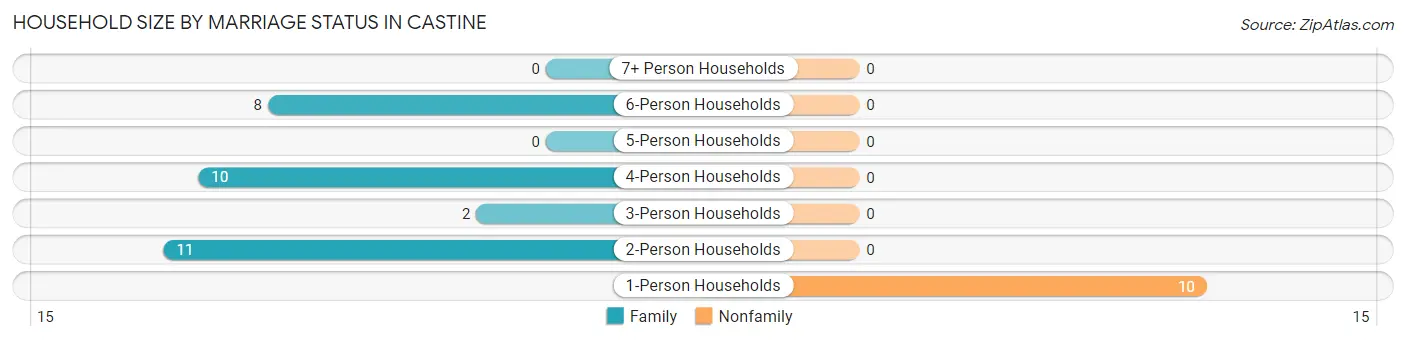
| Household Size | Family Households | Nonfamily Households |
| 1-Person Households | - | 10 (24.4%) |
| 2-Person Households | 11 (26.8%) | 0 (0.0%) |
| 3-Person Households | 2 (4.9%) | 0 (0.0%) |
| 4-Person Households | 10 (24.4%) | 0 (0.0%) |
| 5-Person Households | 0 (0.0%) | 0 (0.0%) |
| 6-Person Households | 8 (19.5%) | 0 (0.0%) |
| 7+ Person Households | 0 (0.0%) | 0 (0.0%) |
| Total | 31 (75.6%) | 10 (24.4%) |
Female Fertility in Castine
Fertility by Age in Castine
| Age Bracket | Women with Births | Births / 1,000 Women |
| 15 to 19 years | 0 (0.0%) | 0.0 |
| 20 to 34 years | 0 (0.0%) | 0.0 |
| 35 to 50 years | 0 (0.0%) | 0.0 |
| Total | 0 (0.0%) | 0.0 |
Fertility by Age by Marriage Status in Castine
| Age Bracket | Married | Unmarried |
| 15 to 19 years | 0 (0.0%) | 0 (0.0%) |
| 20 to 34 years | 0 (0.0%) | 0 (0.0%) |
| 35 to 50 years | 0 (0.0%) | 0 (0.0%) |
| Total | 0 (0.0%) | 0 (0.0%) |
Fertility by Education in Castine
| Educational Attainment | Women with Births | Births / 1,000 Women |
| Less than High School | 0 (0.0%) | 0.0 |
| High School Diploma | 0 (0.0%) | 0.0 |
| College or Associate's Degree | 0 (0.0%) | 0.0 |
| Bachelor's Degree | 0 (0.0%) | 0.0 |
| Graduate Degree | 0 (0.0%) | 0.0 |
| Total | 0 (0.0%) | 0.0 |
Fertility by Education by Marriage Status in Castine
| Educational Attainment | Married | Unmarried |
| Less than High School | 0 (0.0%) | 0 (0.0%) |
| High School Diploma | 0 (0.0%) | 0 (0.0%) |
| College or Associate's Degree | 0 (0.0%) | 0 (0.0%) |
| Bachelor's Degree | 0 (0.0%) | 0 (0.0%) |
| Graduate Degree | 0 (0.0%) | 0 (0.0%) |
| Total | 0 (0.0%) | 0 (0.0%) |
Employment Characteristics in Castine
Employment by Class of Employer in Castine
Among the 45 employed individuals in Castine, private company employees (35 | 77.8%), self-employed (not incorporated) (9 | 20.0%), and local government employees (1 | 2.2%) make up the most common classes of employment.
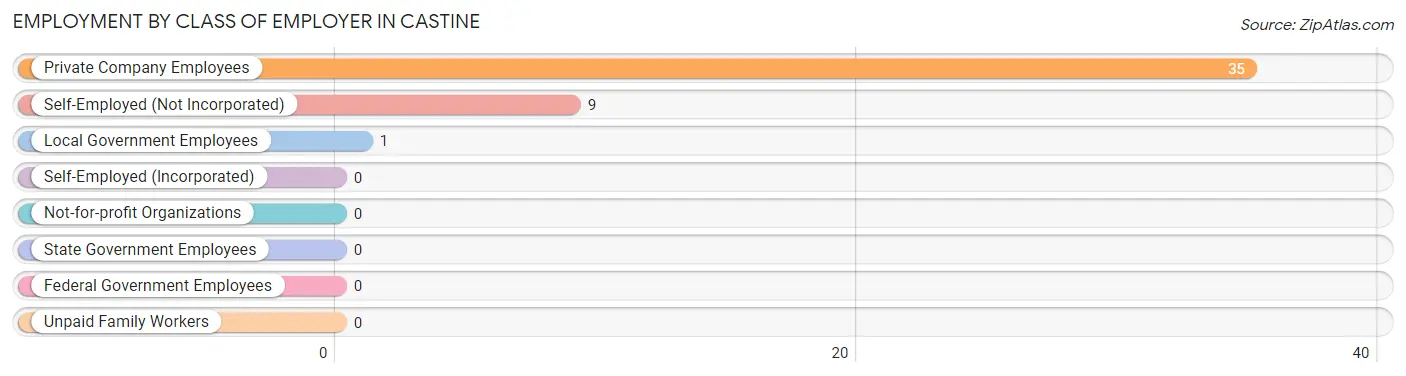
| Employer Class | # Employees | % Employees |
| Private Company Employees | 35 | 77.8% |
| Self-Employed (Incorporated) | 0 | 0.0% |
| Self-Employed (Not Incorporated) | 9 | 20.0% |
| Not-for-profit Organizations | 0 | 0.0% |
| Local Government Employees | 1 | 2.2% |
| State Government Employees | 0 | 0.0% |
| Federal Government Employees | 0 | 0.0% |
| Unpaid Family Workers | 0 | 0.0% |
| Total | 45 | 100.0% |
Employment Status by Age in Castine
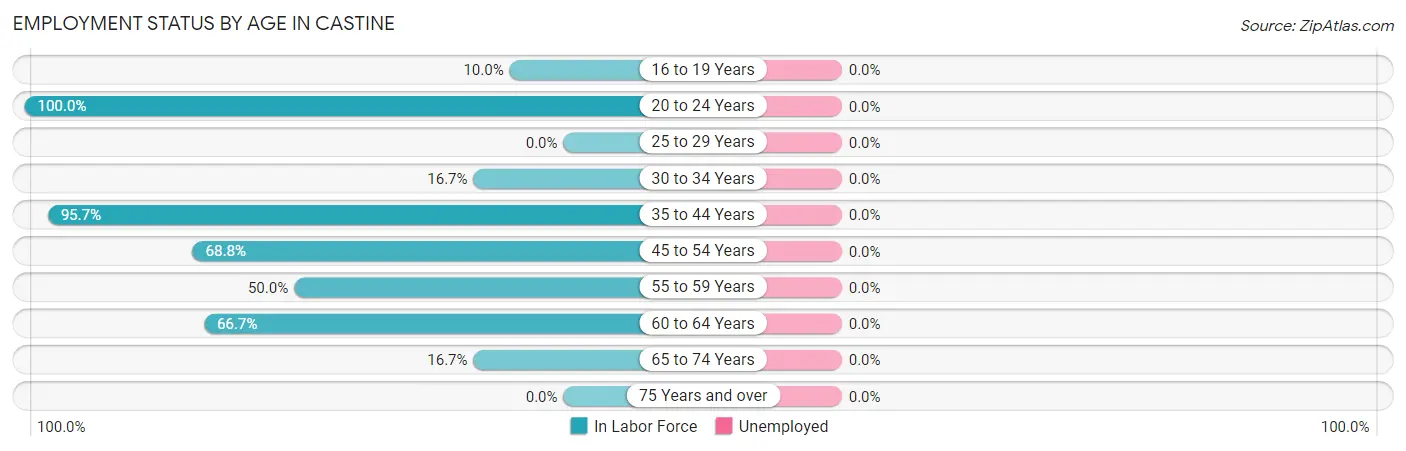
| Age Bracket | In Labor Force | Unemployed |
| 16 to 19 Years | 1 (10.0%) | 0 (0.0%) |
| 20 to 24 Years | 4 (100.0%) | 0 (0.0%) |
| 25 to 29 Years | 0 (0.0%) | 0 (0.0%) |
| 30 to 34 Years | 1 (16.7%) | 0 (0.0%) |
| 35 to 44 Years | 22 (95.7%) | 0 (0.0%) |
| 45 to 54 Years | 11 (68.8%) | 0 (0.0%) |
| 55 to 59 Years | 2 (50.0%) | 0 (0.0%) |
| 60 to 64 Years | 2 (66.7%) | 0 (0.0%) |
| 65 to 74 Years | 2 (16.7%) | 0 (0.0%) |
| 75 Years and over | 0 (0.0%) | 0 (0.0%) |
| Total | 45 (57.7%) | 0 (0.0%) |
Employment Status by Educational Attainment in Castine
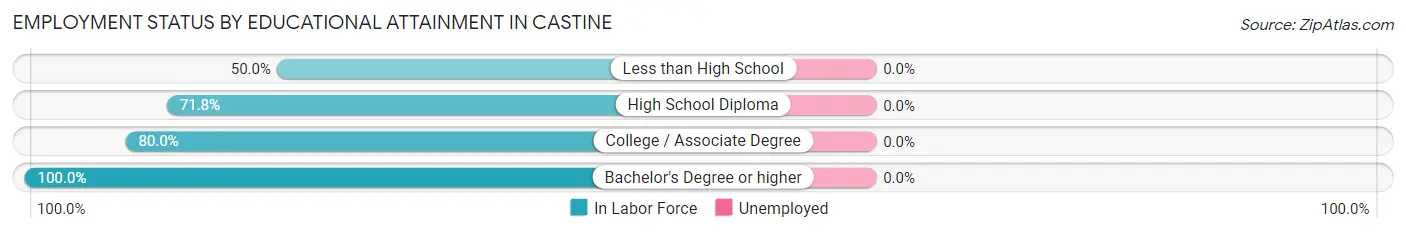
| Educational Attainment | In Labor Force | Unemployed |
| Less than High School | 2 (50.0%) | 0 (0.0%) |
| High School Diploma | 28 (71.8%) | 0 (0.0%) |
| College / Associate Degree | 4 (80.0%) | 0 (0.0%) |
| Bachelor's Degree or higher | 4 (100.0%) | 0 (0.0%) |
| Total | 38 (73.1%) | 0 (0.0%) |
Employment Occupations by Sex in Castine
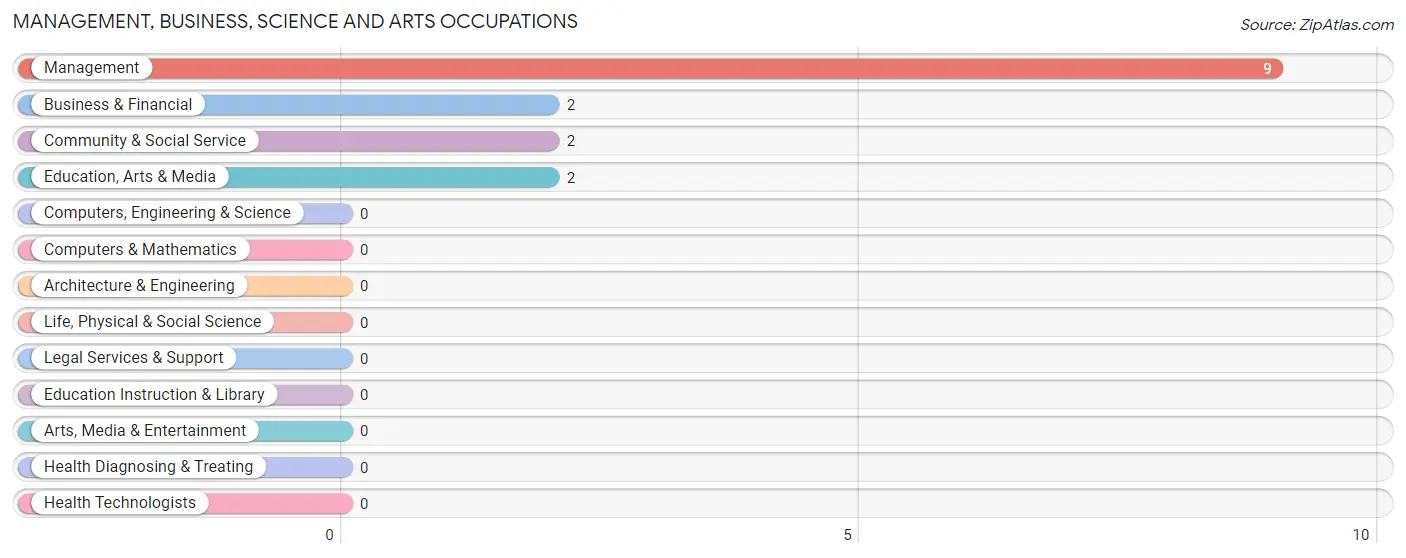
Management, Business, Science and Arts Occupations
The most common Management, Business, Science and Arts occupations in Castine are Management (9 | 20.0%), Business & Financial (2 | 4.4%), Community & Social Service (2 | 4.4%), and Education, Arts & Media (2 | 4.4%).
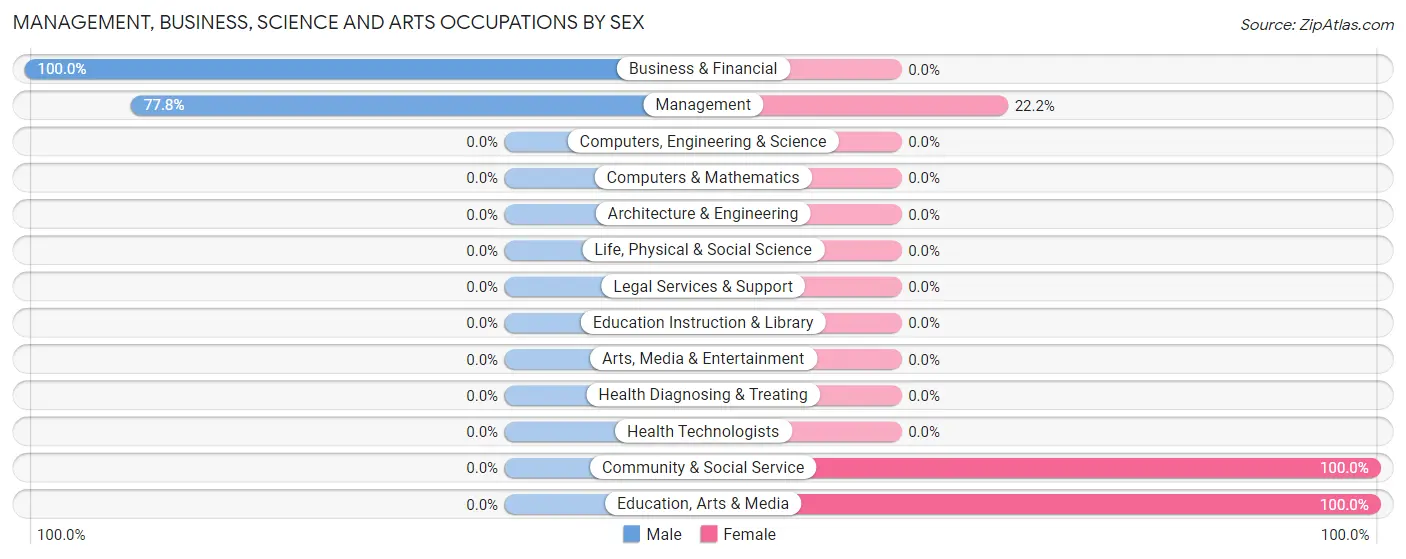
Management, Business, Science and Arts Occupations by Sex
Within the Management, Business, Science and Arts occupations in Castine, the most male-oriented occupations are Business & Financial (100.0%), and Management (77.8%), while the most female-oriented occupations are Community & Social Service (100.0%), Education, Arts & Media (100.0%), and Management (22.2%).
| Occupation | Male | Female |
| Management | 7 (77.8%) | 2 (22.2%) |
| Business & Financial | 2 (100.0%) | 0 (0.0%) |
| Computers, Engineering & Science | 0 (0.0%) | 0 (0.0%) |
| Computers & Mathematics | 0 (0.0%) | 0 (0.0%) |
| Architecture & Engineering | 0 (0.0%) | 0 (0.0%) |
| Life, Physical & Social Science | 0 (0.0%) | 0 (0.0%) |
| Community & Social Service | 0 (0.0%) | 2 (100.0%) |
| Education, Arts & Media | 0 (0.0%) | 2 (100.0%) |
| Legal Services & Support | 0 (0.0%) | 0 (0.0%) |
| Education Instruction & Library | 0 (0.0%) | 0 (0.0%) |
| Arts, Media & Entertainment | 0 (0.0%) | 0 (0.0%) |
| Health Diagnosing & Treating | 0 (0.0%) | 0 (0.0%) |
| Health Technologists | 0 (0.0%) | 0 (0.0%) |
| Total (Category) | 9 (69.2%) | 4 (30.8%) |
| Total (Overall) | 28 (62.2%) | 17 (37.8%) |
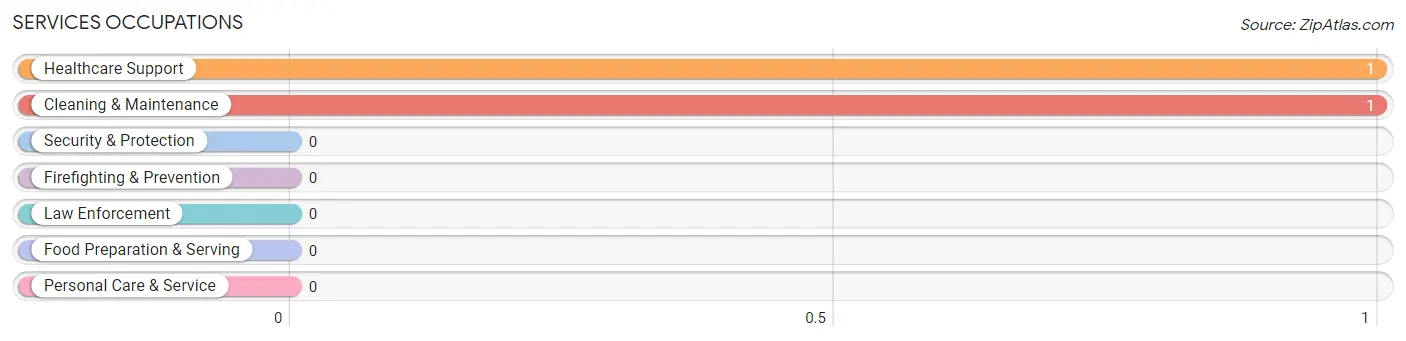
Services Occupations
The most common Services occupations in Castine are Healthcare Support (1 | 2.2%), and Cleaning & Maintenance (1 | 2.2%).
Services Occupations by Sex
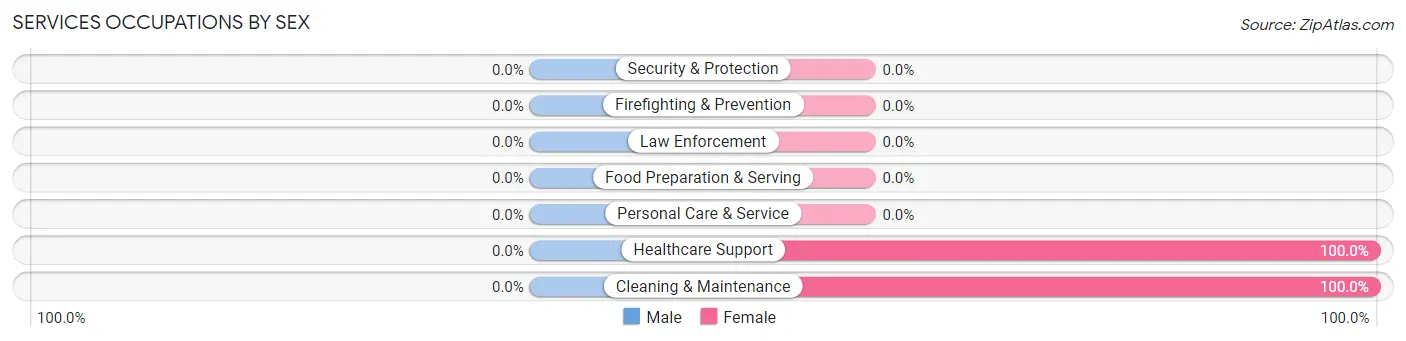
| Occupation | Male | Female |
| Healthcare Support | 0 (0.0%) | 1 (100.0%) |
| Security & Protection | 0 (0.0%) | 0 (0.0%) |
| Firefighting & Prevention | 0 (0.0%) | 0 (0.0%) |
| Law Enforcement | 0 (0.0%) | 0 (0.0%) |
| Food Preparation & Serving | 0 (0.0%) | 0 (0.0%) |
| Cleaning & Maintenance | 0 (0.0%) | 1 (100.0%) |
| Personal Care & Service | 0 (0.0%) | 0 (0.0%) |
| Total (Category) | 0 (0.0%) | 2 (100.0%) |
| Total (Overall) | 28 (62.2%) | 17 (37.8%) |
Sales and Office Occupations
The most common Sales and Office occupations in Castine are Office & Administration (4 | 8.9%), and Sales & Related (2 | 4.4%).
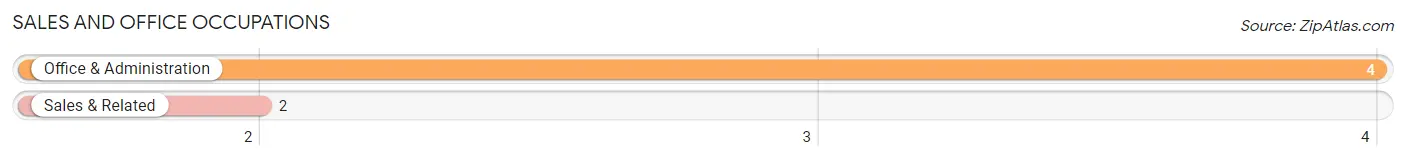
Sales and Office Occupations by Sex

| Occupation | Male | Female |
| Sales & Related | 2 (100.0%) | 0 (0.0%) |
| Office & Administration | 2 (50.0%) | 2 (50.0%) |
| Total (Category) | 4 (66.7%) | 2 (33.3%) |
| Total (Overall) | 28 (62.2%) | 17 (37.8%) |
Natural Resources, Construction and Maintenance Occupations
The most common Natural Resources, Construction and Maintenance occupations in Castine are , and Construction & Extraction (4 | 8.9%).
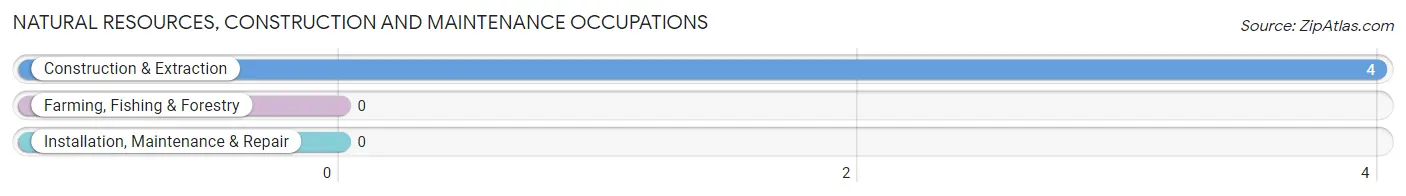
Natural Resources, Construction and Maintenance Occupations by Sex
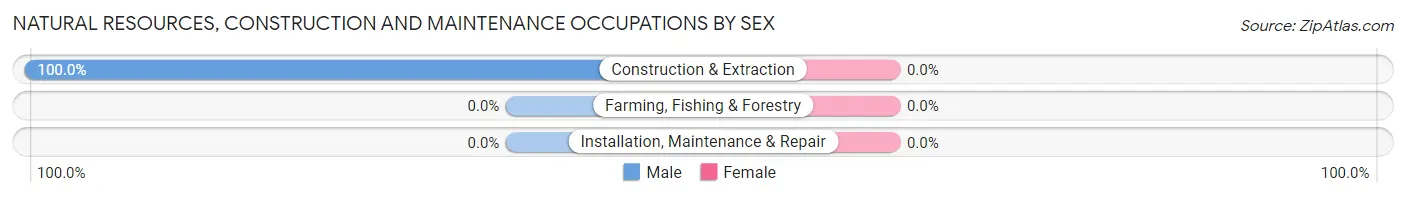
| Occupation | Male | Female |
| Farming, Fishing & Forestry | 0 (0.0%) | 0 (0.0%) |
| Construction & Extraction | 4 (100.0%) | 0 (0.0%) |
| Installation, Maintenance & Repair | 0 (0.0%) | 0 (0.0%) |
| Total (Category) | 4 (100.0%) | 0 (0.0%) |
| Total (Overall) | 28 (62.2%) | 17 (37.8%) |
Production, Transportation and Moving Occupations
The most common Production, Transportation and Moving occupations in Castine are Production (10 | 22.2%), Material Moving (6 | 13.3%), and Transportation (4 | 8.9%).
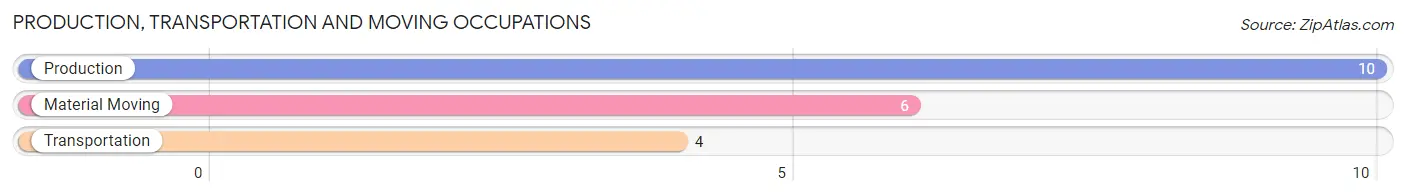
Production, Transportation and Moving Occupations by Sex
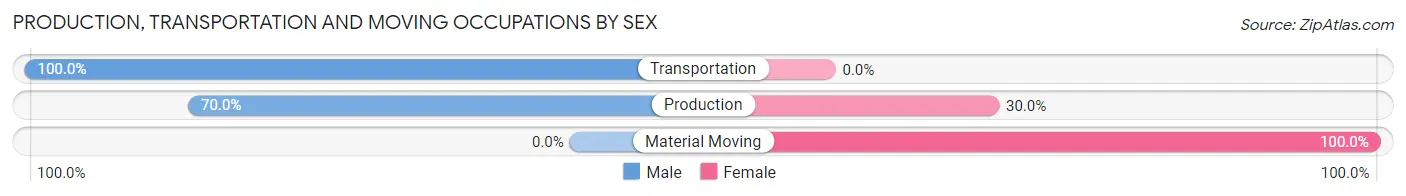
| Occupation | Male | Female |
| Production | 7 (70.0%) | 3 (30.0%) |
| Transportation | 4 (100.0%) | 0 (0.0%) |
| Material Moving | 0 (0.0%) | 6 (100.0%) |
| Total (Category) | 11 (55.0%) | 9 (45.0%) |
| Total (Overall) | 28 (62.2%) | 17 (37.8%) |
Employment Industries by Sex in Castine
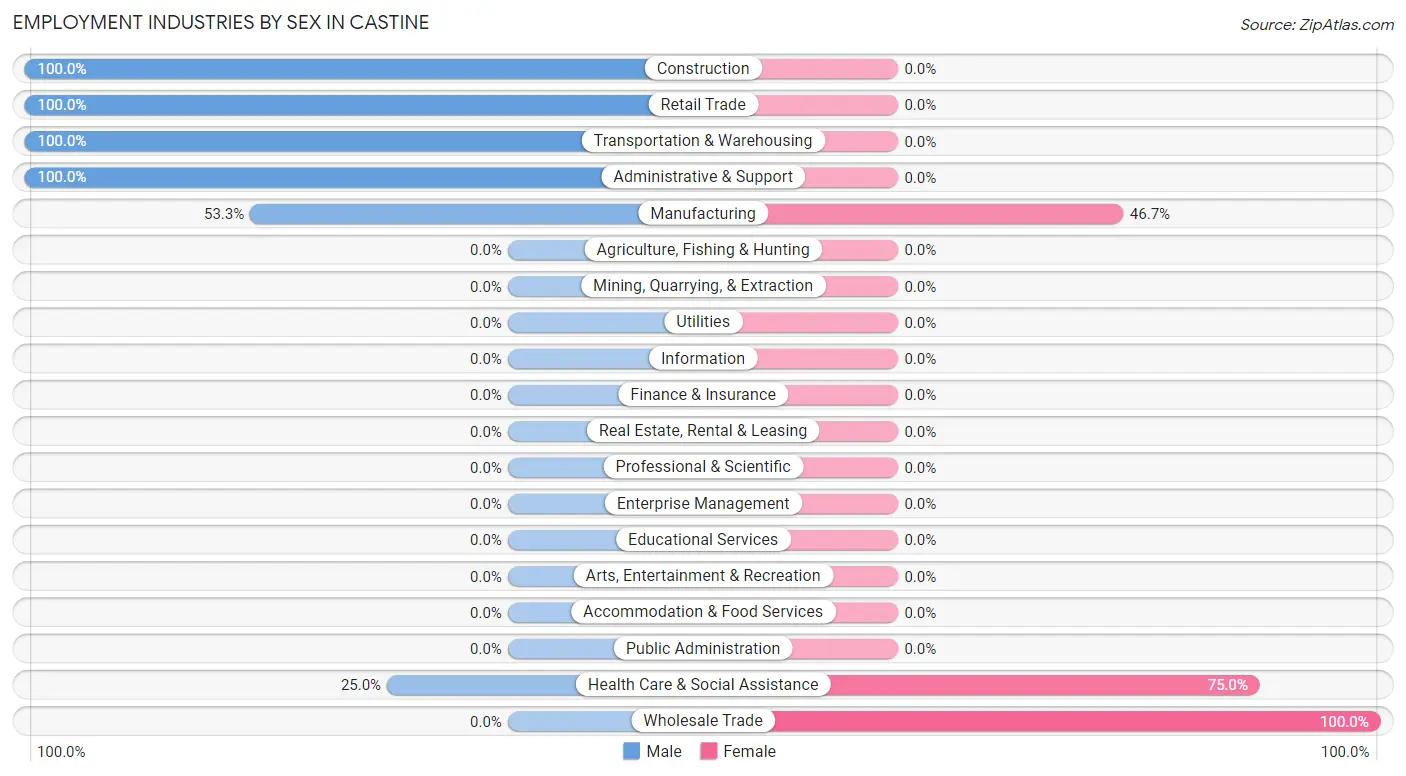
Employment Industries in Castine
The major employment industries in Castine include Manufacturing (15 | 33.3%), Construction (10 | 22.2%), Wholesale Trade (6 | 13.3%), Retail Trade (5 | 11.1%), and Health Care & Social Assistance (4 | 8.9%).
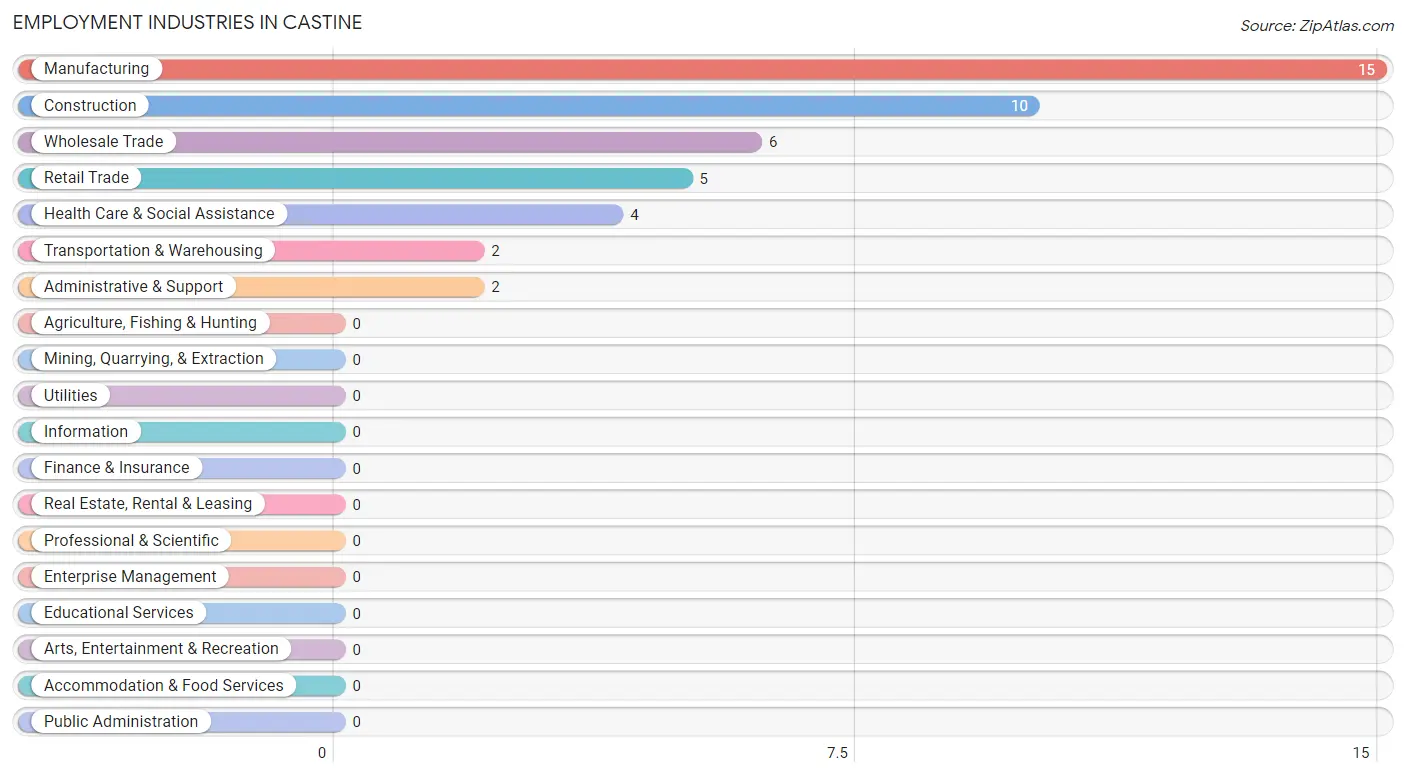
Employment Industries by Sex in Castine
The Castine industries that see more men than women are Construction (100.0%), Retail Trade (100.0%), and Transportation & Warehousing (100.0%), whereas the industries that tend to have a higher number of women are Wholesale Trade (100.0%), Health Care & Social Assistance (75.0%), and Manufacturing (46.7%).
| Industry | Male | Female |
| Agriculture, Fishing & Hunting | 0 (0.0%) | 0 (0.0%) |
| Mining, Quarrying, & Extraction | 0 (0.0%) | 0 (0.0%) |
| Construction | 10 (100.0%) | 0 (0.0%) |
| Manufacturing | 8 (53.3%) | 7 (46.7%) |
| Wholesale Trade | 0 (0.0%) | 6 (100.0%) |
| Retail Trade | 5 (100.0%) | 0 (0.0%) |
| Transportation & Warehousing | 2 (100.0%) | 0 (0.0%) |
| Utilities | 0 (0.0%) | 0 (0.0%) |
| Information | 0 (0.0%) | 0 (0.0%) |
| Finance & Insurance | 0 (0.0%) | 0 (0.0%) |
| Real Estate, Rental & Leasing | 0 (0.0%) | 0 (0.0%) |
| Professional & Scientific | 0 (0.0%) | 0 (0.0%) |
| Enterprise Management | 0 (0.0%) | 0 (0.0%) |
| Administrative & Support | 2 (100.0%) | 0 (0.0%) |
| Educational Services | 0 (0.0%) | 0 (0.0%) |
| Health Care & Social Assistance | 1 (25.0%) | 3 (75.0%) |
| Arts, Entertainment & Recreation | 0 (0.0%) | 0 (0.0%) |
| Accommodation & Food Services | 0 (0.0%) | 0 (0.0%) |
| Public Administration | 0 (0.0%) | 0 (0.0%) |
| Total | 28 (62.2%) | 17 (37.8%) |
Education in Castine
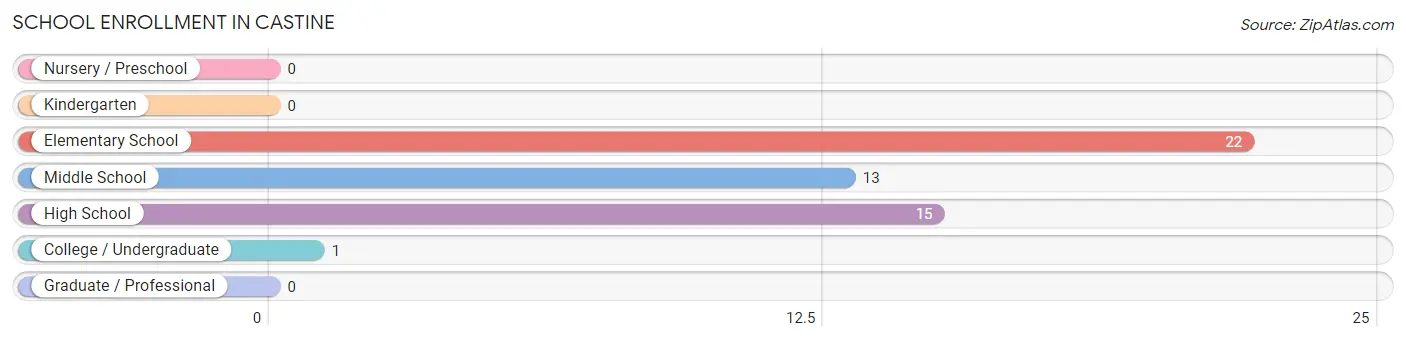
School Enrollment in Castine
The most common levels of schooling among the 51 students in Castine are elementary school (22 | 43.1%), high school (15 | 29.4%), and middle school (13 | 25.5%).
| School Level | # Students | % Students |
| Nursery / Preschool | 0 | 0.0% |
| Kindergarten | 0 | 0.0% |
| Elementary School | 22 | 43.1% |
| Middle School | 13 | 25.5% |
| High School | 15 | 29.4% |
| College / Undergraduate | 1 | 2.0% |
| Graduate / Professional | 0 | 0.0% |
| Total | 51 | 100.0% |
School Enrollment by Age by Funding Source in Castine
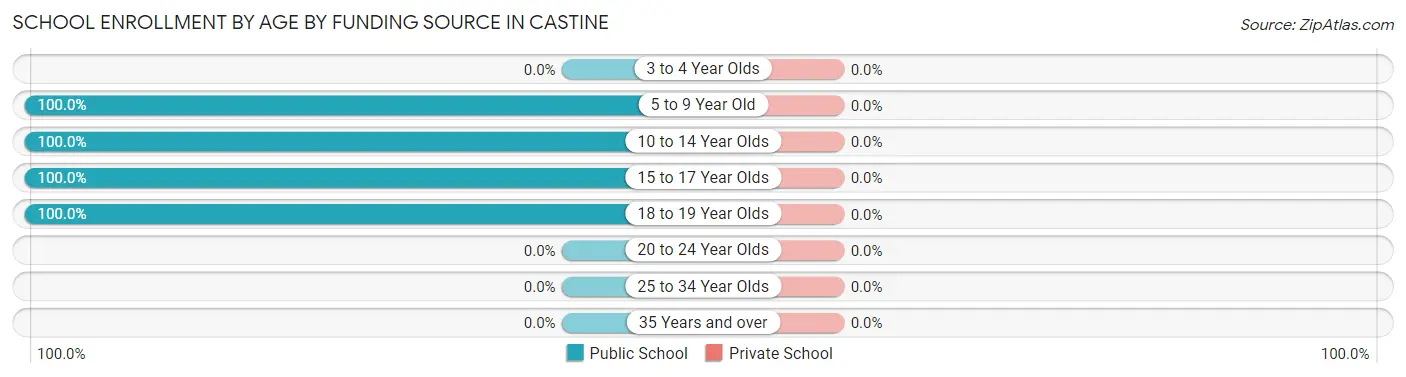
| Age Bracket | Public School | Private School |
| 3 to 4 Year Olds | 0 (0.0%) | 0 (0.0%) |
| 5 to 9 Year Old | 17 (100.0%) | 0 (0.0%) |
| 10 to 14 Year Olds | 18 (100.0%) | 0 (0.0%) |
| 15 to 17 Year Olds | 11 (100.0%) | 0 (0.0%) |
| 18 to 19 Year Olds | 5 (100.0%) | 0 (0.0%) |
| 20 to 24 Year Olds | 0 (0.0%) | 0 (0.0%) |
| 25 to 34 Year Olds | 0 (0.0%) | 0 (0.0%) |
| 35 Years and over | 0 (0.0%) | 0 (0.0%) |
| Total | 51 (100.0%) | 0 (0.0%) |
Educational Attainment by Field of Study in Castine
Psychology (2 | 50.0%), and business (2 | 50.0%) are the most common fields of study among 4 individuals in Castine who have obtained a bachelor's degree or higher.
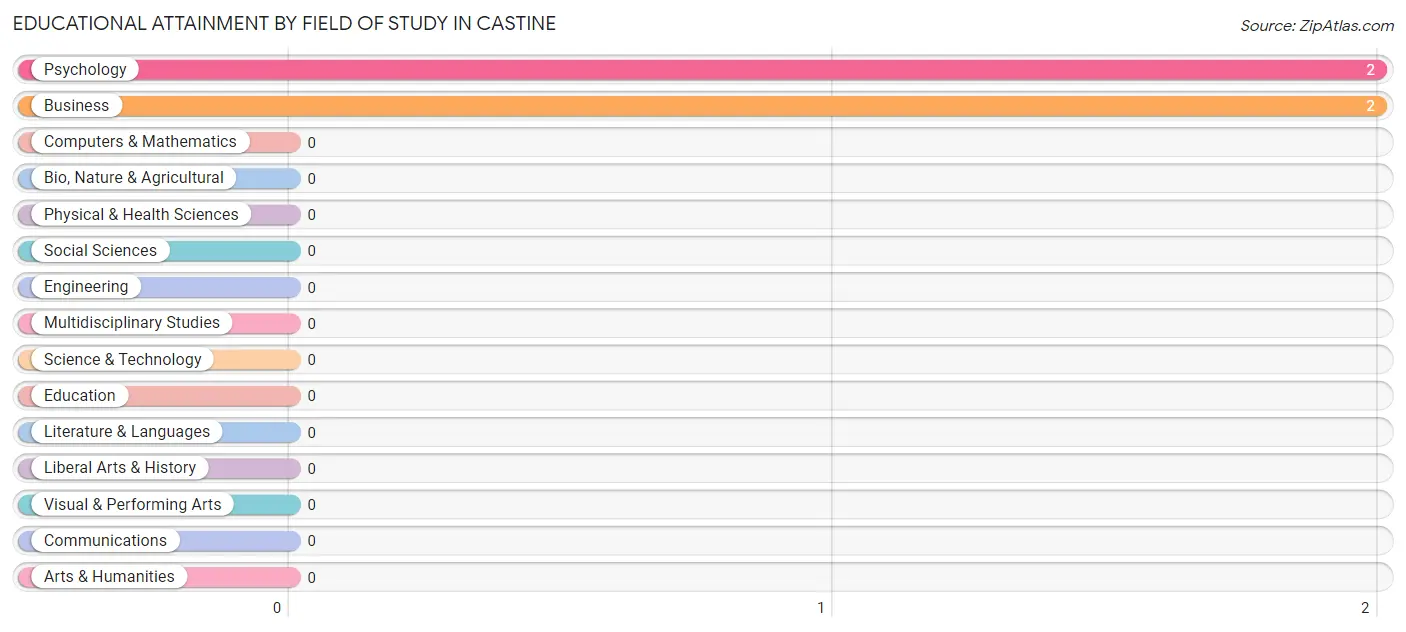
| Field of Study | # Graduates | % Graduates |
| Computers & Mathematics | 0 | 0.0% |
| Bio, Nature & Agricultural | 0 | 0.0% |
| Physical & Health Sciences | 0 | 0.0% |
| Psychology | 2 | 50.0% |
| Social Sciences | 0 | 0.0% |
| Engineering | 0 | 0.0% |
| Multidisciplinary Studies | 0 | 0.0% |
| Science & Technology | 0 | 0.0% |
| Business | 2 | 50.0% |
| Education | 0 | 0.0% |
| Literature & Languages | 0 | 0.0% |
| Liberal Arts & History | 0 | 0.0% |
| Visual & Performing Arts | 0 | 0.0% |
| Communications | 0 | 0.0% |
| Arts & Humanities | 0 | 0.0% |
| Total | 4 | 100.0% |
Transportation & Commute in Castine
Vehicle Availability by Sex in Castine
The most prevalent vehicle ownership categories in Castine are males with 3 vehicles (14, accounting for 50.0%) and females with 3 vehicles (2, making up 82.4%).
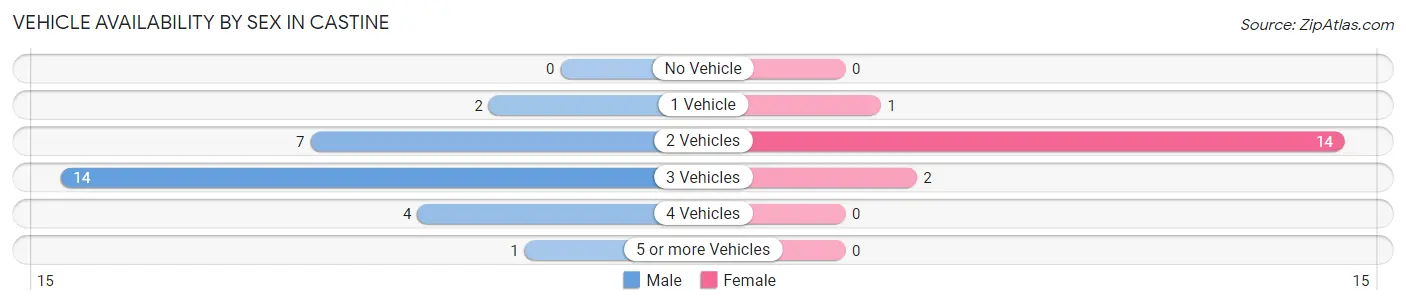
| Vehicles Available | Male | Female |
| No Vehicle | 0 (0.0%) | 0 (0.0%) |
| 1 Vehicle | 2 (7.1%) | 1 (5.9%) |
| 2 Vehicles | 7 (25.0%) | 14 (82.4%) |
| 3 Vehicles | 14 (50.0%) | 2 (11.8%) |
| 4 Vehicles | 4 (14.3%) | 0 (0.0%) |
| 5 or more Vehicles | 1 (3.6%) | 0 (0.0%) |
| Total | 28 (100.0%) | 17 (100.0%) |
Commute Time in Castine
The most frequently occuring commute durations in Castine are 30 to 34 minutes (11 commuters, 29.7%), 15 to 19 minutes (8 commuters, 21.6%), and 20 to 24 minutes (6 commuters, 16.2%).
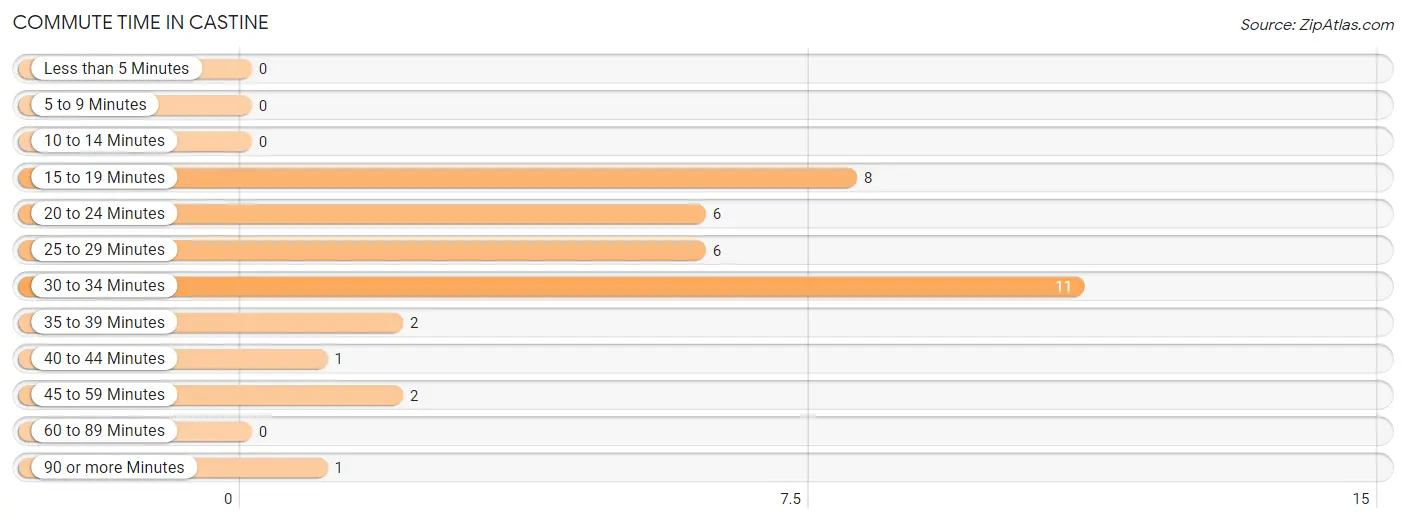
| Commute Time | # Commuters | % Commuters |
| Less than 5 Minutes | 0 | 0.0% |
| 5 to 9 Minutes | 0 | 0.0% |
| 10 to 14 Minutes | 0 | 0.0% |
| 15 to 19 Minutes | 8 | 21.6% |
| 20 to 24 Minutes | 6 | 16.2% |
| 25 to 29 Minutes | 6 | 16.2% |
| 30 to 34 Minutes | 11 | 29.7% |
| 35 to 39 Minutes | 2 | 5.4% |
| 40 to 44 Minutes | 1 | 2.7% |
| 45 to 59 Minutes | 2 | 5.4% |
| 60 to 89 Minutes | 0 | 0.0% |
| 90 or more Minutes | 1 | 2.7% |
Commute Time by Sex in Castine
The most common commute times in Castine are 20 to 24 minutes (6 commuters, 30.0%) for males and 30 to 34 minutes (9 commuters, 52.9%) for females.
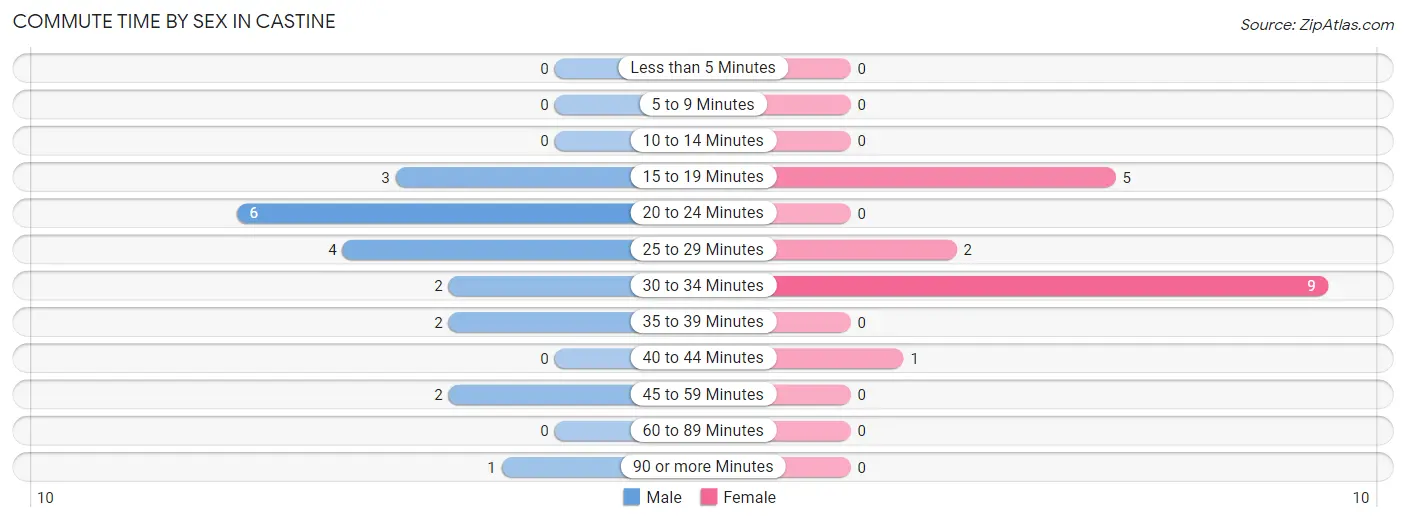
| Commute Time | Male | Female |
| Less than 5 Minutes | 0 (0.0%) | 0 (0.0%) |
| 5 to 9 Minutes | 0 (0.0%) | 0 (0.0%) |
| 10 to 14 Minutes | 0 (0.0%) | 0 (0.0%) |
| 15 to 19 Minutes | 3 (15.0%) | 5 (29.4%) |
| 20 to 24 Minutes | 6 (30.0%) | 0 (0.0%) |
| 25 to 29 Minutes | 4 (20.0%) | 2 (11.8%) |
| 30 to 34 Minutes | 2 (10.0%) | 9 (52.9%) |
| 35 to 39 Minutes | 2 (10.0%) | 0 (0.0%) |
| 40 to 44 Minutes | 0 (0.0%) | 1 (5.9%) |
| 45 to 59 Minutes | 2 (10.0%) | 0 (0.0%) |
| 60 to 89 Minutes | 0 (0.0%) | 0 (0.0%) |
| 90 or more Minutes | 1 (5.0%) | 0 (0.0%) |
Time of Departure to Work by Sex in Castine
The most frequent times of departure to work in Castine are 6:00 AM to 6:29 AM (8, 40.0%) for males and 9:00 AM to 9:59 AM (6, 35.3%) for females.
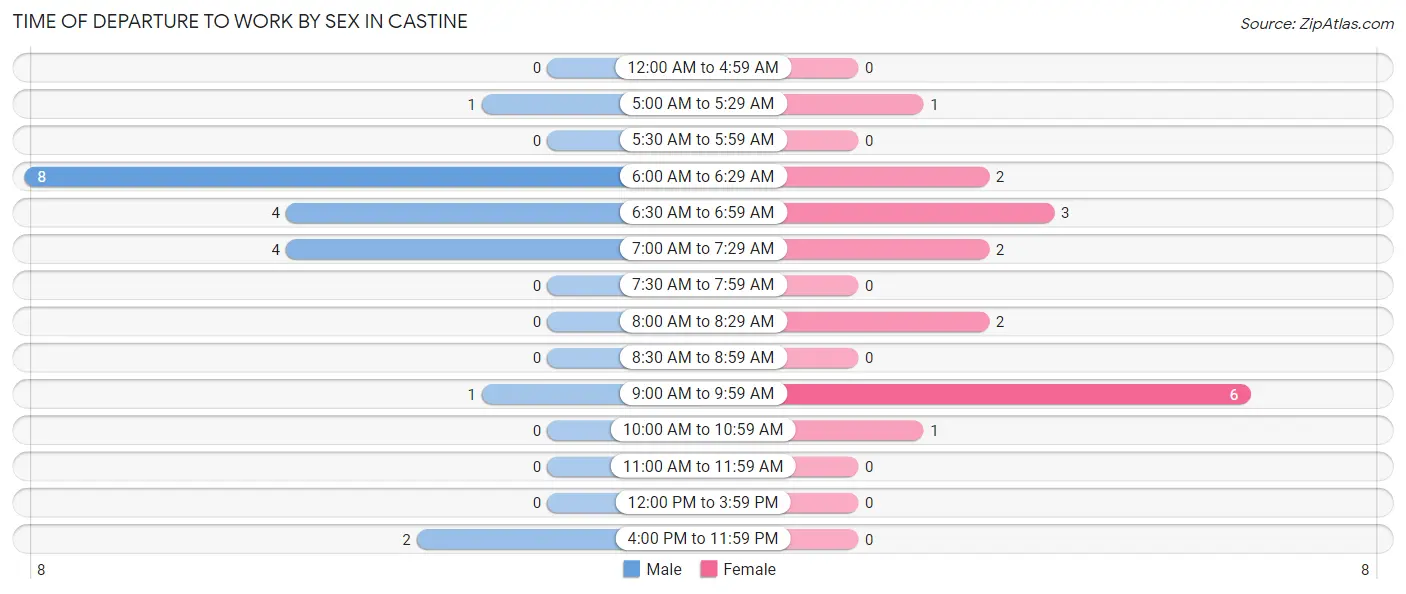
| Time of Departure | Male | Female |
| 12:00 AM to 4:59 AM | 0 (0.0%) | 0 (0.0%) |
| 5:00 AM to 5:29 AM | 1 (5.0%) | 1 (5.9%) |
| 5:30 AM to 5:59 AM | 0 (0.0%) | 0 (0.0%) |
| 6:00 AM to 6:29 AM | 8 (40.0%) | 2 (11.8%) |
| 6:30 AM to 6:59 AM | 4 (20.0%) | 3 (17.6%) |
| 7:00 AM to 7:29 AM | 4 (20.0%) | 2 (11.8%) |
| 7:30 AM to 7:59 AM | 0 (0.0%) | 0 (0.0%) |
| 8:00 AM to 8:29 AM | 0 (0.0%) | 2 (11.8%) |
| 8:30 AM to 8:59 AM | 0 (0.0%) | 0 (0.0%) |
| 9:00 AM to 9:59 AM | 1 (5.0%) | 6 (35.3%) |
| 10:00 AM to 10:59 AM | 0 (0.0%) | 1 (5.9%) |
| 11:00 AM to 11:59 AM | 0 (0.0%) | 0 (0.0%) |
| 12:00 PM to 3:59 PM | 0 (0.0%) | 0 (0.0%) |
| 4:00 PM to 11:59 PM | 2 (10.0%) | 0 (0.0%) |
| Total | 20 (100.0%) | 17 (100.0%) |
Housing Occupancy in Castine
Occupancy by Ownership in Castine
Of the total 41 dwellings in Castine, owner-occupied units account for 29 (70.7%), while renter-occupied units make up 12 (29.3%).
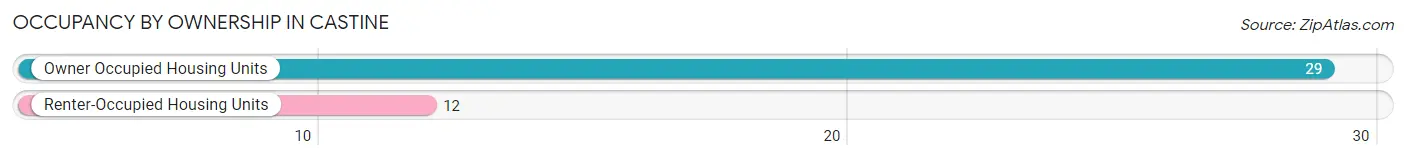
| Occupancy | # Housing Units | % Housing Units |
| Owner Occupied Housing Units | 29 | 70.7% |
| Renter-Occupied Housing Units | 12 | 29.3% |
| Total Occupied Housing Units | 41 | 100.0% |
Occupancy by Household Size in Castine
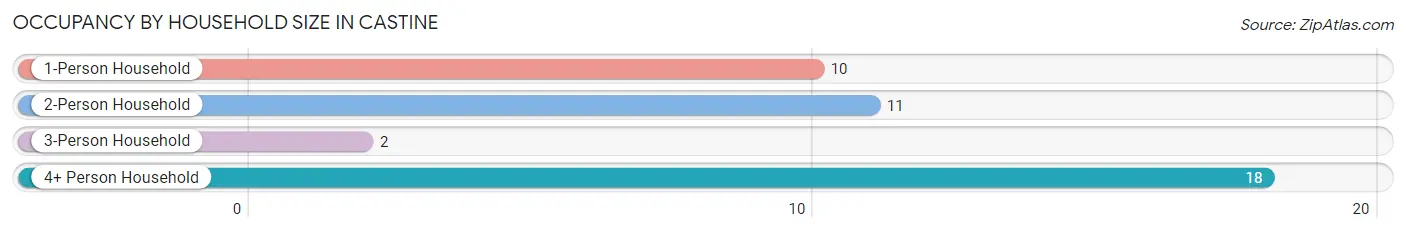
| Household Size | # Housing Units | % Housing Units |
| 1-Person Household | 10 | 24.4% |
| 2-Person Household | 11 | 26.8% |
| 3-Person Household | 2 | 4.9% |
| 4+ Person Household | 18 | 43.9% |
| Total Housing Units | 41 | 100.0% |
Occupancy by Ownership by Household Size in Castine
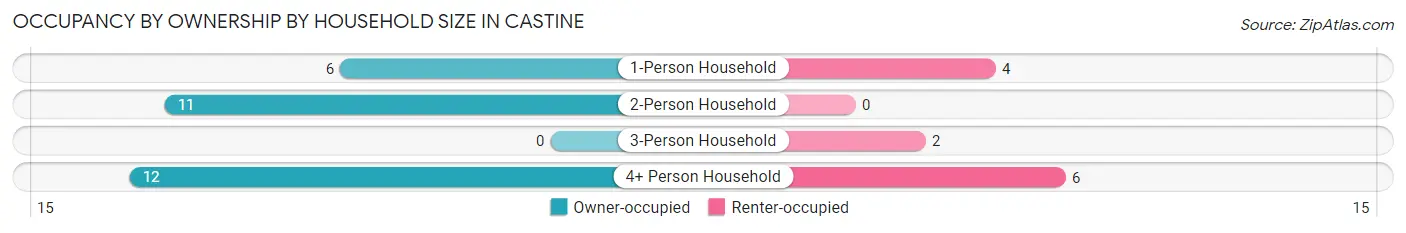
| Household Size | Owner-occupied | Renter-occupied |
| 1-Person Household | 6 (60.0%) | 4 (40.0%) |
| 2-Person Household | 11 (100.0%) | 0 (0.0%) |
| 3-Person Household | 0 (0.0%) | 2 (100.0%) |
| 4+ Person Household | 12 (66.7%) | 6 (33.3%) |
| Total Housing Units | 29 (70.7%) | 12 (29.3%) |
Occupancy by Educational Attainment in Castine
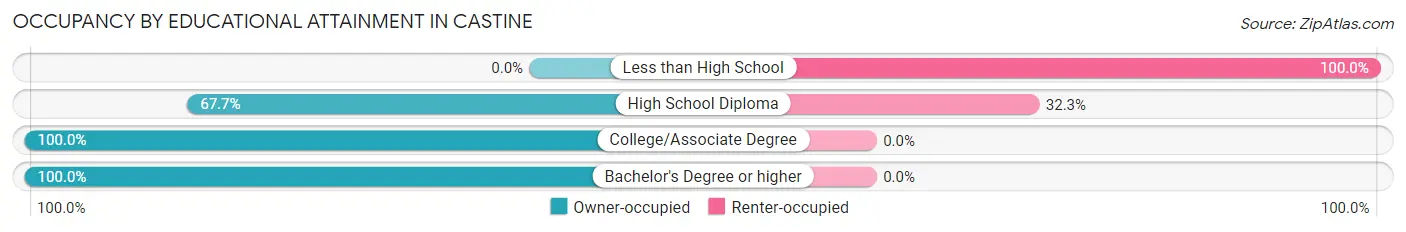
| Household Size | Owner-occupied | Renter-occupied |
| Less than High School | 0 (0.0%) | 2 (100.0%) |
| High School Diploma | 21 (67.7%) | 10 (32.3%) |
| College/Associate Degree | 6 (100.0%) | 0 (0.0%) |
| Bachelor's Degree or higher | 2 (100.0%) | 0 (0.0%) |
Occupancy by Age of Householder in Castine
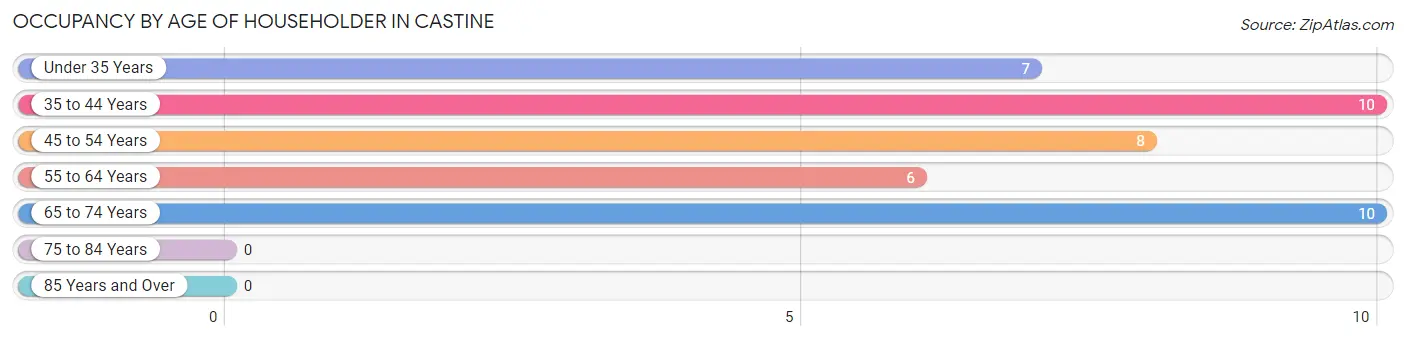
| Age Bracket | # Households | % Households |
| Under 35 Years | 7 | 17.1% |
| 35 to 44 Years | 10 | 24.4% |
| 45 to 54 Years | 8 | 19.5% |
| 55 to 64 Years | 6 | 14.6% |
| 65 to 74 Years | 10 | 24.4% |
| 75 to 84 Years | 0 | 0.0% |
| 85 Years and Over | 0 | 0.0% |
| Total | 41 | 100.0% |
Housing Finances in Castine
Median Income by Occupancy in Castine
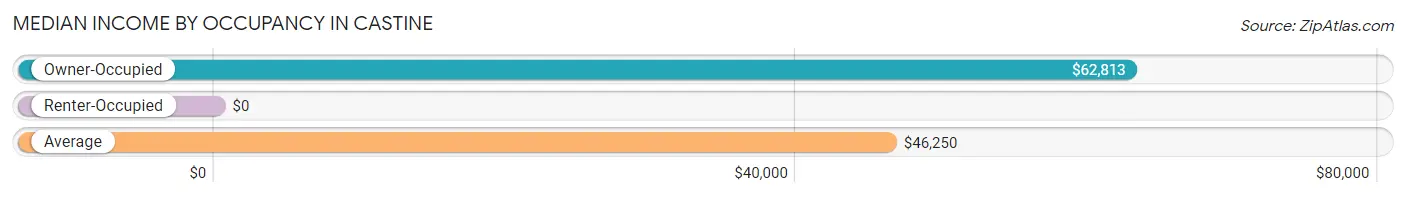
| Occupancy Type | # Households | Median Income |
| Owner-Occupied | 29 (70.7%) | $62,813 |
| Renter-Occupied | 12 (29.3%) | $0 |
| Average | 41 (100.0%) | $46,250 |
Occupancy by Householder Income Bracket in Castine
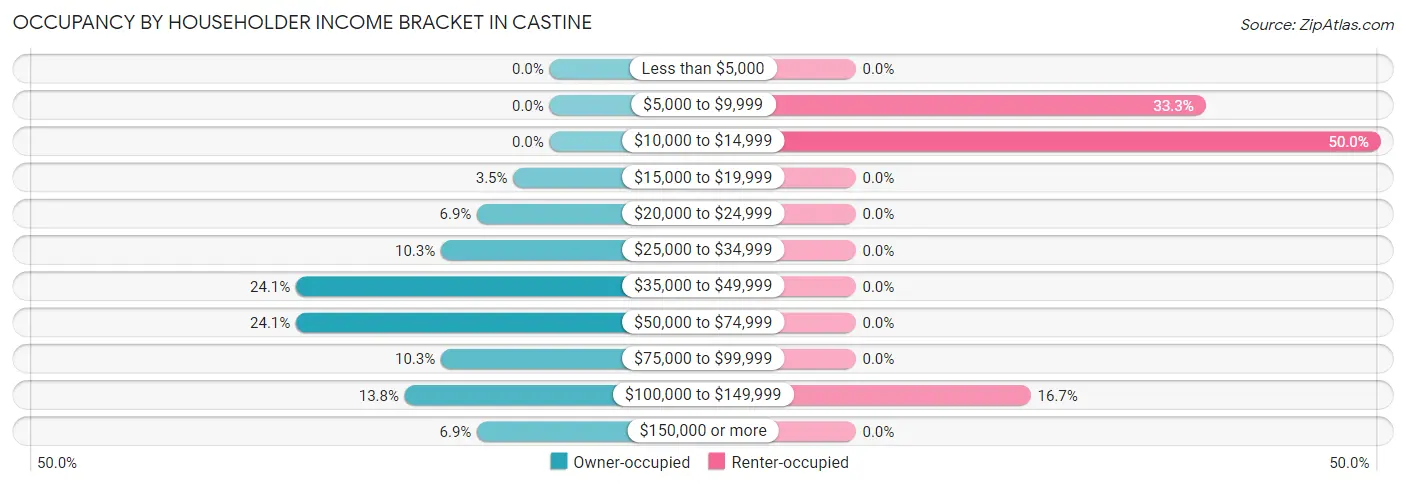
| Income Bracket | Owner-occupied | Renter-occupied |
| Less than $5,000 | 0 (0.0%) | 0 (0.0%) |
| $5,000 to $9,999 | 0 (0.0%) | 4 (33.3%) |
| $10,000 to $14,999 | 0 (0.0%) | 6 (50.0%) |
| $15,000 to $19,999 | 1 (3.5%) | 0 (0.0%) |
| $20,000 to $24,999 | 2 (6.9%) | 0 (0.0%) |
| $25,000 to $34,999 | 3 (10.3%) | 0 (0.0%) |
| $35,000 to $49,999 | 7 (24.1%) | 0 (0.0%) |
| $50,000 to $74,999 | 7 (24.1%) | 0 (0.0%) |
| $75,000 to $99,999 | 3 (10.3%) | 0 (0.0%) |
| $100,000 to $149,999 | 4 (13.8%) | 2 (16.7%) |
| $150,000 or more | 2 (6.9%) | 0 (0.0%) |
| Total | 29 (100.0%) | 12 (100.0%) |
Monthly Housing Cost Tiers in Castine
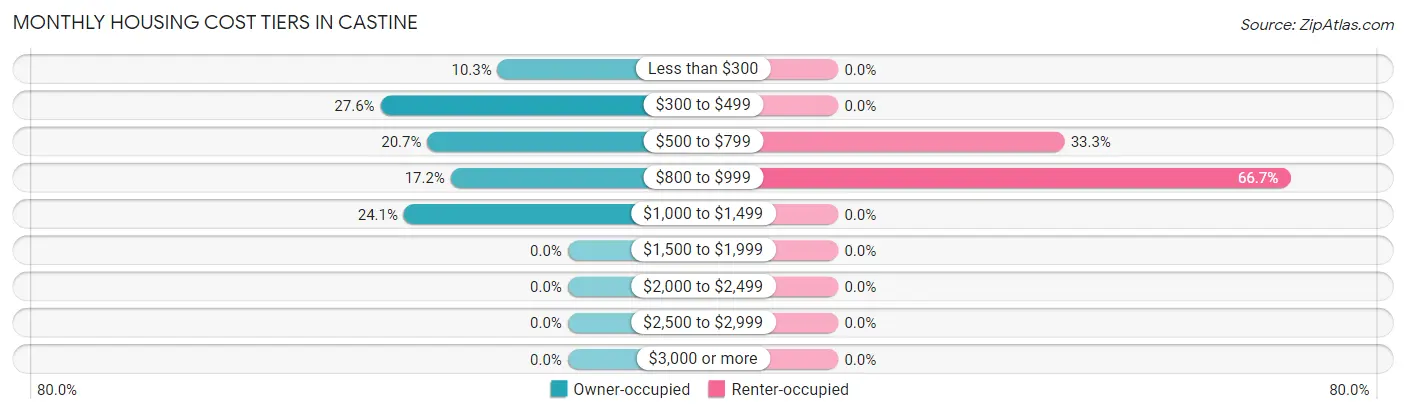
| Monthly Cost | Owner-occupied | Renter-occupied |
| Less than $300 | 3 (10.3%) | 0 (0.0%) |
| $300 to $499 | 8 (27.6%) | 0 (0.0%) |
| $500 to $799 | 6 (20.7%) | 4 (33.3%) |
| $800 to $999 | 5 (17.2%) | 8 (66.7%) |
| $1,000 to $1,499 | 7 (24.1%) | 0 (0.0%) |
| $1,500 to $1,999 | 0 (0.0%) | 0 (0.0%) |
| $2,000 to $2,499 | 0 (0.0%) | 0 (0.0%) |
| $2,500 to $2,999 | 0 (0.0%) | 0 (0.0%) |
| $3,000 or more | 0 (0.0%) | 0 (0.0%) |
| Total | 29 (100.0%) | 12 (100.0%) |
Physical Housing Characteristics in Castine
Housing Structures in Castine
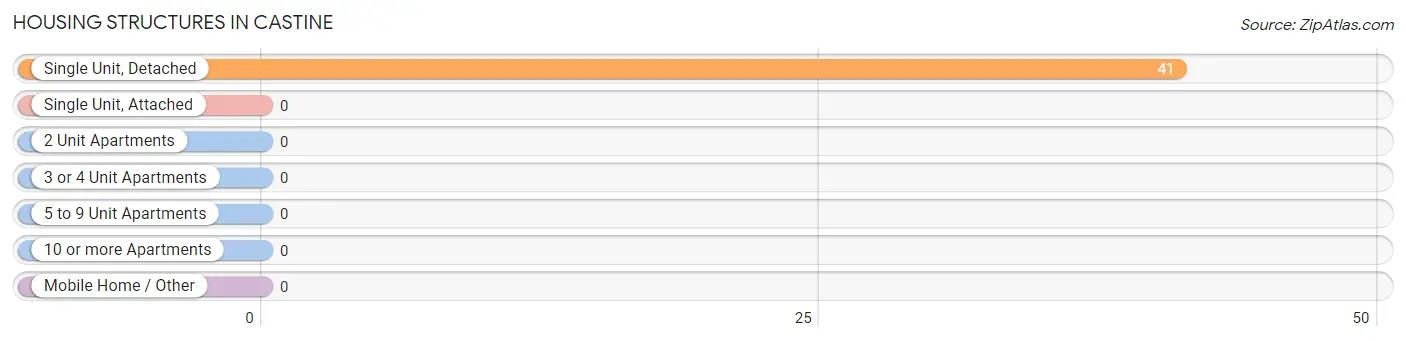
| Structure Type | # Housing Units | % Housing Units |
| Single Unit, Detached | 41 | 100.0% |
| Single Unit, Attached | 0 | 0.0% |
| 2 Unit Apartments | 0 | 0.0% |
| 3 or 4 Unit Apartments | 0 | 0.0% |
| 5 to 9 Unit Apartments | 0 | 0.0% |
| 10 or more Apartments | 0 | 0.0% |
| Mobile Home / Other | 0 | 0.0% |
| Total | 41 | 100.0% |
Housing Structures by Occupancy in Castine
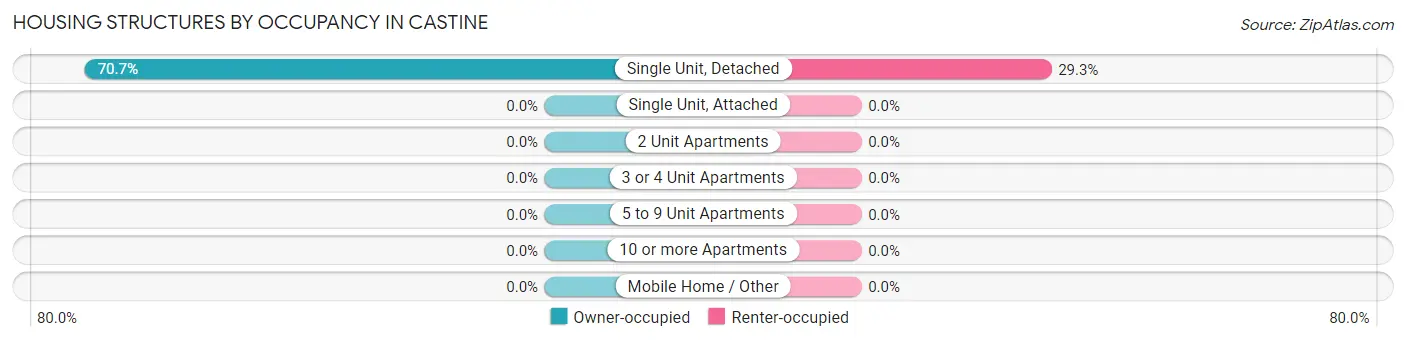
| Structure Type | Owner-occupied | Renter-occupied |
| Single Unit, Detached | 29 (70.7%) | 12 (29.3%) |
| Single Unit, Attached | 0 (0.0%) | 0 (0.0%) |
| 2 Unit Apartments | 0 (0.0%) | 0 (0.0%) |
| 3 or 4 Unit Apartments | 0 (0.0%) | 0 (0.0%) |
| 5 to 9 Unit Apartments | 0 (0.0%) | 0 (0.0%) |
| 10 or more Apartments | 0 (0.0%) | 0 (0.0%) |
| Mobile Home / Other | 0 (0.0%) | 0 (0.0%) |
| Total | 29 (70.7%) | 12 (29.3%) |
Housing Structures by Number of Rooms in Castine
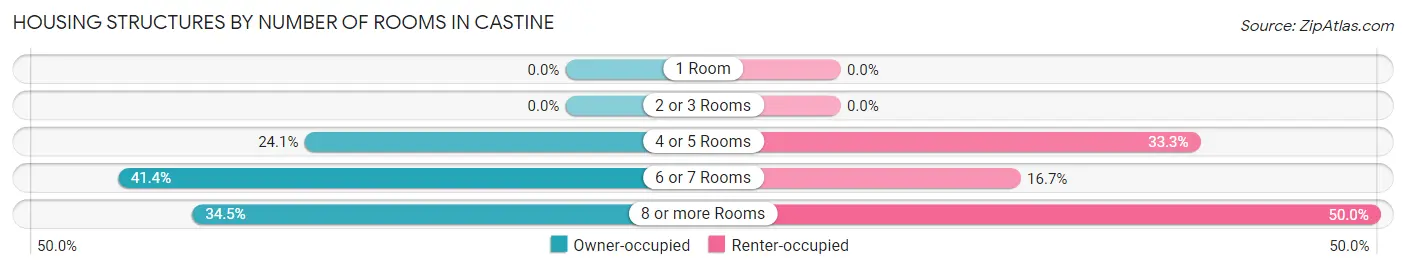
| Number of Rooms | Owner-occupied | Renter-occupied |
| 1 Room | 0 (0.0%) | 0 (0.0%) |
| 2 or 3 Rooms | 0 (0.0%) | 0 (0.0%) |
| 4 or 5 Rooms | 7 (24.1%) | 4 (33.3%) |
| 6 or 7 Rooms | 12 (41.4%) | 2 (16.7%) |
| 8 or more Rooms | 10 (34.5%) | 6 (50.0%) |
| Total | 29 (100.0%) | 12 (100.0%) |
Housing Structure by Heating Type in Castine
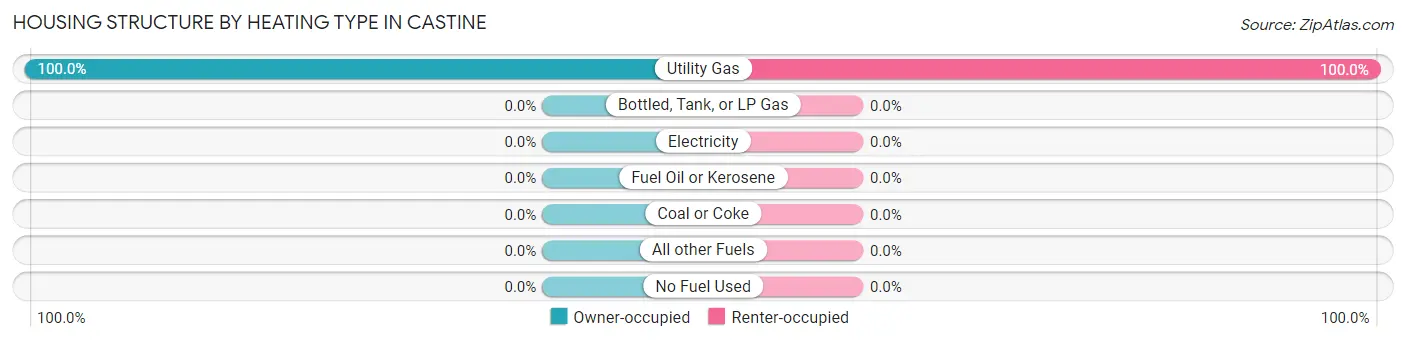
| Heating Type | Owner-occupied | Renter-occupied |
| Utility Gas | 29 (100.0%) | 12 (100.0%) |
| Bottled, Tank, or LP Gas | 0 (0.0%) | 0 (0.0%) |
| Electricity | 0 (0.0%) | 0 (0.0%) |
| Fuel Oil or Kerosene | 0 (0.0%) | 0 (0.0%) |
| Coal or Coke | 0 (0.0%) | 0 (0.0%) |
| All other Fuels | 0 (0.0%) | 0 (0.0%) |
| No Fuel Used | 0 (0.0%) | 0 (0.0%) |
| Total | 29 (100.0%) | 12 (100.0%) |
Household Vehicle Usage in Castine
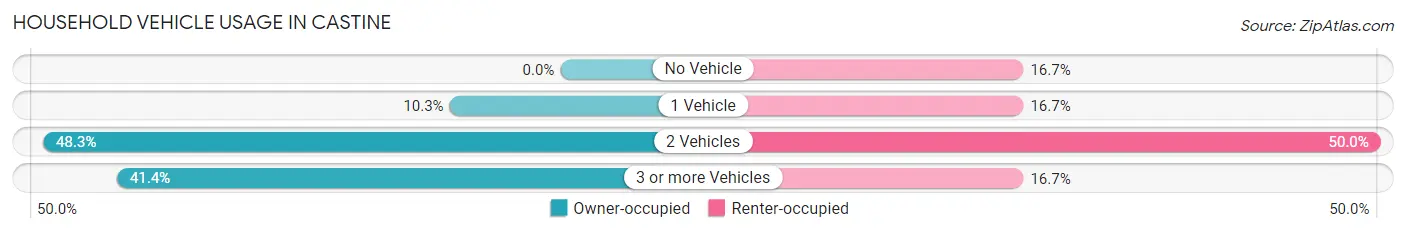
| Vehicles per Household | Owner-occupied | Renter-occupied |
| No Vehicle | 0 (0.0%) | 2 (16.7%) |
| 1 Vehicle | 3 (10.3%) | 2 (16.7%) |
| 2 Vehicles | 14 (48.3%) | 6 (50.0%) |
| 3 or more Vehicles | 12 (41.4%) | 2 (16.7%) |
| Total | 29 (100.0%) | 12 (100.0%) |
Real Estate & Mortgages in Castine
Real Estate and Mortgage Overview in Castine
| Characteristic | Without Mortgage | With Mortgage |
| Housing Units | 12 | 17 |
| Median Property Value | $85,000 | $108,800 |
| Median Household Income | $56,250 | $0 |
| Monthly Housing Costs | $325 | $0 |
| Real Estate Taxes | $1,250 | $0 |
Property Value by Mortgage Status in Castine
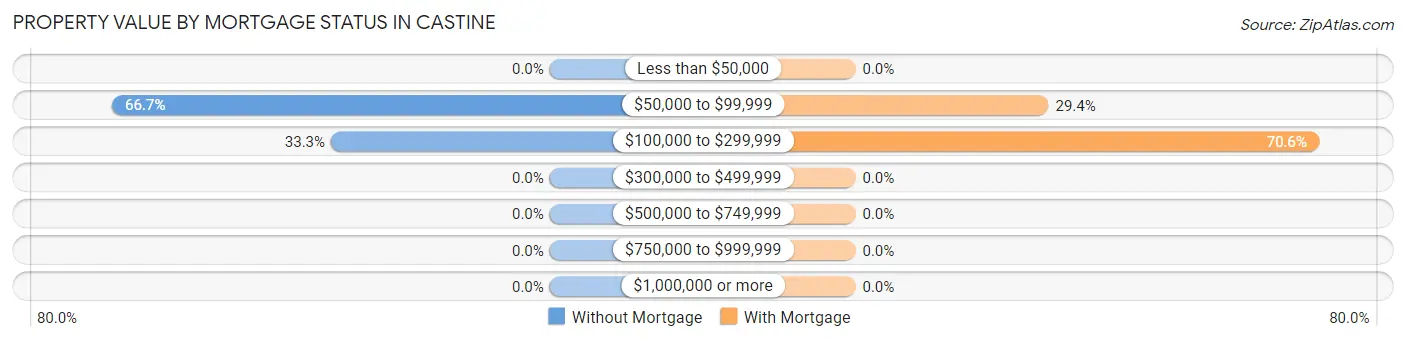
| Property Value | Without Mortgage | With Mortgage |
| Less than $50,000 | 0 (0.0%) | 0 (0.0%) |
| $50,000 to $99,999 | 8 (66.7%) | 5 (29.4%) |
| $100,000 to $299,999 | 4 (33.3%) | 12 (70.6%) |
| $300,000 to $499,999 | 0 (0.0%) | 0 (0.0%) |
| $500,000 to $749,999 | 0 (0.0%) | 0 (0.0%) |
| $750,000 to $999,999 | 0 (0.0%) | 0 (0.0%) |
| $1,000,000 or more | 0 (0.0%) | 0 (0.0%) |
| Total | 12 (100.0%) | 17 (100.0%) |
Household Income by Mortgage Status in Castine
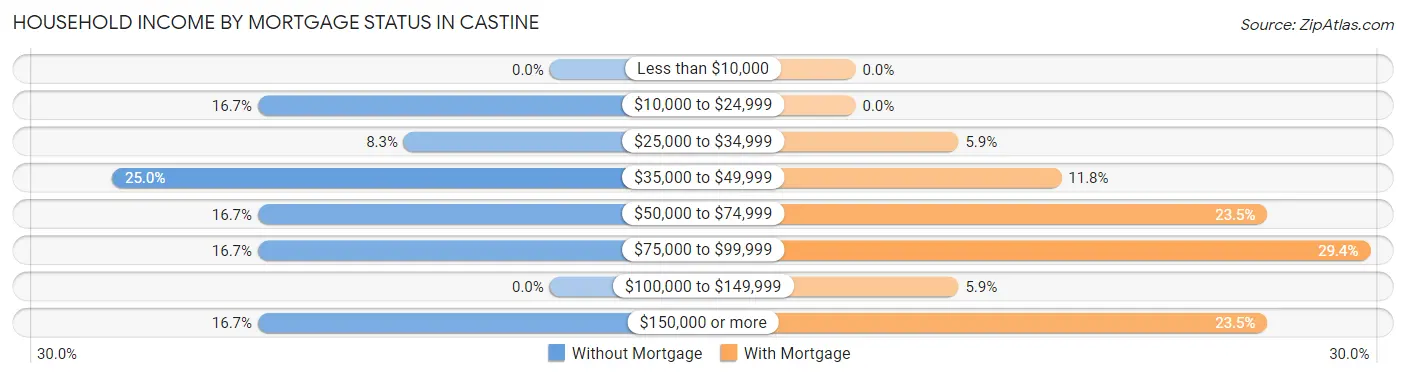
| Household Income | Without Mortgage | With Mortgage |
| Less than $10,000 | 0 (0.0%) | 0 (0.0%) |
| $10,000 to $24,999 | 2 (16.7%) | 0 (0.0%) |
| $25,000 to $34,999 | 1 (8.3%) | 1 (5.9%) |
| $35,000 to $49,999 | 3 (25.0%) | 2 (11.8%) |
| $50,000 to $74,999 | 2 (16.7%) | 4 (23.5%) |
| $75,000 to $99,999 | 2 (16.7%) | 5 (29.4%) |
| $100,000 to $149,999 | 0 (0.0%) | 1 (5.9%) |
| $150,000 or more | 2 (16.7%) | 4 (23.5%) |
| Total | 12 (100.0%) | 17 (100.0%) |
Property Value to Household Income Ratio in Castine
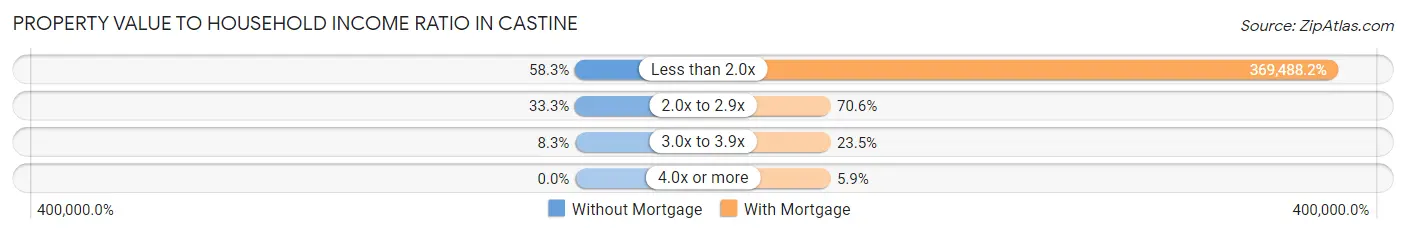
| Value-to-Income Ratio | Without Mortgage | With Mortgage |
| Less than 2.0x | 7 (58.3%) | 62,813 (369,488.2%) |
| 2.0x to 2.9x | 4 (33.3%) | 12 (70.6%) |
| 3.0x to 3.9x | 1 (8.3%) | 4 (23.5%) |
| 4.0x or more | 0 (0.0%) | 1 (5.9%) |
| Total | 12 (100.0%) | 17 (100.0%) |
Real Estate Taxes by Mortgage Status in Castine
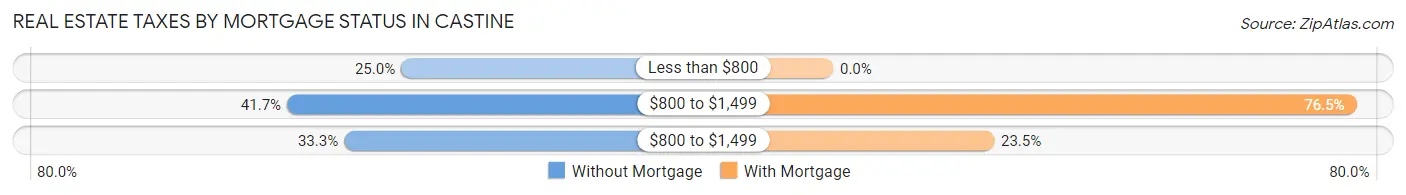
| Property Taxes | Without Mortgage | With Mortgage |
| Less than $800 | 3 (25.0%) | 0 (0.0%) |
| $800 to $1,499 | 5 (41.7%) | 13 (76.5%) |
| $800 to $1,499 | 4 (33.3%) | 4 (23.5%) |
| Total | 12 (100.0%) | 17 (100.0%) |
Health & Disability in Castine
Health Insurance Coverage by Age in Castine
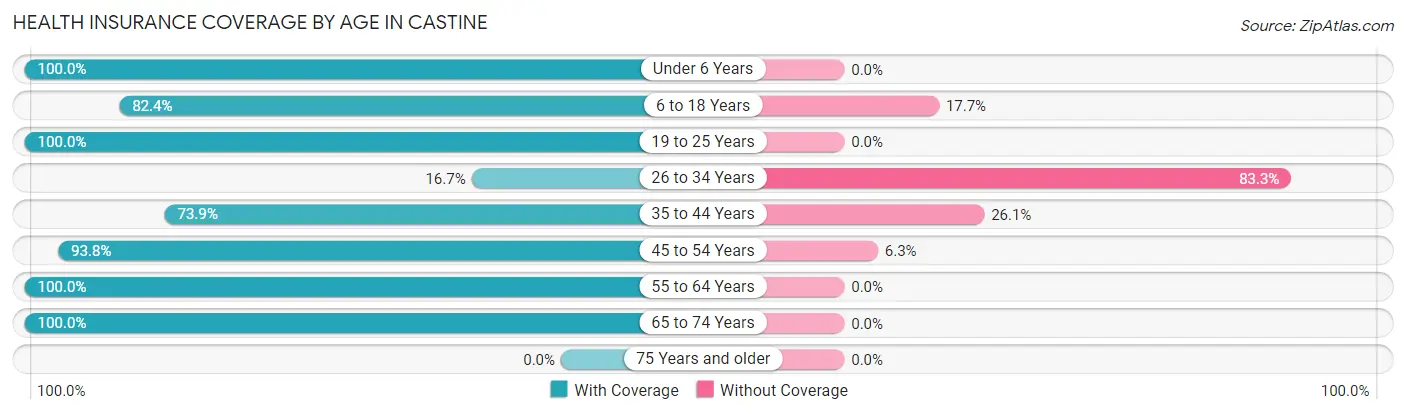
| Age Bracket | With Coverage | Without Coverage |
| Under 6 Years | 1 (100.0%) | 0 (0.0%) |
| 6 to 18 Years | 42 (82.4%) | 9 (17.6%) |
| 19 to 25 Years | 5 (100.0%) | 0 (0.0%) |
| 26 to 34 Years | 1 (16.7%) | 5 (83.3%) |
| 35 to 44 Years | 17 (73.9%) | 6 (26.1%) |
| 45 to 54 Years | 15 (93.8%) | 1 (6.2%) |
| 55 to 64 Years | 7 (100.0%) | 0 (0.0%) |
| 65 to 74 Years | 12 (100.0%) | 0 (0.0%) |
| 75 Years and older | 0 (0.0%) | 0 (0.0%) |
| Total | 100 (82.6%) | 21 (17.4%) |
Health Insurance Coverage by Citizenship Status in Castine
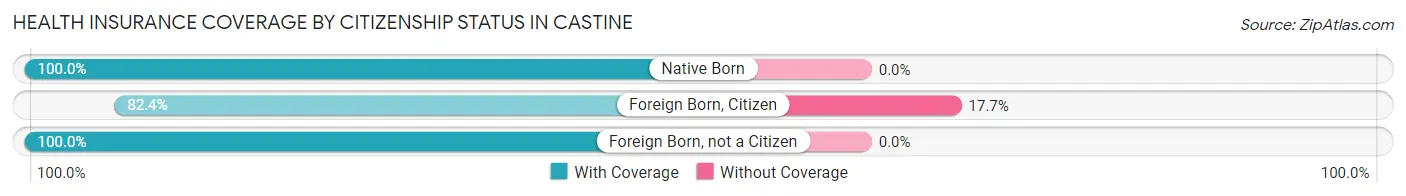
| Citizenship Status | With Coverage | Without Coverage |
| Native Born | 1 (100.0%) | 0 (0.0%) |
| Foreign Born, Citizen | 42 (82.4%) | 9 (17.6%) |
| Foreign Born, not a Citizen | 5 (100.0%) | 0 (0.0%) |
Health Insurance Coverage by Household Income in Castine
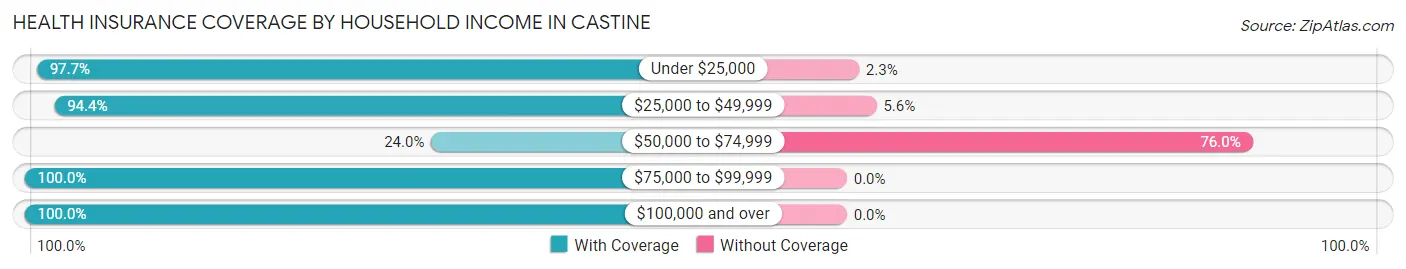
| Household Income | With Coverage | Without Coverage |
| Under $25,000 | 43 (97.7%) | 1 (2.3%) |
| $25,000 to $49,999 | 17 (94.4%) | 1 (5.6%) |
| $50,000 to $74,999 | 6 (24.0%) | 19 (76.0%) |
| $75,000 to $99,999 | 6 (100.0%) | 0 (0.0%) |
| $100,000 and over | 28 (100.0%) | 0 (0.0%) |
Public vs Private Health Insurance Coverage by Age in Castine
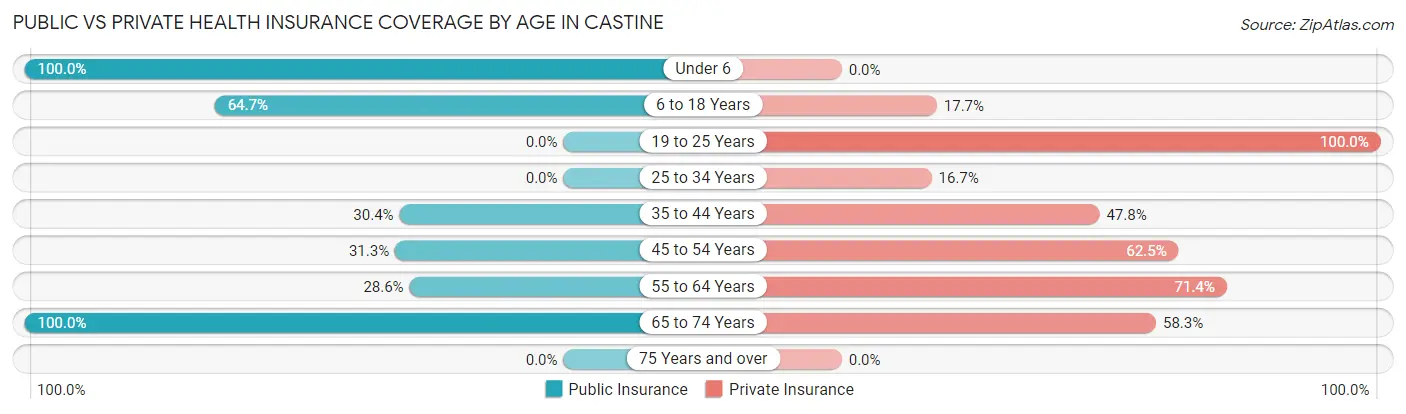
| Age Bracket | Public Insurance | Private Insurance |
| Under 6 | 1 (100.0%) | 0 (0.0%) |
| 6 to 18 Years | 33 (64.7%) | 9 (17.6%) |
| 19 to 25 Years | 0 (0.0%) | 5 (100.0%) |
| 25 to 34 Years | 0 (0.0%) | 1 (16.7%) |
| 35 to 44 Years | 7 (30.4%) | 11 (47.8%) |
| 45 to 54 Years | 5 (31.2%) | 10 (62.5%) |
| 55 to 64 Years | 2 (28.6%) | 5 (71.4%) |
| 65 to 74 Years | 12 (100.0%) | 7 (58.3%) |
| 75 Years and over | 0 (0.0%) | 0 (0.0%) |
| Total | 60 (49.6%) | 48 (39.7%) |
Disability Status by Sex by Age in Castine
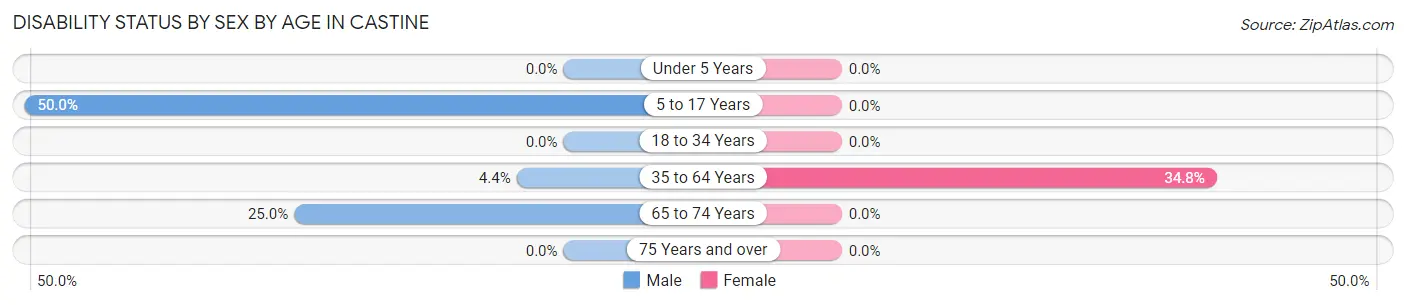
| Age Bracket | Male | Female |
| Under 5 Years | 0 (0.0%) | 0 (0.0%) |
| 5 to 17 Years | 8 (50.0%) | 0 (0.0%) |
| 18 to 34 Years | 0 (0.0%) | 0 (0.0%) |
| 35 to 64 Years | 1 (4.3%) | 8 (34.8%) |
| 65 to 74 Years | 1 (25.0%) | 0 (0.0%) |
| 75 Years and over | 0 (0.0%) | 0 (0.0%) |
Disability Class by Sex by Age in Castine
Disability Class: Hearing Difficulty
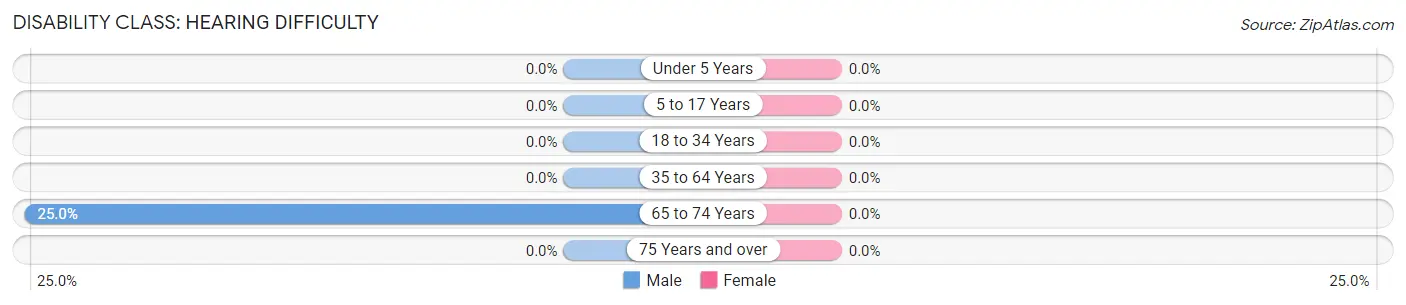
| Age Bracket | Male | Female |
| Under 5 Years | 0 (0.0%) | 0 (0.0%) |
| 5 to 17 Years | 0 (0.0%) | 0 (0.0%) |
| 18 to 34 Years | 0 (0.0%) | 0 (0.0%) |
| 35 to 64 Years | 0 (0.0%) | 0 (0.0%) |
| 65 to 74 Years | 1 (25.0%) | 0 (0.0%) |
| 75 Years and over | 0 (0.0%) | 0 (0.0%) |
Disability Class: Vision Difficulty
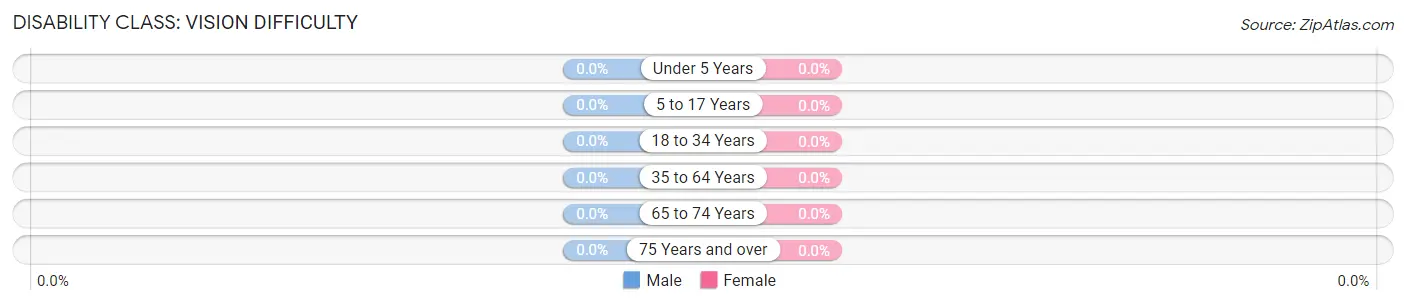
| Age Bracket | Male | Female |
| Under 5 Years | 0 (0.0%) | 0 (0.0%) |
| 5 to 17 Years | 0 (0.0%) | 0 (0.0%) |
| 18 to 34 Years | 0 (0.0%) | 0 (0.0%) |
| 35 to 64 Years | 0 (0.0%) | 0 (0.0%) |
| 65 to 74 Years | 0 (0.0%) | 0 (0.0%) |
| 75 Years and over | 0 (0.0%) | 0 (0.0%) |
Disability Class: Cognitive Difficulty
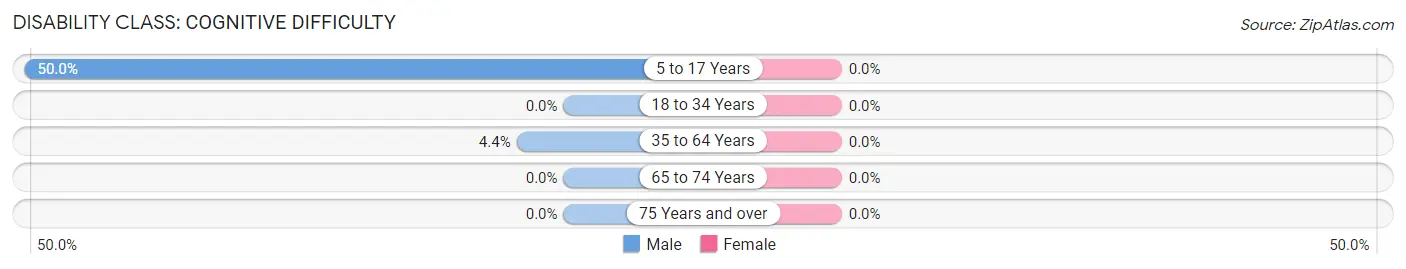
| Age Bracket | Male | Female |
| 5 to 17 Years | 8 (50.0%) | 0 (0.0%) |
| 18 to 34 Years | 0 (0.0%) | 0 (0.0%) |
| 35 to 64 Years | 1 (4.3%) | 0 (0.0%) |
| 65 to 74 Years | 0 (0.0%) | 0 (0.0%) |
| 75 Years and over | 0 (0.0%) | 0 (0.0%) |
Disability Class: Ambulatory Difficulty
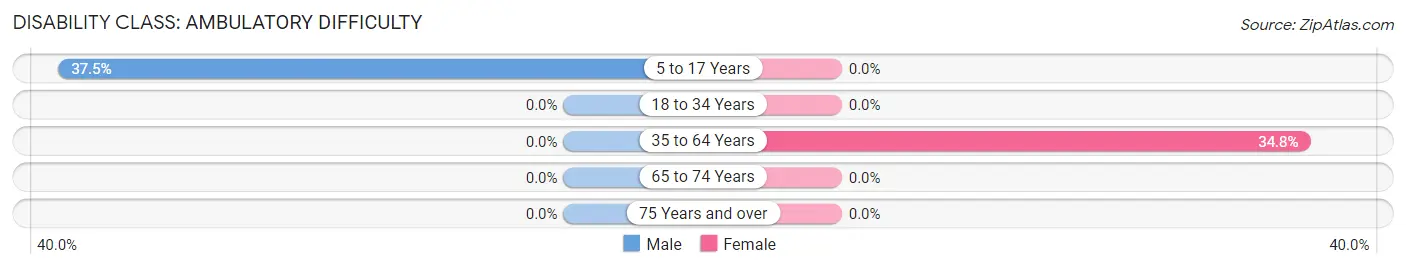
| Age Bracket | Male | Female |
| 5 to 17 Years | 6 (37.5%) | 0 (0.0%) |
| 18 to 34 Years | 0 (0.0%) | 0 (0.0%) |
| 35 to 64 Years | 0 (0.0%) | 8 (34.8%) |
| 65 to 74 Years | 0 (0.0%) | 0 (0.0%) |
| 75 Years and over | 0 (0.0%) | 0 (0.0%) |
Disability Class: Self-Care Difficulty
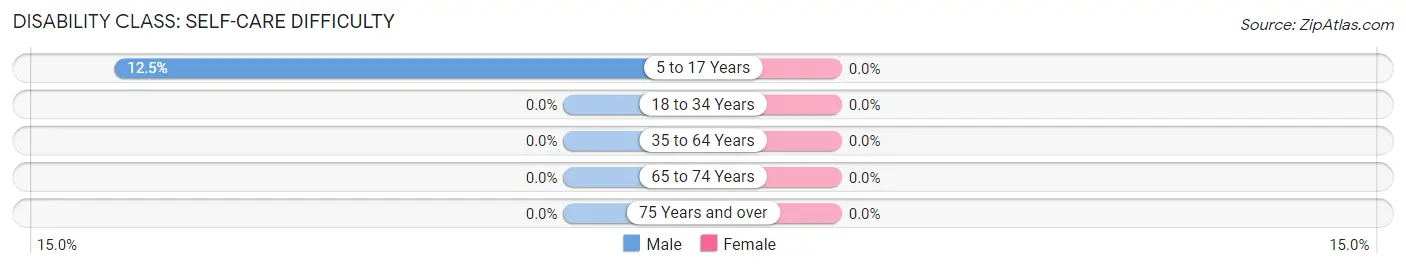
| Age Bracket | Male | Female |
| 5 to 17 Years | 2 (12.5%) | 0 (0.0%) |
| 18 to 34 Years | 0 (0.0%) | 0 (0.0%) |
| 35 to 64 Years | 0 (0.0%) | 0 (0.0%) |
| 65 to 74 Years | 0 (0.0%) | 0 (0.0%) |
| 75 Years and over | 0 (0.0%) | 0 (0.0%) |
Technology Access in Castine
Computing Device Access in Castine
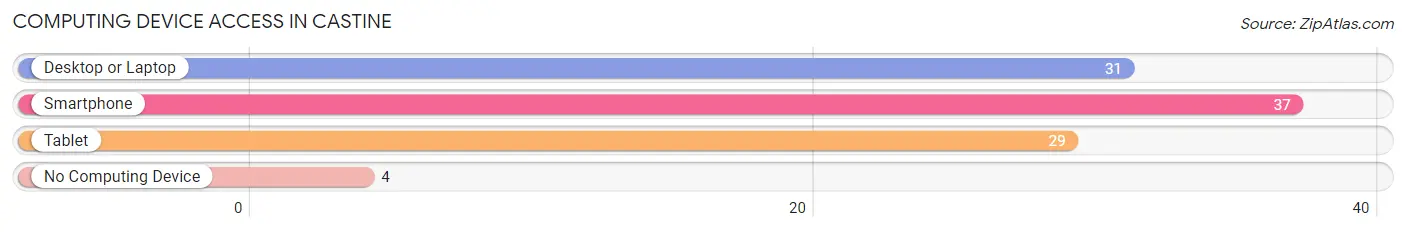
| Device Type | # Households | % Households |
| Desktop or Laptop | 31 | 75.6% |
| Smartphone | 37 | 90.2% |
| Tablet | 29 | 70.7% |
| No Computing Device | 4 | 9.8% |
| Total | 41 | 100.0% |
Internet Access in Castine
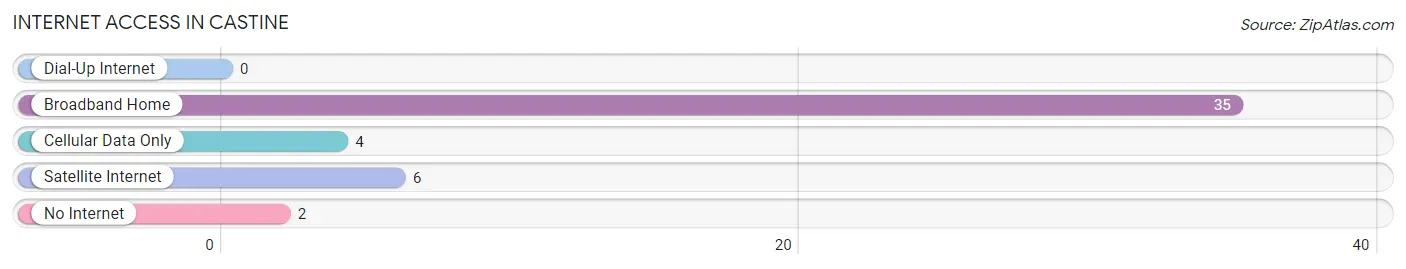
| Internet Type | # Households | % Households |
| Dial-Up Internet | 0 | 0.0% |
| Broadband Home | 35 | 85.4% |
| Cellular Data Only | 4 | 9.8% |
| Satellite Internet | 6 | 14.6% |
| No Internet | 2 | 4.9% |
| Total | 41 | 100.0% |
Castine Summary
Castine, Ohio is a small village located in the northwest corner of Hancock County, Ohio. It is situated on the banks of the Blanchard River, which is a tributary of the Auglaize River. The village is located approximately 20 miles south of Findlay, Ohio and approximately 40 miles north of Lima, Ohio. The population of Castine was estimated to be 545 in the year 2000.
History
The area that is now Castine was first settled in 1835 by a group of settlers from Pennsylvania. The village was originally known as “Castine” after a town in Maine. The village was officially incorporated in 1854.
In the late 19th century, Castine was a thriving agricultural community. The village was home to several grain mills, a sawmill, a grist mill, and a woolen mill. The village also had a blacksmith shop, a general store, and a post office.
In the early 20th century, the village began to decline as the agricultural industry shifted away from the area. The woolen mill closed in the 1920s and the grist mill closed in the 1930s. The sawmill and the blacksmith shop closed in the 1940s.
Geography
Castine is located in the northwest corner of Hancock County, Ohio. The village is situated on the banks of the Blanchard River, which is a tributary of the Auglaize River. The village is located approximately 20 miles south of Findlay, Ohio and approximately 40 miles north of Lima, Ohio.
The village is located in a rural area and is surrounded by farmland. The nearest major city is Findlay, Ohio, which is approximately 20 miles away.
Economy
The economy of Castine is largely based on agriculture. The village is home to several farms that produce corn, soybeans, and wheat. The village also has a few small businesses, including a gas station, a convenience store, and a restaurant.
Demographics
The population of Castine was estimated to be 545 in the year 2000. The village is predominantly white, with approximately 95% of the population being white. The median household income in Castine is approximately $37,000. The median age of the population is approximately 40 years old.
Conclusion
Castine, Ohio is a small village located in the northwest corner of Hancock County, Ohio. It is situated on the banks of the Blanchard River, which is a tributary of the Auglaize River. The village is located approximately 20 miles south of Findlay, Ohio and approximately 40 miles north of Lima, Ohio. The population of Castine was estimated to be 545 in the year 2000. The economy of Castine is largely based on agriculture, with the village being home to several farms that produce corn, soybeans, and wheat. The village also has a few small businesses, including a gas station, a convenience store, and a restaurant. The population of Castine is predominantly white, with approximately 95% of the population being white. The median household income in Castine is approximately $37,000. The median age of the population is approximately 40 years old.
Common Questions
What is Per Capita Income in Castine?
Per Capita income in Castine is $20,739.
What is the Median Family Income in Castine?
Median Family Income in Castine is $63,438.
What is the Median Household income in Castine?
Median Household Income in Castine is $46,250.
What is Inequality or Gini Index in Castine?
Inequality or Gini Index in Castine is 0.42.
What is the Total Population of Castine?
Total Population of Castine is 121.
What is the Total Male Population of Castine?
Total Male Population of Castine is 54.
What is the Total Female Population of Castine?
Total Female Population of Castine is 67.
What is the Ratio of Males per 100 Females in Castine?
There are 80.60 Males per 100 Females in Castine.
What is the Ratio of Females per 100 Males in Castine?
There are 124.07 Females per 100 Males in Castine.
What is the Median Population Age in Castine?
Median Population Age in Castine is 34.5 Years.
What is the Average Family Size in Castine
Average Family Size in Castine is 3.6 People.
What is the Average Household Size in Castine
Average Household Size in Castine is 3.0 People.
How Large is the Labor Force in Castine?
There are 45 People in the Labor Forcein in Castine.
What is the Percentage of People in the Labor Force in Castine?
57.7% of People are in the Labor Force in Castine.