Pleasant Grove, OH Map & Demographics
Pleasant Grove Map
Pleasant Grove Overview
$35,793
PER CAPITA INCOME
$80,577
AVG FAMILY INCOME
$71,115
AVG HOUSEHOLD INCOME
47.7%
WAGE / INCOME GAP [ % ]
52.3¢/ $1
WAGE / INCOME GAP [ $ ]
0.44
INEQUALITY / GINI INDEX
1,310
TOTAL POPULATION
614
MALE POPULATION
696
FEMALE POPULATION
88.22
MALES / 100 FEMALES
113.36
FEMALES / 100 MALES
50.0
MEDIAN AGE
2.5
AVG FAMILY SIZE
2.1
AVG HOUSEHOLD SIZE
717
LABOR FORCE [ PEOPLE ]
62.8%
PERCENT IN LABOR FORCE
2.2%
UNEMPLOYMENT RATE
Income in Pleasant Grove
Income Overview in Pleasant Grove
Per Capita Income in Pleasant Grove is $35,793, while median incomes of families and households are $80,577 and $71,115 respectively.
| Characteristic | Number | Measure |
| Per Capita Income | 1,310 | $35,793 |
| Median Family Income | 406 | $80,577 |
| Mean Family Income | 406 | $89,934 |
| Median Household Income | 619 | $71,115 |
| Mean Household Income | 619 | $74,912 |
| Income Deficit | 406 | $0 |
| Wage / Income Gap (%) | 1,310 | 47.74% |
| Wage / Income Gap ($) | 1,310 | 52.26¢ per $1 |
| Gini / Inequality Index | 1,310 | 0.44 |
Earnings by Sex in Pleasant Grove
Average Earnings in Pleasant Grove are $34,318, $58,031 for men and $30,329 for women, a difference of 47.7%.
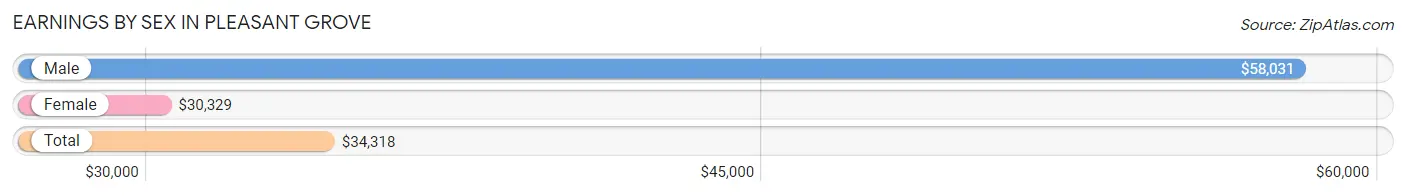
| Sex | Number | Average Earnings |
| Male | 329 (44.2%) | $58,031 |
| Female | 415 (55.8%) | $30,329 |
| Total | 744 (100.0%) | $34,318 |
Earnings by Sex by Income Bracket in Pleasant Grove
The most common earnings brackets in Pleasant Grove are $55,000 to $64,999 for men (76 | 23.1%) and $2,499 or less for women (53 | 12.8%).
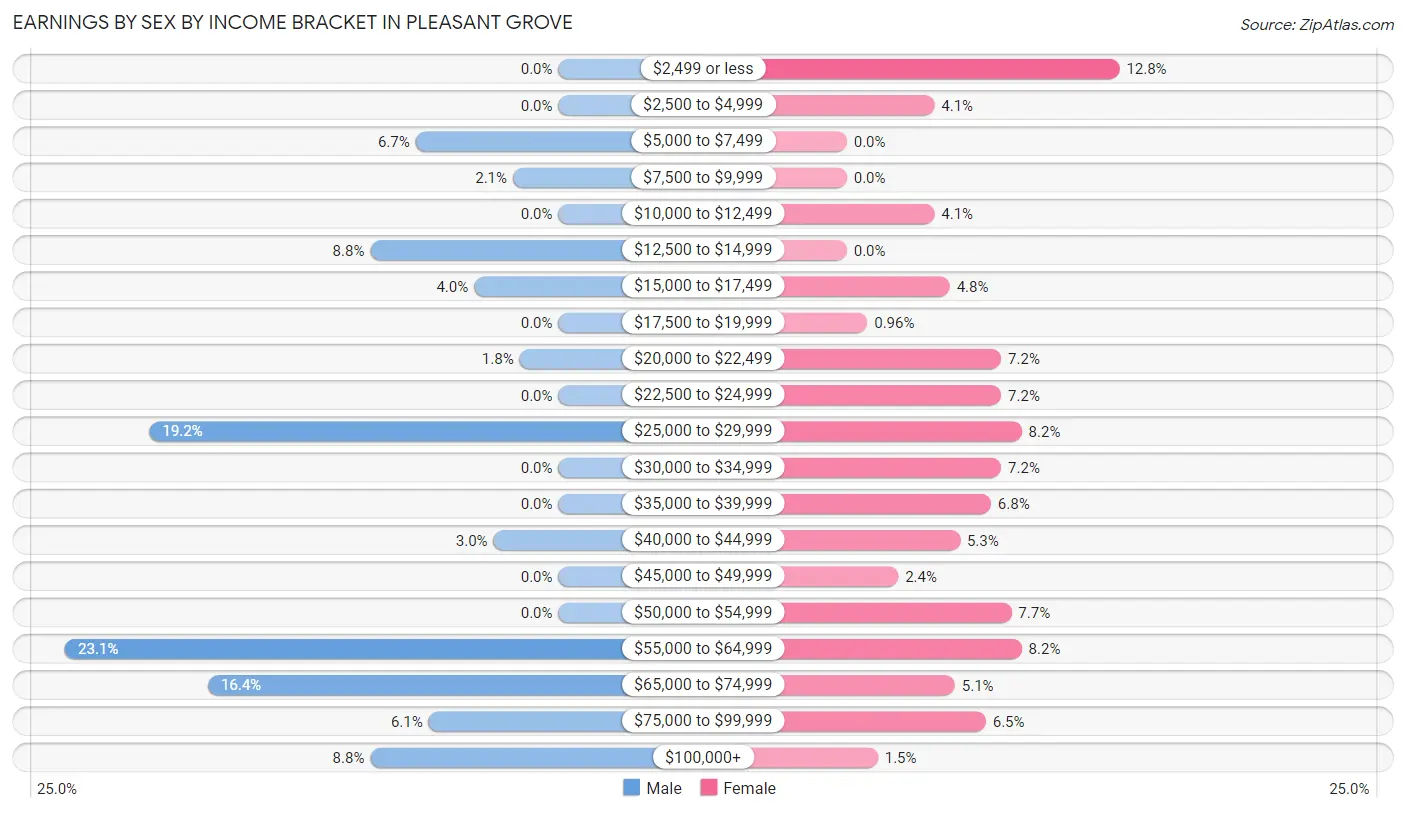
| Income | Male | Female |
| $2,499 or less | 0 (0.0%) | 53 (12.8%) |
| $2,500 to $4,999 | 0 (0.0%) | 17 (4.1%) |
| $5,000 to $7,499 | 22 (6.7%) | 0 (0.0%) |
| $7,500 to $9,999 | 7 (2.1%) | 0 (0.0%) |
| $10,000 to $12,499 | 0 (0.0%) | 17 (4.1%) |
| $12,500 to $14,999 | 29 (8.8%) | 0 (0.0%) |
| $15,000 to $17,499 | 13 (4.0%) | 20 (4.8%) |
| $17,500 to $19,999 | 0 (0.0%) | 4 (1.0%) |
| $20,000 to $22,499 | 6 (1.8%) | 30 (7.2%) |
| $22,500 to $24,999 | 0 (0.0%) | 30 (7.2%) |
| $25,000 to $29,999 | 63 (19.2%) | 34 (8.2%) |
| $30,000 to $34,999 | 0 (0.0%) | 30 (7.2%) |
| $35,000 to $39,999 | 0 (0.0%) | 28 (6.8%) |
| $40,000 to $44,999 | 10 (3.0%) | 22 (5.3%) |
| $45,000 to $49,999 | 0 (0.0%) | 10 (2.4%) |
| $50,000 to $54,999 | 0 (0.0%) | 32 (7.7%) |
| $55,000 to $64,999 | 76 (23.1%) | 34 (8.2%) |
| $65,000 to $74,999 | 54 (16.4%) | 21 (5.1%) |
| $75,000 to $99,999 | 20 (6.1%) | 27 (6.5%) |
| $100,000+ | 29 (8.8%) | 6 (1.5%) |
| Total | 329 (100.0%) | 415 (100.0%) |
Earnings by Sex by Educational Attainment in Pleasant Grove
Average earnings in Pleasant Grove are $58,938 for men and $30,987 for women, a difference of 47.4%. Men with an educational attainment of college or associate's degree enjoy the highest average annual earnings of $68,250, while those with college or associate's degree education earn the least with $68,250. Women with an educational attainment of bachelor's degree earn the most with the average annual earnings of $71,310, while those with high school diploma education have the smallest earnings of $23,315.
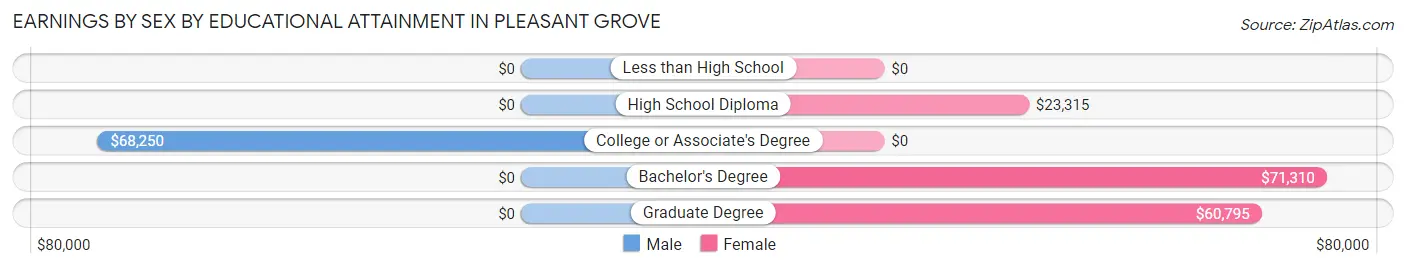
| Educational Attainment | Male Income | Female Income |
| Less than High School | - | - |
| High School Diploma | - | - |
| College or Associate's Degree | $68,250 | $0 |
| Bachelor's Degree | - | - |
| Graduate Degree | - | - |
| Total | $58,938 | $30,987 |
Family Income in Pleasant Grove
Family Income Brackets in Pleasant Grove
According to the Pleasant Grove family income data, there are 111 families falling into the $75,000 to $99,999 income range, which is the most common income bracket and makes up 27.3% of all families. Conversely, the $15,000 to $24,999 income bracket is the least frequent group with only 7 families (1.7%) belonging to this category.
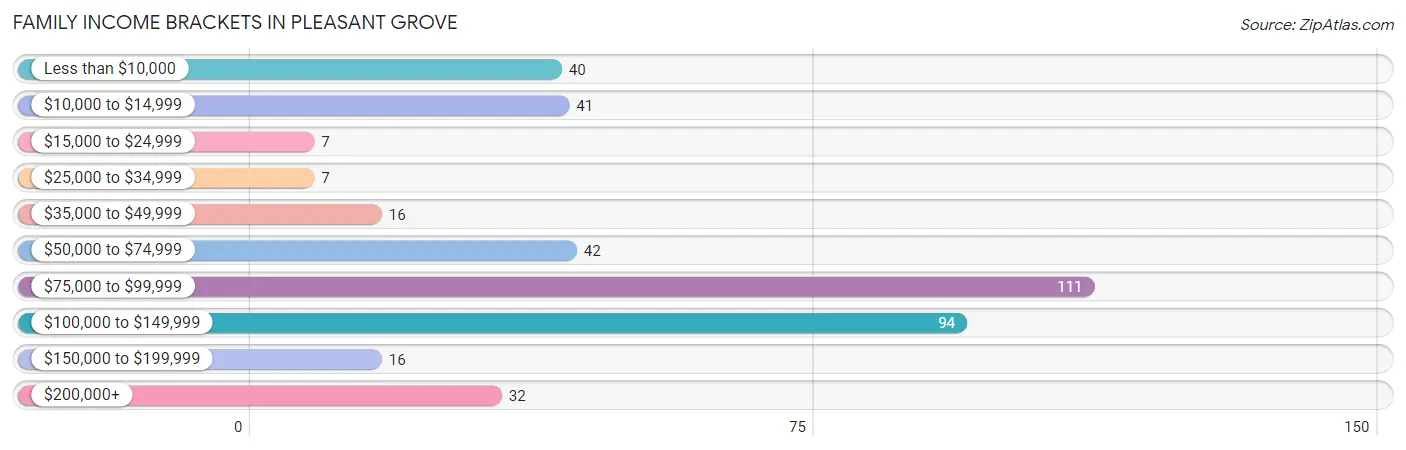
| Income Bracket | # Families | % Families |
| Less than $10,000 | 40 | 9.9% |
| $10,000 to $14,999 | 41 | 10.1% |
| $15,000 to $24,999 | 7 | 1.7% |
| $25,000 to $34,999 | 7 | 1.7% |
| $35,000 to $49,999 | 16 | 3.9% |
| $50,000 to $74,999 | 42 | 10.3% |
| $75,000 to $99,999 | 111 | 27.3% |
| $100,000 to $149,999 | 94 | 23.2% |
| $150,000 to $199,999 | 16 | 3.9% |
| $200,000+ | 32 | 7.9% |
Family Income by Famaliy Size in Pleasant Grove
3-person families (48 | 11.8%) account for the highest median family income in Pleasant Grove with $116,250 per family, while 2-person families (320 | 78.8%) have the highest median income of $39,148 per family member.
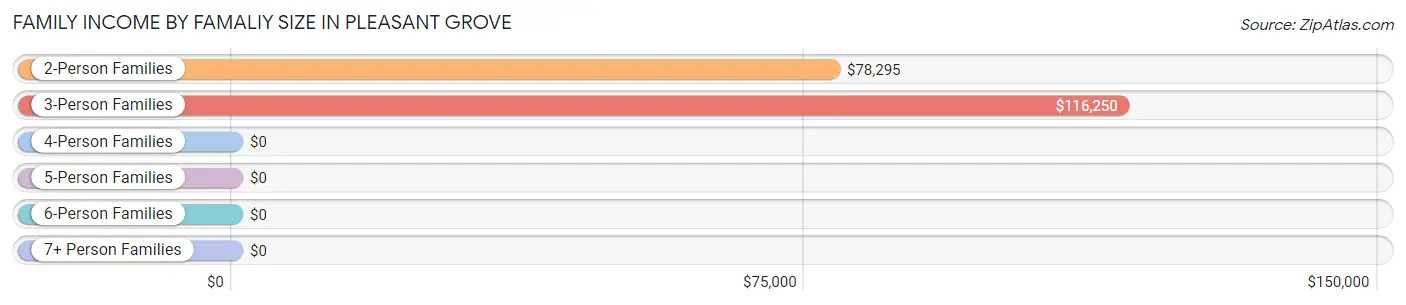
| Income Bracket | # Families | Median Income |
| 2-Person Families | 320 (78.8%) | $78,295 |
| 3-Person Families | 48 (11.8%) | $116,250 |
| 4-Person Families | 16 (3.9%) | $0 |
| 5-Person Families | 22 (5.4%) | $0 |
| 6-Person Families | 0 (0.0%) | $0 |
| 7+ Person Families | 0 (0.0%) | $0 |
| Total | 406 (100.0%) | $80,577 |
Family Income by Number of Earners in Pleasant Grove
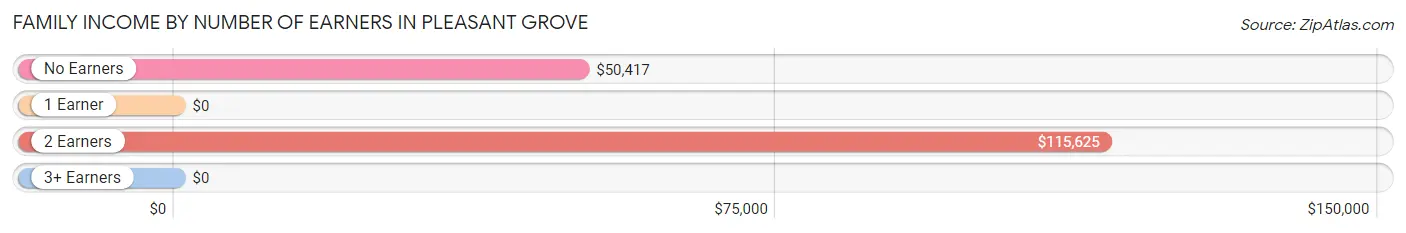
| Number of Earners | # Families | Median Income |
| No Earners | 119 (29.3%) | $50,417 |
| 1 Earner | 86 (21.2%) | $0 |
| 2 Earners | 173 (42.6%) | $115,625 |
| 3+ Earners | 28 (6.9%) | $0 |
| Total | 406 (100.0%) | $80,577 |
Household Income in Pleasant Grove
Household Income Brackets in Pleasant Grove
With 136 households falling in the category, the $75,000 to $99,999 income range is the most frequent in Pleasant Grove, accounting for 22.0% of all households. In contrast, only 27 households (4.4%) fall into the $15,000 to $24,999 income bracket, making it the least populous group.
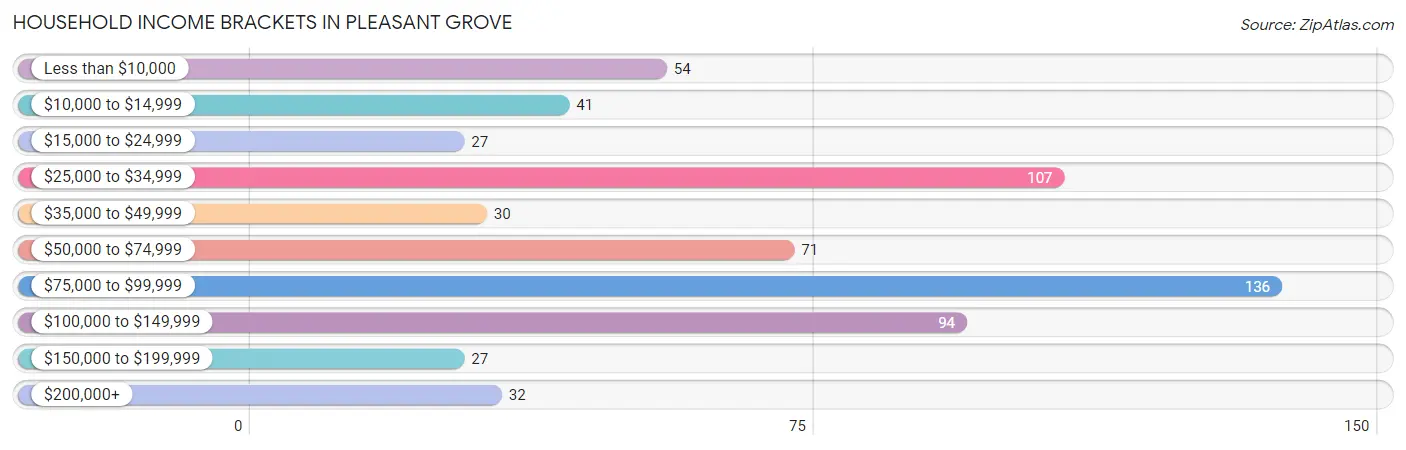
| Income Bracket | # Households | % Households |
| Less than $10,000 | 54 | 8.7% |
| $10,000 to $14,999 | 41 | 6.6% |
| $15,000 to $24,999 | 27 | 4.4% |
| $25,000 to $34,999 | 107 | 17.3% |
| $35,000 to $49,999 | 30 | 4.8% |
| $50,000 to $74,999 | 71 | 11.5% |
| $75,000 to $99,999 | 136 | 22.0% |
| $100,000 to $149,999 | 94 | 15.2% |
| $150,000 to $199,999 | 27 | 4.4% |
| $200,000+ | 32 | 5.2% |
Household Income by Householder Age in Pleasant Grove
The median household income in Pleasant Grove is $71,115, with the highest median household income of $123,750 found in the 25 to 44 years age bracket for the primary householder. A total of 76 households (12.3%) fall into this category. Meanwhile, the 15 to 24 years age bracket for the primary householder has the lowest median household income of $0, with 22 households (3.5%) in this group.
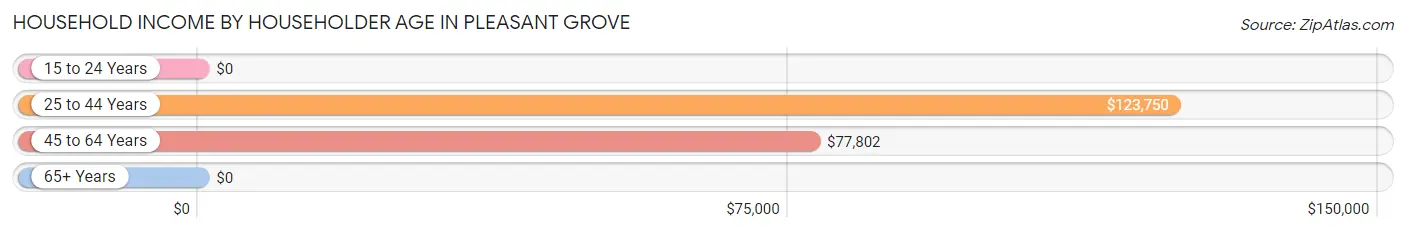
| Income Bracket | # Households | Median Income |
| 15 to 24 Years | 22 (3.5%) | $0 |
| 25 to 44 Years | 76 (12.3%) | $123,750 |
| 45 to 64 Years | 289 (46.7%) | $77,802 |
| 65+ Years | 232 (37.5%) | $0 |
| Total | 619 (100.0%) | $71,115 |
Poverty in Pleasant Grove
Income Below Poverty by Sex and Age in Pleasant Grove
With 11.0% poverty level for males and 27.6% for females among the residents of Pleasant Grove, 16 and 17 year old males and 6 to 11 year old females are the most vulnerable to poverty, with 7 males (25.0%) and 56 females (100.0%) in their respective age groups living below the poverty level.
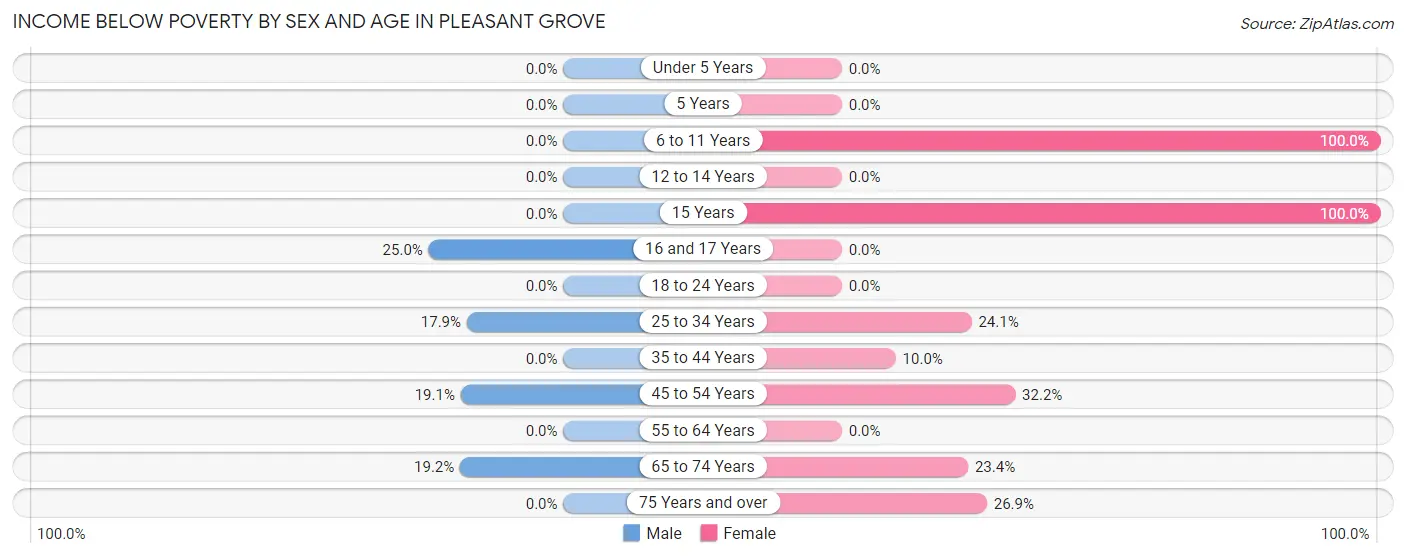
| Age Bracket | Male | Female |
| Under 5 Years | 0 (0.0%) | 0 (0.0%) |
| 5 Years | 0 (0.0%) | 0 (0.0%) |
| 6 to 11 Years | 0 (0.0%) | 56 (100.0%) |
| 12 to 14 Years | 0 (0.0%) | 0 (0.0%) |
| 15 Years | 0 (0.0%) | 9 (100.0%) |
| 16 and 17 Years | 7 (25.0%) | 0 (0.0%) |
| 18 to 24 Years | 0 (0.0%) | 0 (0.0%) |
| 25 to 34 Years | 12 (17.9%) | 13 (24.1%) |
| 35 to 44 Years | 0 (0.0%) | 7 (10.0%) |
| 45 to 54 Years | 16 (19.1%) | 56 (32.2%) |
| 55 to 64 Years | 0 (0.0%) | 0 (0.0%) |
| 65 to 74 Years | 32 (19.2%) | 37 (23.4%) |
| 75 Years and over | 0 (0.0%) | 14 (26.9%) |
| Total | 67 (11.0%) | 192 (27.6%) |
Income Above Poverty by Sex and Age in Pleasant Grove
According to the poverty statistics in Pleasant Grove, males aged under 5 years and females aged 18 to 24 years are the age groups that are most secure financially, with 100.0% of males and 100.0% of females in these age groups living above the poverty line.
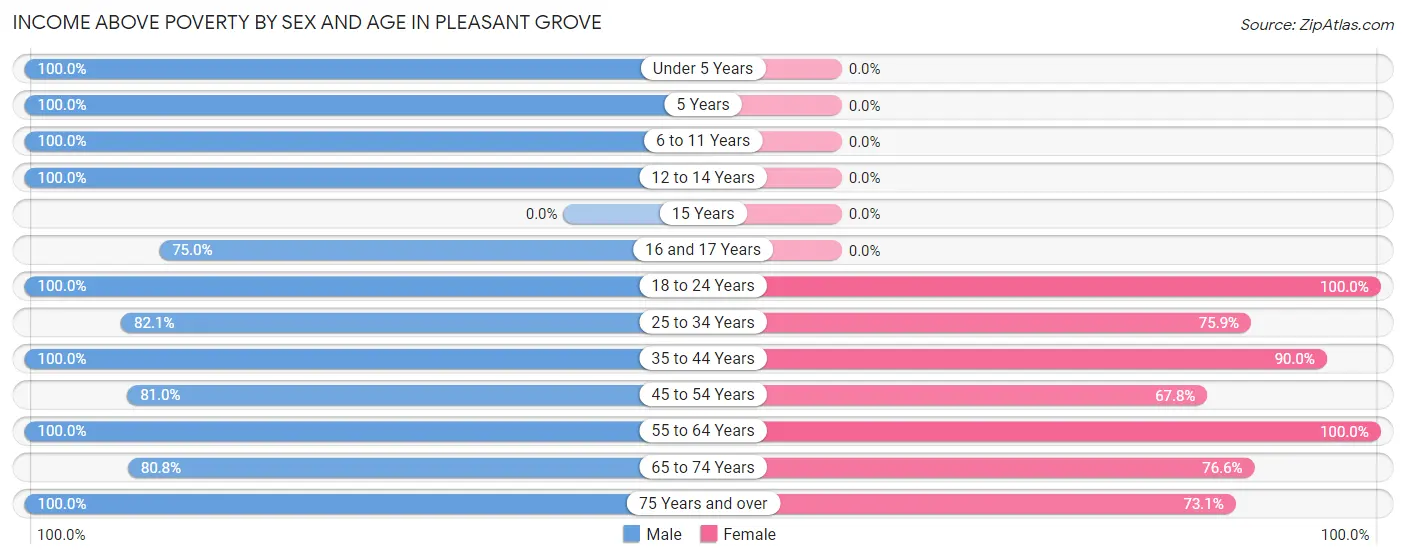
| Age Bracket | Male | Female |
| Under 5 Years | 29 (100.0%) | 0 (0.0%) |
| 5 Years | 23 (100.0%) | 0 (0.0%) |
| 6 to 11 Years | 26 (100.0%) | 0 (0.0%) |
| 12 to 14 Years | 26 (100.0%) | 0 (0.0%) |
| 15 Years | 0 (0.0%) | 0 (0.0%) |
| 16 and 17 Years | 21 (75.0%) | 0 (0.0%) |
| 18 to 24 Years | 22 (100.0%) | 10 (100.0%) |
| 25 to 34 Years | 55 (82.1%) | 41 (75.9%) |
| 35 to 44 Years | 50 (100.0%) | 63 (90.0%) |
| 45 to 54 Years | 68 (80.9%) | 118 (67.8%) |
| 55 to 64 Years | 55 (100.0%) | 113 (100.0%) |
| 65 to 74 Years | 135 (80.8%) | 121 (76.6%) |
| 75 Years and over | 32 (100.0%) | 38 (73.1%) |
| Total | 542 (89.0%) | 504 (72.4%) |
Income Below Poverty Among Married-Couple Families in Pleasant Grove
The poverty statistics for married-couple families in Pleasant Grove show that 11.9% or 32 of the total 268 families live below the poverty line. Families with no children have the highest poverty rate of 14.9%, comprising of 32 families. On the other hand, families with 1 or 2 children have the lowest poverty rate of 0.0%, which includes 0 families.
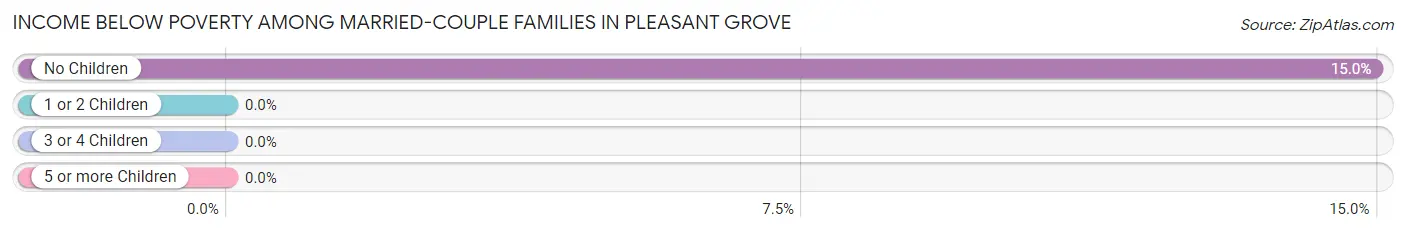
| Children | Above Poverty | Below Poverty |
| No Children | 182 (85.1%) | 32 (14.9%) |
| 1 or 2 Children | 32 (100.0%) | 0 (0.0%) |
| 3 or 4 Children | 22 (100.0%) | 0 (0.0%) |
| 5 or more Children | 0 (0.0%) | 0 (0.0%) |
| Total | 236 (88.1%) | 32 (11.9%) |
Income Below Poverty Among Single-Parent Households in Pleasant Grove
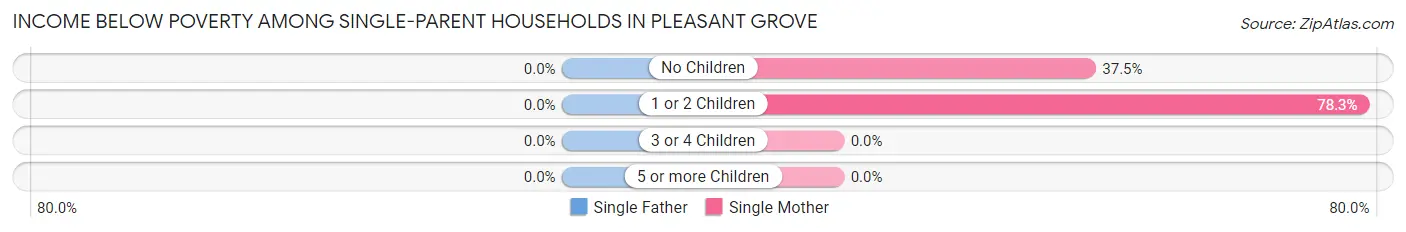
| Children | Single Father | Single Mother |
| No Children | 0 (0.0%) | 9 (37.5%) |
| 1 or 2 Children | 0 (0.0%) | 47 (78.3%) |
| 3 or 4 Children | 0 (0.0%) | 0 (0.0%) |
| 5 or more Children | 0 (0.0%) | 0 (0.0%) |
| Total | 0 (0.0%) | 56 (66.7%) |
Income Below Poverty Among Married-Couple vs Single-Parent Households in Pleasant Grove
The poverty data for Pleasant Grove shows that 32 of the married-couple family households (11.9%) and 56 of the single-parent households (40.6%) are living below the poverty level. Within the married-couple family households, those with no children have the highest poverty rate, with 32 households (14.9%) falling below the poverty line. Among the single-parent households, those with 1 or 2 children have the highest poverty rate, with 47 household (78.3%) living below poverty.
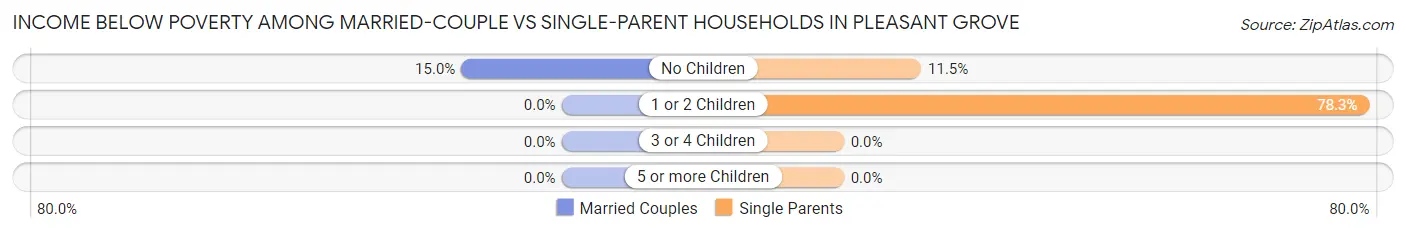
| Children | Married-Couple Families | Single-Parent Households |
| No Children | 32 (14.9%) | 9 (11.5%) |
| 1 or 2 Children | 0 (0.0%) | 47 (78.3%) |
| 3 or 4 Children | 0 (0.0%) | 0 (0.0%) |
| 5 or more Children | 0 (0.0%) | 0 (0.0%) |
| Total | 32 (11.9%) | 56 (40.6%) |
Race in Pleasant Grove
The most populous races in Pleasant Grove are White / Caucasian (1,306 | 99.7%), and Black / African American (4 | 0.3%).
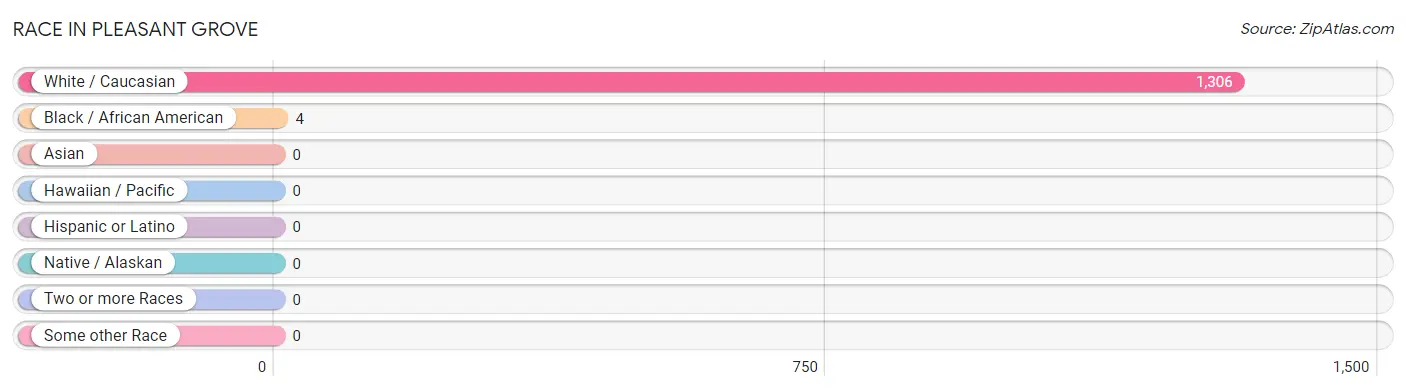
| Race | # Population | % Population |
| Asian | 0 | 0.0% |
| Black / African American | 4 | 0.3% |
| Hawaiian / Pacific | 0 | 0.0% |
| Hispanic or Latino | 0 | 0.0% |
| Native / Alaskan | 0 | 0.0% |
| White / Caucasian | 1,306 | 99.7% |
| Two or more Races | 0 | 0.0% |
| Some other Race | 0 | 0.0% |
| Total | 1,310 | 100.0% |
Ancestry in Pleasant Grove
The most populous ancestries reported in Pleasant Grove are German (328 | 25.0%), English (192 | 14.7%), Irish (187 | 14.3%), American (157 | 12.0%), and Italian (56 | 4.3%), together accounting for 70.2% of all Pleasant Grove residents.
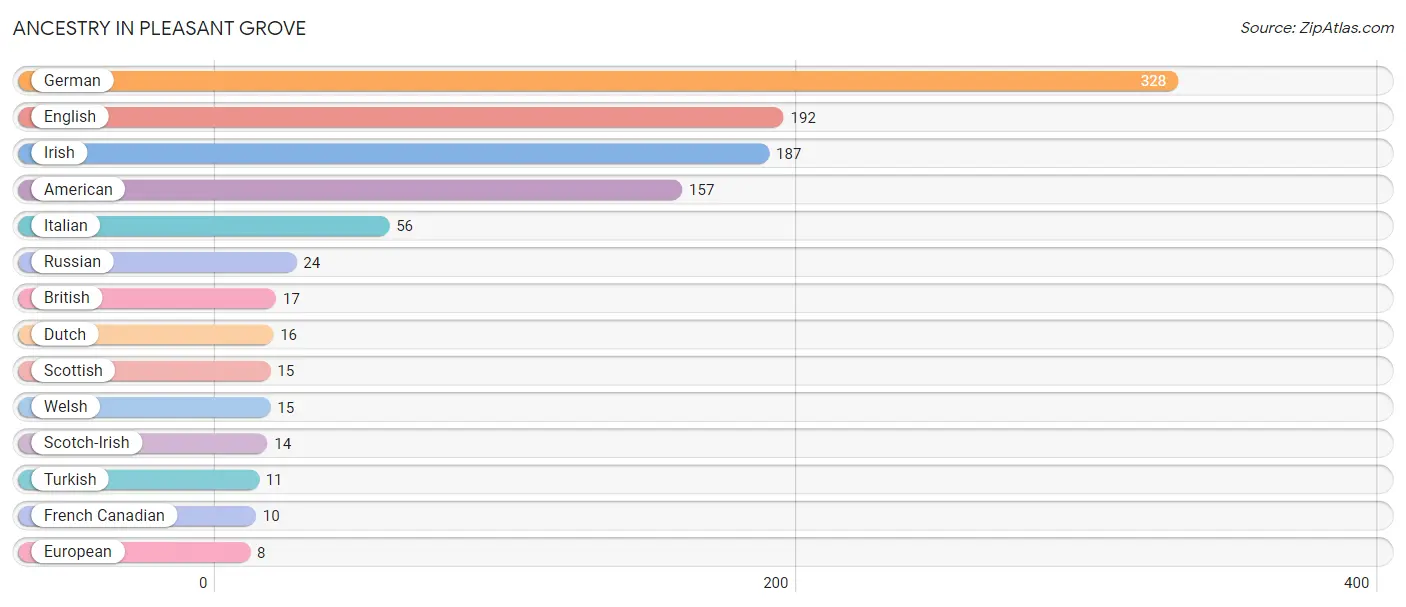
| Ancestry | # Population | % Population |
| American | 157 | 12.0% |
| British | 17 | 1.3% |
| Dutch | 16 | 1.2% |
| English | 192 | 14.7% |
| European | 8 | 0.6% |
| French Canadian | 10 | 0.8% |
| German | 328 | 25.0% |
| Irish | 187 | 14.3% |
| Italian | 56 | 4.3% |
| Russian | 24 | 1.8% |
| Scotch-Irish | 14 | 1.1% |
| Scottish | 15 | 1.1% |
| Turkish | 11 | 0.8% |
| Welsh | 15 | 1.1% | View All 14 Rows |
Immigrants in Pleasant Grove

| Immigration Origin | # Population | % Population | View All 0 Rows |
Sex and Age in Pleasant Grove
Sex and Age in Pleasant Grove
The most populous age groups in Pleasant Grove are 65 to 69 Years (134 | 21.8%) for men and 45 to 49 Years (119 | 17.1%) for women.
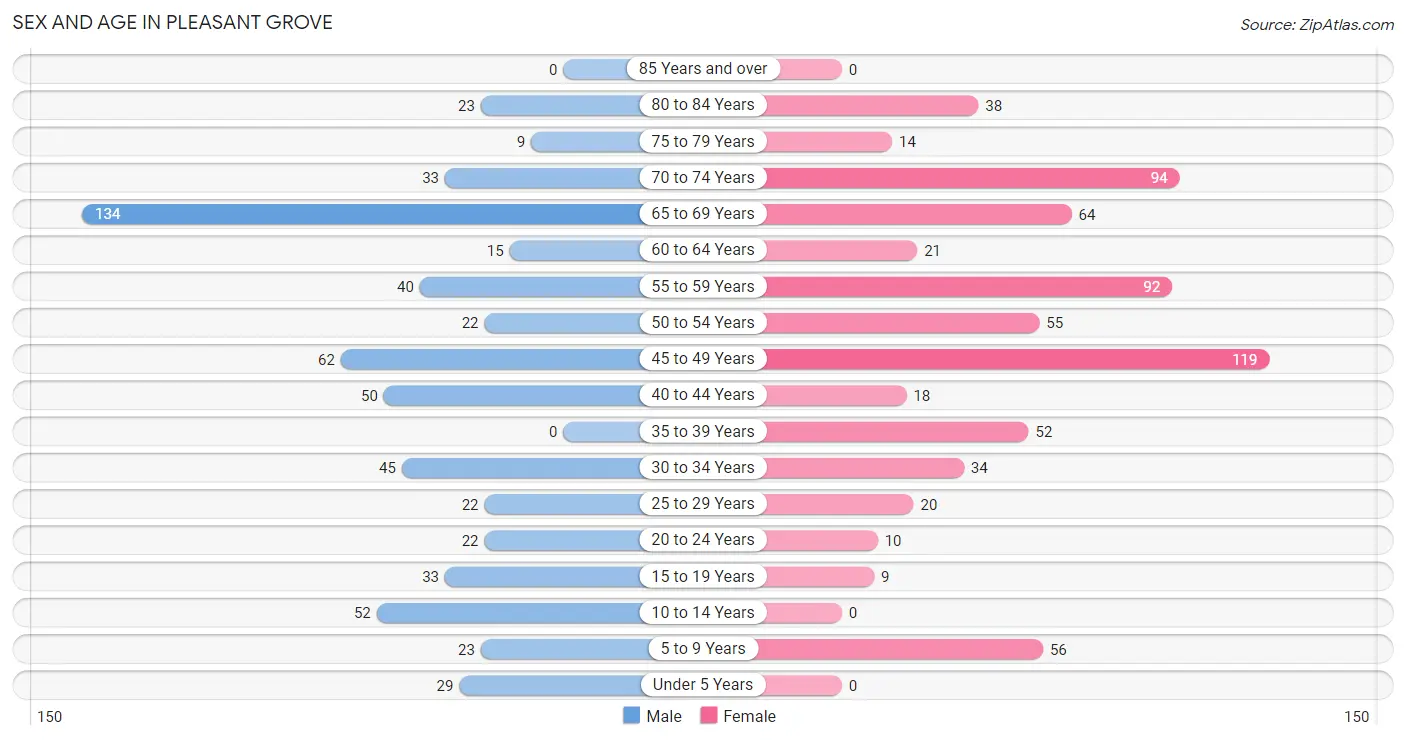
| Age Bracket | Male | Female |
| Under 5 Years | 29 (4.7%) | 0 (0.0%) |
| 5 to 9 Years | 23 (3.7%) | 56 (8.1%) |
| 10 to 14 Years | 52 (8.5%) | 0 (0.0%) |
| 15 to 19 Years | 33 (5.4%) | 9 (1.3%) |
| 20 to 24 Years | 22 (3.6%) | 10 (1.4%) |
| 25 to 29 Years | 22 (3.6%) | 20 (2.9%) |
| 30 to 34 Years | 45 (7.3%) | 34 (4.9%) |
| 35 to 39 Years | 0 (0.0%) | 52 (7.5%) |
| 40 to 44 Years | 50 (8.1%) | 18 (2.6%) |
| 45 to 49 Years | 62 (10.1%) | 119 (17.1%) |
| 50 to 54 Years | 22 (3.6%) | 55 (7.9%) |
| 55 to 59 Years | 40 (6.5%) | 92 (13.2%) |
| 60 to 64 Years | 15 (2.4%) | 21 (3.0%) |
| 65 to 69 Years | 134 (21.8%) | 64 (9.2%) |
| 70 to 74 Years | 33 (5.4%) | 94 (13.5%) |
| 75 to 79 Years | 9 (1.5%) | 14 (2.0%) |
| 80 to 84 Years | 23 (3.7%) | 38 (5.5%) |
| 85 Years and over | 0 (0.0%) | 0 (0.0%) |
| Total | 614 (100.0%) | 696 (100.0%) |
Families and Households in Pleasant Grove
Median Family Size in Pleasant Grove
The median family size in Pleasant Grove is 2.46 persons per family, with single female/mother families (84 | 20.7%) accounting for the largest median family size of 2.61 persons per family. On the other hand, single male/father families (54 | 13.3%) represent the smallest median family size with 2.00 persons per family.
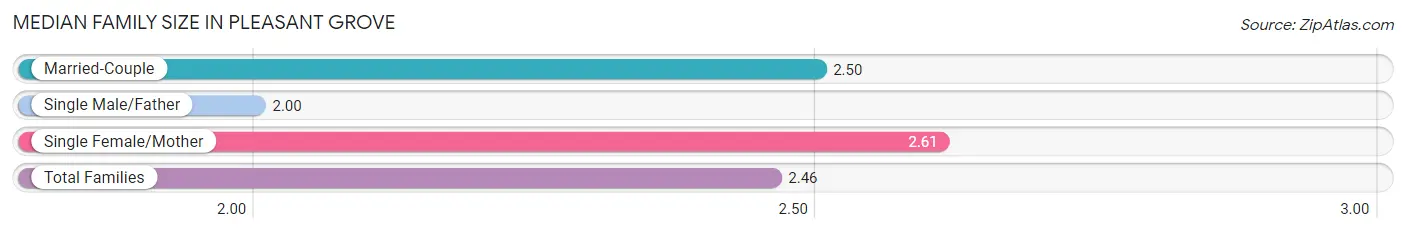
| Family Type | # Families | Family Size |
| Married-Couple | 268 (66.0%) | 2.50 |
| Single Male/Father | 54 (13.3%) | 2.00 |
| Single Female/Mother | 84 (20.7%) | 2.61 |
| Total Families | 406 (100.0%) | 2.46 |
Median Household Size in Pleasant Grove
The median household size in Pleasant Grove is 2.11 persons per household, with single female/mother households (84 | 13.6%) accounting for the largest median household size of 2.61 persons per household. non-family households (213 | 34.4%) represent the smallest median household size with 1.44 persons per household.
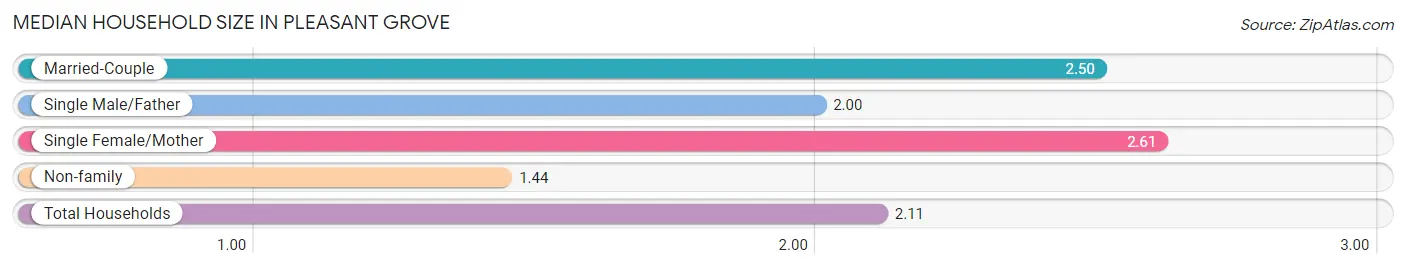
| Household Type | # Households | Household Size |
| Married-Couple | 268 (43.3%) | 2.50 |
| Single Male/Father | 54 (8.7%) | 2.00 |
| Single Female/Mother | 84 (13.6%) | 2.61 |
| Non-family | 213 (34.4%) | 1.44 |
| Total Households | 619 (100.0%) | 2.11 |
Household Size by Marriage Status in Pleasant Grove
Out of a total of 619 households in Pleasant Grove, 406 (65.6%) are family households, while 213 (34.4%) are nonfamily households. The most numerous type of family households are 2-person households, comprising 320, and the most common type of nonfamily households are 1-person households, comprising 141.
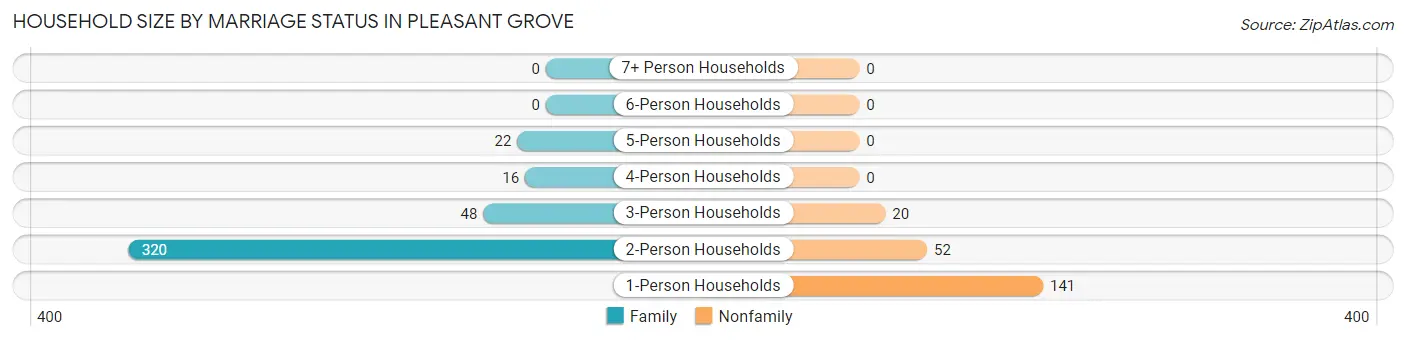
| Household Size | Family Households | Nonfamily Households |
| 1-Person Households | - | 141 (22.8%) |
| 2-Person Households | 320 (51.7%) | 52 (8.4%) |
| 3-Person Households | 48 (7.7%) | 20 (3.2%) |
| 4-Person Households | 16 (2.6%) | 0 (0.0%) |
| 5-Person Households | 22 (3.5%) | 0 (0.0%) |
| 6-Person Households | 0 (0.0%) | 0 (0.0%) |
| 7+ Person Households | 0 (0.0%) | 0 (0.0%) |
| Total | 406 (65.6%) | 213 (34.4%) |
Female Fertility in Pleasant Grove
Fertility by Age in Pleasant Grove
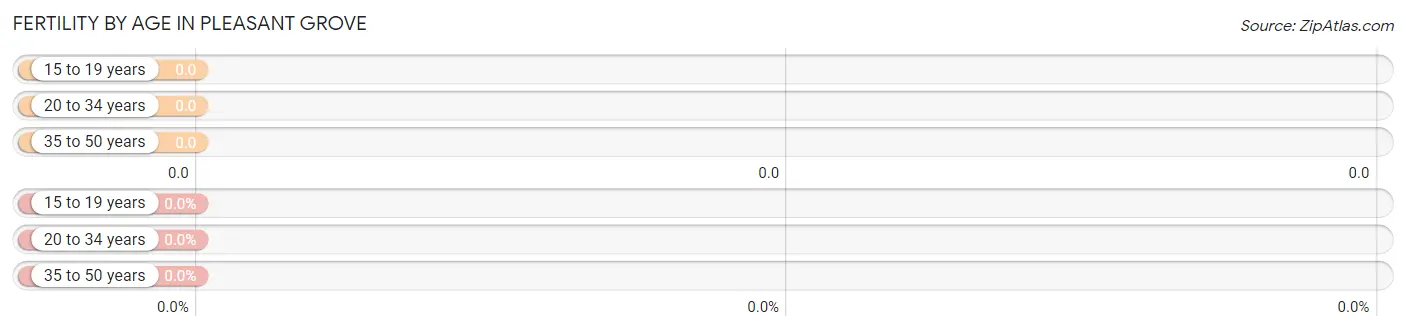
| Age Bracket | Women with Births | Births / 1,000 Women |
| 15 to 19 years | 0 (0.0%) | 0.0 |
| 20 to 34 years | 0 (0.0%) | 0.0 |
| 35 to 50 years | 0 (0.0%) | 0.0 |
| Total | 0 (0.0%) | 0.0 |
Fertility by Age by Marriage Status in Pleasant Grove
| Age Bracket | Married | Unmarried |
| 15 to 19 years | 0 (0.0%) | 0 (0.0%) |
| 20 to 34 years | 0 (0.0%) | 0 (0.0%) |
| 35 to 50 years | 0 (0.0%) | 0 (0.0%) |
| Total | 0 (0.0%) | 0 (0.0%) |
Fertility by Education in Pleasant Grove
| Educational Attainment | Women with Births | Births / 1,000 Women |
| Less than High School | 0 (0.0%) | 0.0 |
| High School Diploma | 0 (0.0%) | 0.0 |
| College or Associate's Degree | 0 (0.0%) | 0.0 |
| Bachelor's Degree | 0 (0.0%) | 0.0 |
| Graduate Degree | 0 (0.0%) | 0.0 |
| Total | 0 (0.0%) | 0.0 |
Fertility by Education by Marriage Status in Pleasant Grove
| Educational Attainment | Married | Unmarried |
| Less than High School | 0 (0.0%) | 0 (0.0%) |
| High School Diploma | 0 (0.0%) | 0 (0.0%) |
| College or Associate's Degree | 0 (0.0%) | 0 (0.0%) |
| Bachelor's Degree | 0 (0.0%) | 0 (0.0%) |
| Graduate Degree | 0 (0.0%) | 0 (0.0%) |
| Total | 0 (0.0%) | 0 (0.0%) |
Employment Characteristics in Pleasant Grove
Employment by Class of Employer in Pleasant Grove
Among the 661 employed individuals in Pleasant Grove, private company employees (454 | 68.7%), local government employees (95 | 14.4%), and not-for-profit organizations (57 | 8.6%) make up the most common classes of employment.
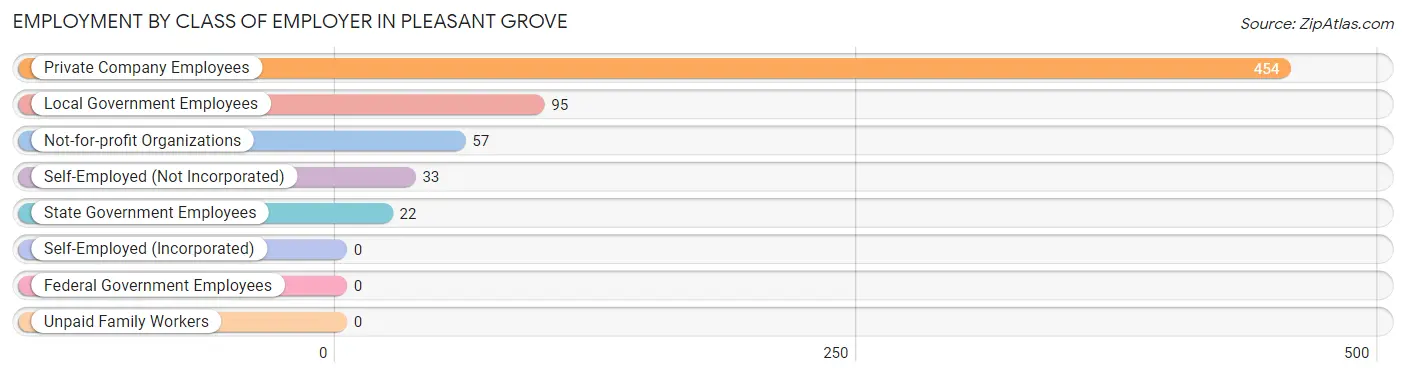
| Employer Class | # Employees | % Employees |
| Private Company Employees | 454 | 68.7% |
| Self-Employed (Incorporated) | 0 | 0.0% |
| Self-Employed (Not Incorporated) | 33 | 5.0% |
| Not-for-profit Organizations | 57 | 8.6% |
| Local Government Employees | 95 | 14.4% |
| State Government Employees | 22 | 3.3% |
| Federal Government Employees | 0 | 0.0% |
| Unpaid Family Workers | 0 | 0.0% |
| Total | 661 | 100.0% |
Employment Status by Age in Pleasant Grove
According to the labor force statistics for Pleasant Grove, out of the total population over 16 years of age (1,141), 62.8% or 717 individuals are in the labor force, with 2.2% or 16 of them unemployed. The age group with the highest labor force participation rate is 20 to 24 years, with 100.0% or 32 individuals in the labor force. Within the labor force, the 45 to 54 years age range has the highest percentage of unemployed individuals, with 6.6% or 16 of them being unemployed.
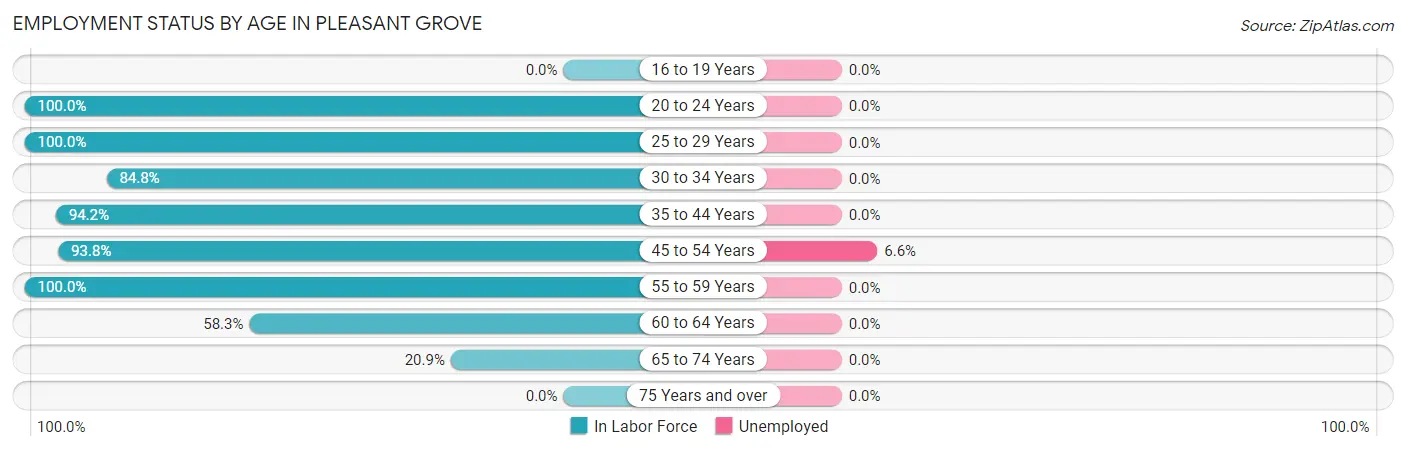
| Age Bracket | In Labor Force | Unemployed |
| 16 to 19 Years | 0 (0.0%) | 0 (0.0%) |
| 20 to 24 Years | 32 (100.0%) | 0 (0.0%) |
| 25 to 29 Years | 42 (100.0%) | 0 (0.0%) |
| 30 to 34 Years | 67 (84.8%) | 0 (0.0%) |
| 35 to 44 Years | 113 (94.2%) | 0 (0.0%) |
| 45 to 54 Years | 242 (93.8%) | 16 (6.6%) |
| 55 to 59 Years | 132 (100.0%) | 0 (0.0%) |
| 60 to 64 Years | 21 (58.3%) | 0 (0.0%) |
| 65 to 74 Years | 68 (20.9%) | 0 (0.0%) |
| 75 Years and over | 0 (0.0%) | 0 (0.0%) |
| Total | 717 (62.8%) | 16 (2.2%) |
Employment Status by Educational Attainment in Pleasant Grove
According to labor force statistics for Pleasant Grove, 92.5% of individuals (617) out of the total population between 25 and 64 years of age (667) are in the labor force, with 2.6% or 16 of them being unemployed. The group with the highest labor force participation rate are those with the educational attainment of bachelor's degree or higher, with 100.0% or 190 individuals in the labor force. Within the labor force, individuals with high school diploma education have the highest percentage of unemployment, with 6.6% or 16 of them being unemployed.
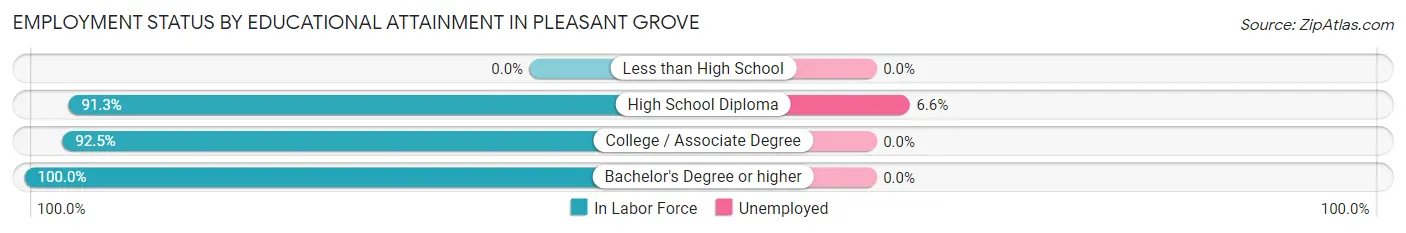
| Educational Attainment | In Labor Force | Unemployed |
| Less than High School | 0 (0.0%) | 0 (0.0%) |
| High School Diploma | 242 (91.3%) | 17 (6.6%) |
| College / Associate Degree | 185 (92.5%) | 0 (0.0%) |
| Bachelor's Degree or higher | 190 (100.0%) | 0 (0.0%) |
| Total | 617 (92.5%) | 17 (2.6%) |
Employment Occupations by Sex in Pleasant Grove
Management, Business, Science and Arts Occupations
The most common Management, Business, Science and Arts occupations in Pleasant Grove are Business & Financial (85 | 12.1%), Management (83 | 11.8%), Health Diagnosing & Treating (59 | 8.4%), Health Technologists (59 | 8.4%), and Computers, Engineering & Science (17 | 2.4%).
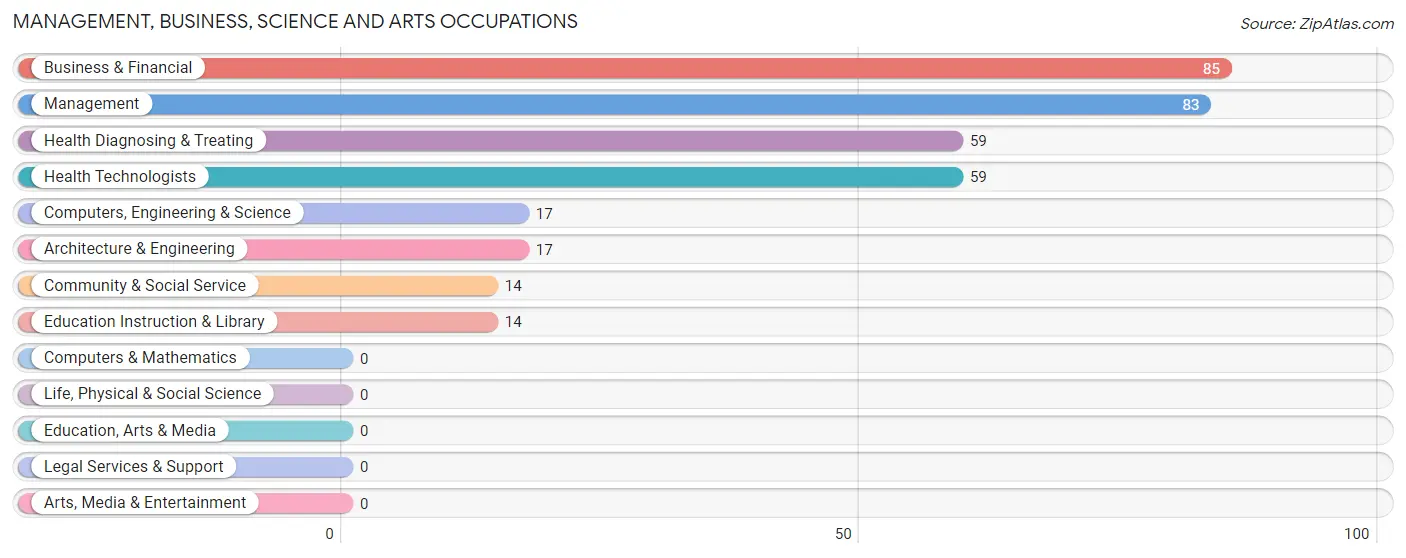
Management, Business, Science and Arts Occupations by Sex
Within the Management, Business, Science and Arts occupations in Pleasant Grove, the most male-oriented occupations are Computers, Engineering & Science (100.0%), Architecture & Engineering (100.0%), and Health Diagnosing & Treating (57.6%), while the most female-oriented occupations are Community & Social Service (100.0%), Education Instruction & Library (100.0%), and Management (69.9%).
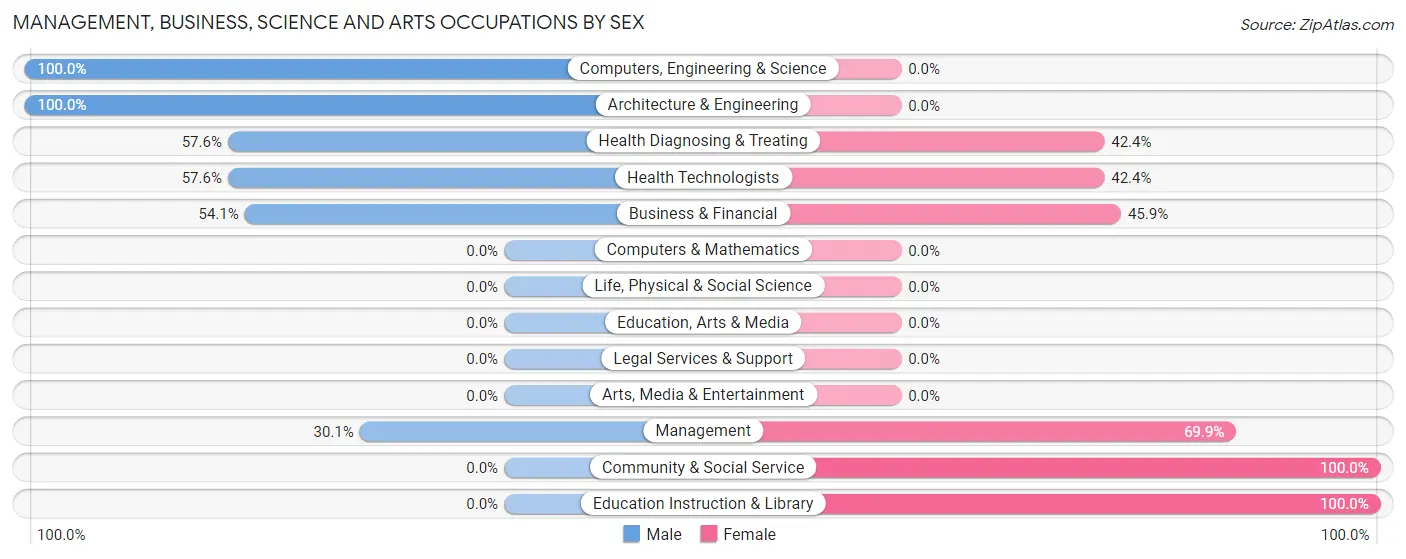
| Occupation | Male | Female |
| Management | 25 (30.1%) | 58 (69.9%) |
| Business & Financial | 46 (54.1%) | 39 (45.9%) |
| Computers, Engineering & Science | 17 (100.0%) | 0 (0.0%) |
| Computers & Mathematics | 0 (0.0%) | 0 (0.0%) |
| Architecture & Engineering | 17 (100.0%) | 0 (0.0%) |
| Life, Physical & Social Science | 0 (0.0%) | 0 (0.0%) |
| Community & Social Service | 0 (0.0%) | 14 (100.0%) |
| Education, Arts & Media | 0 (0.0%) | 0 (0.0%) |
| Legal Services & Support | 0 (0.0%) | 0 (0.0%) |
| Education Instruction & Library | 0 (0.0%) | 14 (100.0%) |
| Arts, Media & Entertainment | 0 (0.0%) | 0 (0.0%) |
| Health Diagnosing & Treating | 34 (57.6%) | 25 (42.4%) |
| Health Technologists | 34 (57.6%) | 25 (42.4%) |
| Total (Category) | 122 (47.3%) | 136 (52.7%) |
| Total (Overall) | 293 (41.8%) | 408 (58.2%) |
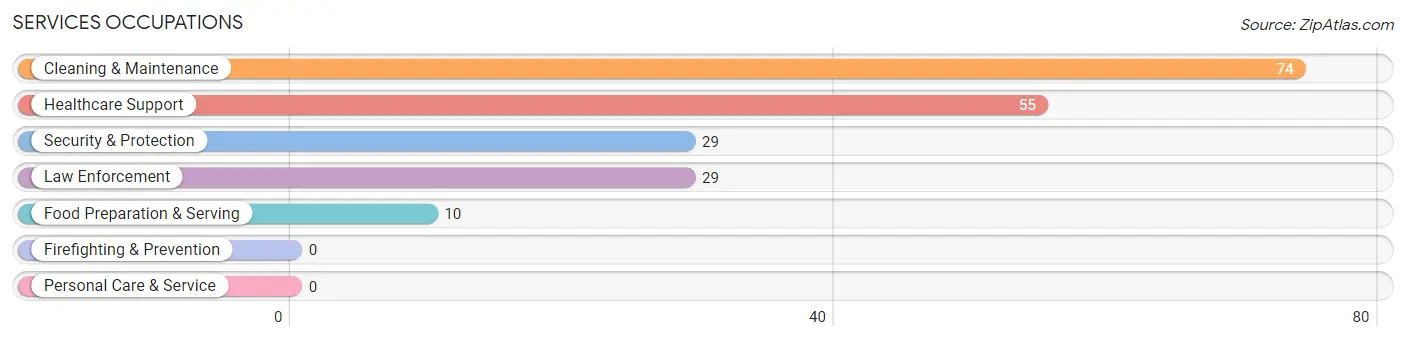
Services Occupations
The most common Services occupations in Pleasant Grove are Cleaning & Maintenance (74 | 10.6%), Healthcare Support (55 | 7.9%), Security & Protection (29 | 4.1%), Law Enforcement (29 | 4.1%), and Food Preparation & Serving (10 | 1.4%).
Services Occupations by Sex
Within the Services occupations in Pleasant Grove, the most male-oriented occupations are Security & Protection (44.8%), Law Enforcement (44.8%), and Cleaning & Maintenance (14.9%), while the most female-oriented occupations are Healthcare Support (100.0%), Food Preparation & Serving (100.0%), and Cleaning & Maintenance (85.1%).
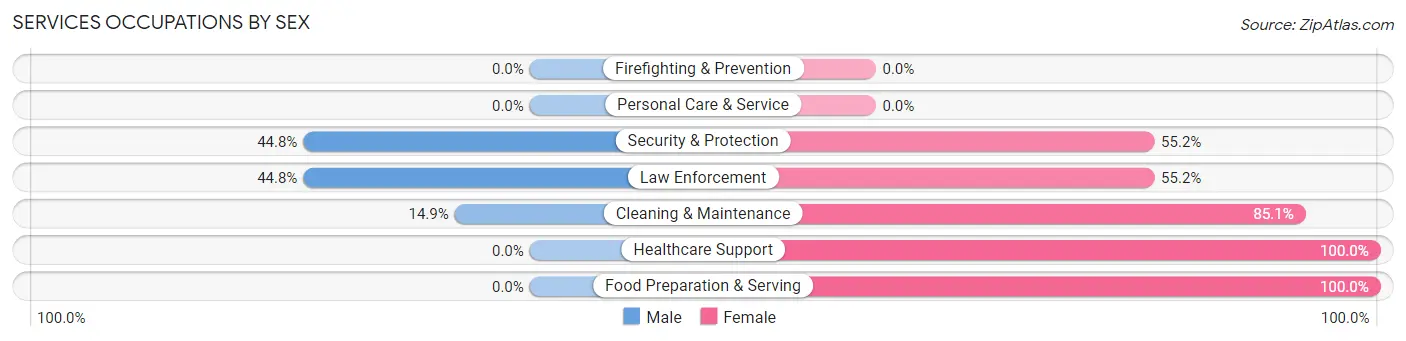
| Occupation | Male | Female |
| Healthcare Support | 0 (0.0%) | 55 (100.0%) |
| Security & Protection | 13 (44.8%) | 16 (55.2%) |
| Firefighting & Prevention | 0 (0.0%) | 0 (0.0%) |
| Law Enforcement | 13 (44.8%) | 16 (55.2%) |
| Food Preparation & Serving | 0 (0.0%) | 10 (100.0%) |
| Cleaning & Maintenance | 11 (14.9%) | 63 (85.1%) |
| Personal Care & Service | 0 (0.0%) | 0 (0.0%) |
| Total (Category) | 24 (14.3%) | 144 (85.7%) |
| Total (Overall) | 293 (41.8%) | 408 (58.2%) |
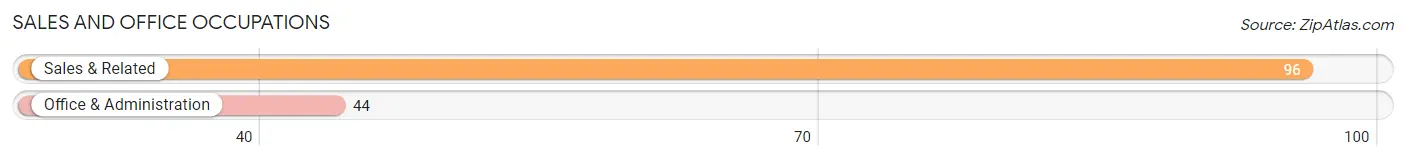
Sales and Office Occupations
The most common Sales and Office occupations in Pleasant Grove are Sales & Related (96 | 13.7%), and Office & Administration (44 | 6.3%).
Sales and Office Occupations by Sex
| Occupation | Male | Female |
| Sales & Related | 27 (28.1%) | 69 (71.9%) |
| Office & Administration | 10 (22.7%) | 34 (77.3%) |
| Total (Category) | 37 (26.4%) | 103 (73.6%) |
| Total (Overall) | 293 (41.8%) | 408 (58.2%) |
Natural Resources, Construction and Maintenance Occupations
The most common Natural Resources, Construction and Maintenance occupations in Pleasant Grove are , and Installation, Maintenance & Repair (23 | 3.3%).
Natural Resources, Construction and Maintenance Occupations by Sex
| Occupation | Male | Female |
| Farming, Fishing & Forestry | 0 (0.0%) | 0 (0.0%) |
| Construction & Extraction | 0 (0.0%) | 0 (0.0%) |
| Installation, Maintenance & Repair | 23 (100.0%) | 0 (0.0%) |
| Total (Category) | 23 (100.0%) | 0 (0.0%) |
| Total (Overall) | 293 (41.8%) | 408 (58.2%) |
Production, Transportation and Moving Occupations
The most common Production, Transportation and Moving occupations in Pleasant Grove are Material Moving (68 | 9.7%), and Production (44 | 6.3%).
Production, Transportation and Moving Occupations by Sex
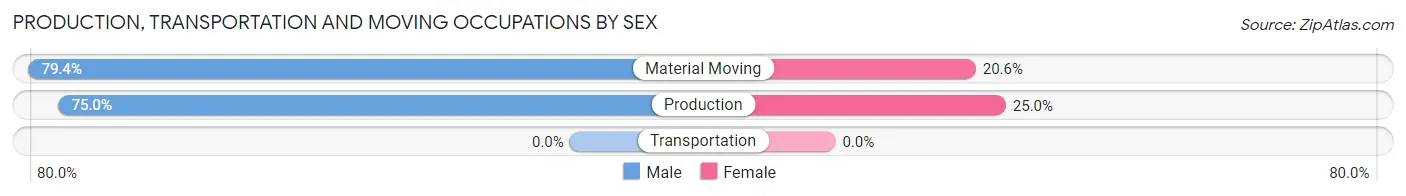
| Occupation | Male | Female |
| Production | 33 (75.0%) | 11 (25.0%) |
| Transportation | 0 (0.0%) | 0 (0.0%) |
| Material Moving | 54 (79.4%) | 14 (20.6%) |
| Total (Category) | 87 (77.7%) | 25 (22.3%) |
| Total (Overall) | 293 (41.8%) | 408 (58.2%) |
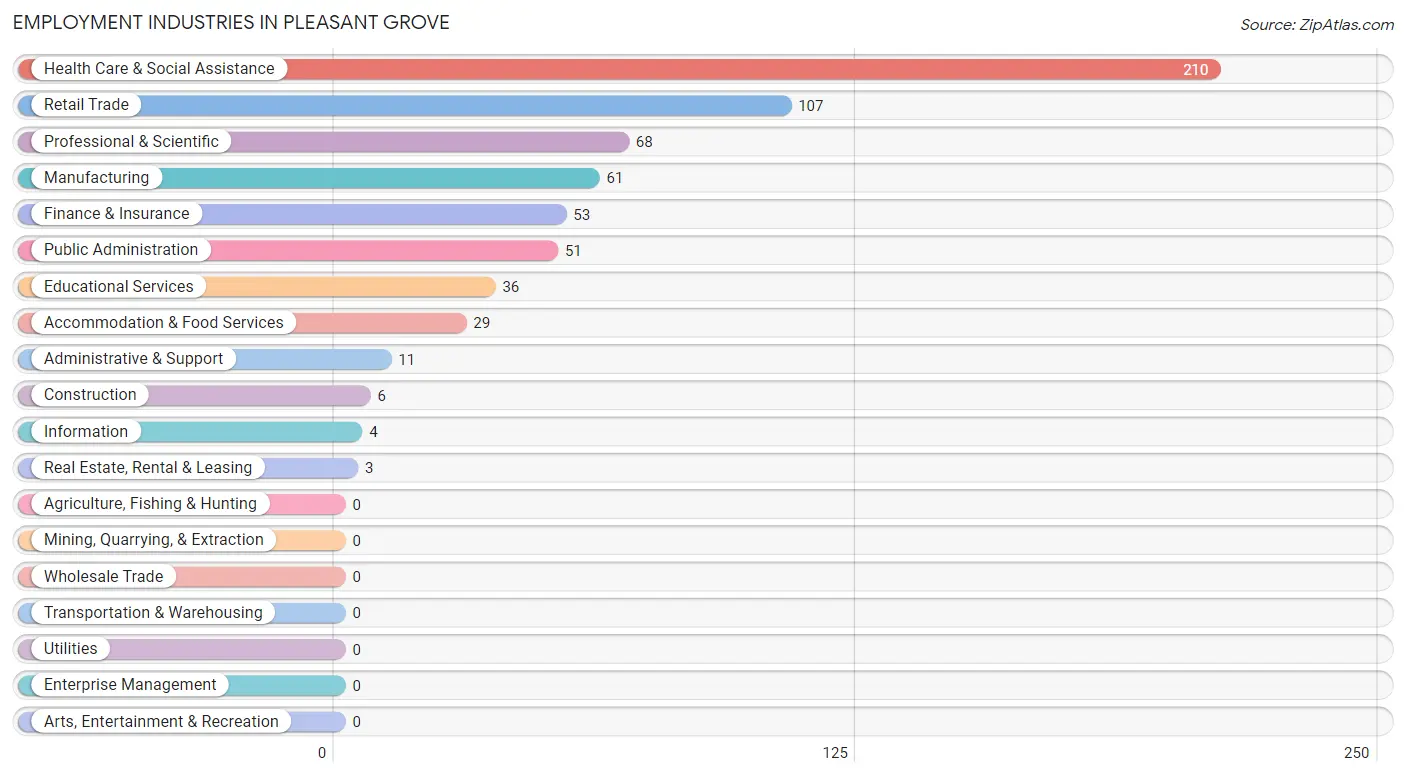
Employment Industries by Sex in Pleasant Grove
Employment Industries in Pleasant Grove
The major employment industries in Pleasant Grove include Health Care & Social Assistance (210 | 30.0%), Retail Trade (107 | 15.3%), Professional & Scientific (68 | 9.7%), Manufacturing (61 | 8.7%), and Finance & Insurance (53 | 7.6%).
Employment Industries by Sex in Pleasant Grove
The Pleasant Grove industries that see more men than women are Construction (100.0%), Real Estate, Rental & Leasing (100.0%), and Administrative & Support (100.0%), whereas the industries that tend to have a higher number of women are Information (100.0%), Retail Trade (77.6%), and Health Care & Social Assistance (75.7%).
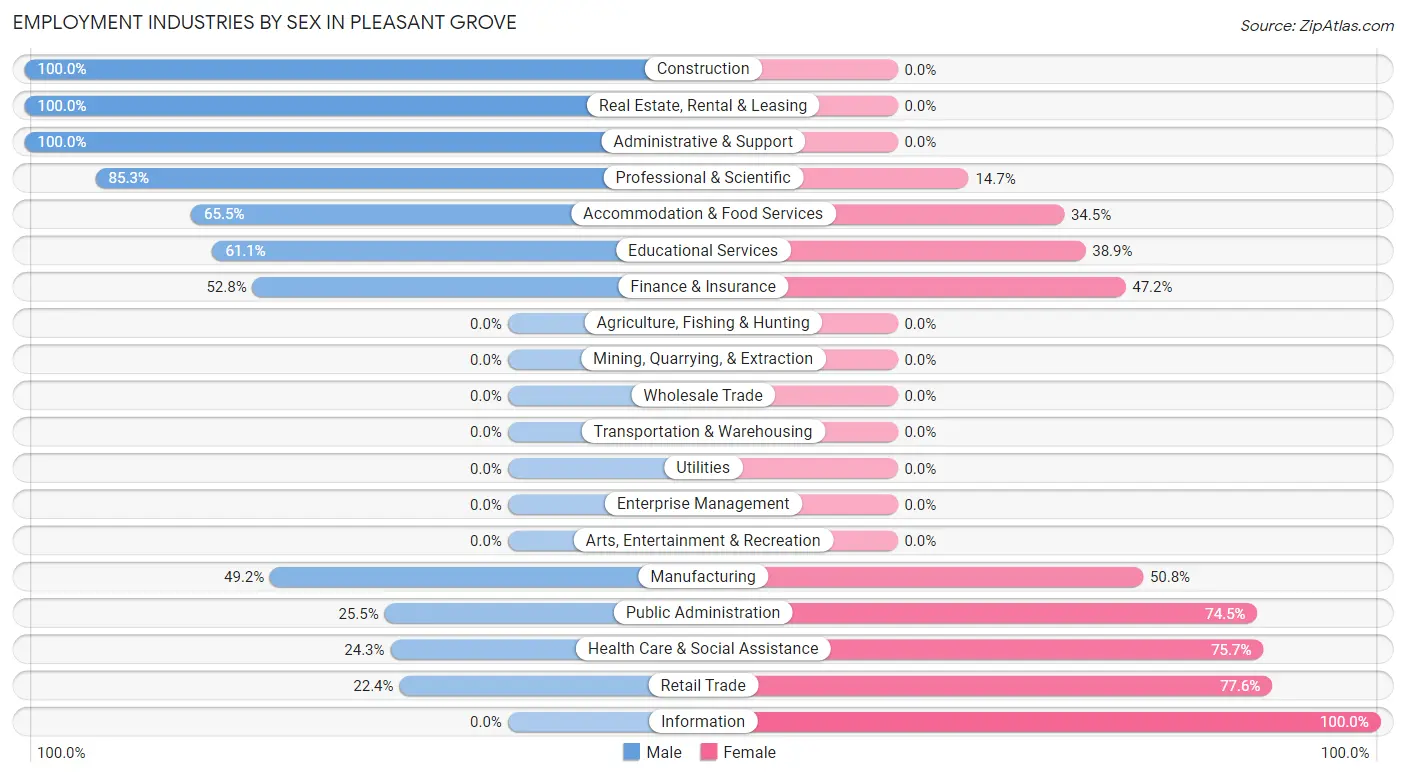
| Industry | Male | Female |
| Agriculture, Fishing & Hunting | 0 (0.0%) | 0 (0.0%) |
| Mining, Quarrying, & Extraction | 0 (0.0%) | 0 (0.0%) |
| Construction | 6 (100.0%) | 0 (0.0%) |
| Manufacturing | 30 (49.2%) | 31 (50.8%) |
| Wholesale Trade | 0 (0.0%) | 0 (0.0%) |
| Retail Trade | 24 (22.4%) | 83 (77.6%) |
| Transportation & Warehousing | 0 (0.0%) | 0 (0.0%) |
| Utilities | 0 (0.0%) | 0 (0.0%) |
| Information | 0 (0.0%) | 4 (100.0%) |
| Finance & Insurance | 28 (52.8%) | 25 (47.2%) |
| Real Estate, Rental & Leasing | 3 (100.0%) | 0 (0.0%) |
| Professional & Scientific | 58 (85.3%) | 10 (14.7%) |
| Enterprise Management | 0 (0.0%) | 0 (0.0%) |
| Administrative & Support | 11 (100.0%) | 0 (0.0%) |
| Educational Services | 22 (61.1%) | 14 (38.9%) |
| Health Care & Social Assistance | 51 (24.3%) | 159 (75.7%) |
| Arts, Entertainment & Recreation | 0 (0.0%) | 0 (0.0%) |
| Accommodation & Food Services | 19 (65.5%) | 10 (34.5%) |
| Public Administration | 13 (25.5%) | 38 (74.5%) |
| Total | 293 (41.8%) | 408 (58.2%) |
Education in Pleasant Grove
School Enrollment in Pleasant Grove
The most common levels of schooling among the 190 students in Pleasant Grove are middle school (108 | 56.8%), nursery / preschool (33 | 17.4%), and college / undergraduate (26 | 13.7%).
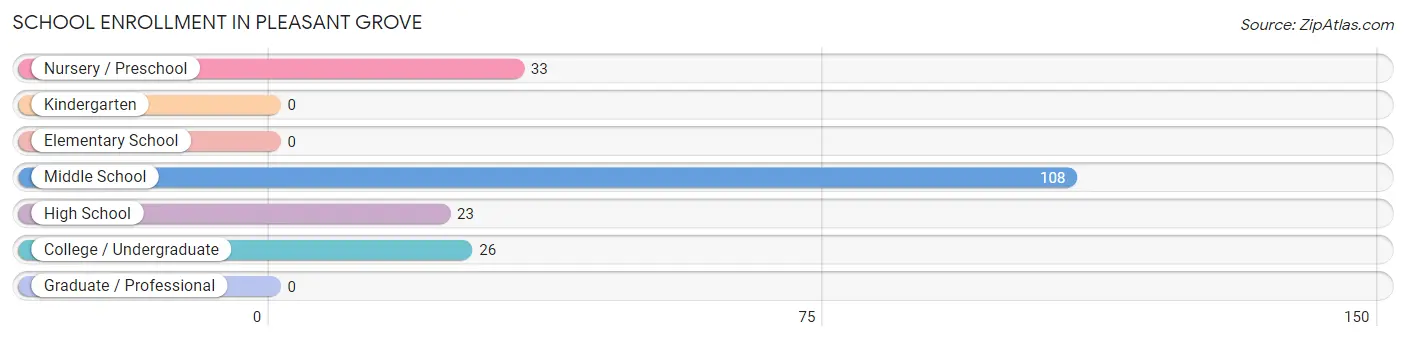
| School Level | # Students | % Students |
| Nursery / Preschool | 33 | 17.4% |
| Kindergarten | 0 | 0.0% |
| Elementary School | 0 | 0.0% |
| Middle School | 108 | 56.8% |
| High School | 23 | 12.1% |
| College / Undergraduate | 26 | 13.7% |
| Graduate / Professional | 0 | 0.0% |
| Total | 190 | 100.0% |
School Enrollment by Age by Funding Source in Pleasant Grove
Out of a total of 190 students who are enrolled in schools in Pleasant Grove, 8 (4.2%) attend a private institution, while the remaining 182 (95.8%) are enrolled in public schools. The age group of 5 to 9 year old has the highest likelihood of being enrolled in private schools, with 8 (10.1% in the age bracket) enrolled. Conversely, the age group of 3 to 4 year olds has the lowest likelihood of being enrolled in a private school, with 10 (100.0% in the age bracket) attending a public institution.
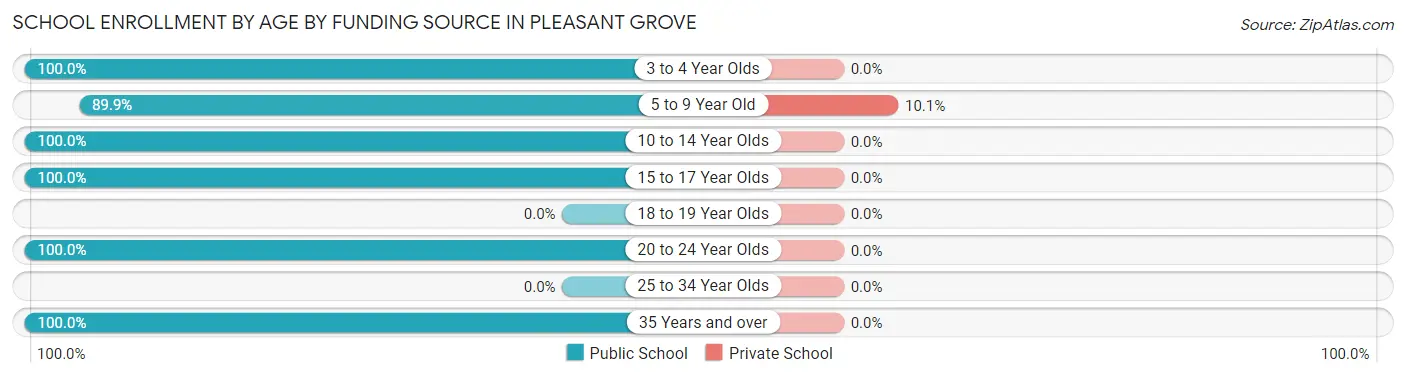
| Age Bracket | Public School | Private School |
| 3 to 4 Year Olds | 10 (100.0%) | 0 (0.0%) |
| 5 to 9 Year Old | 71 (89.9%) | 8 (10.1%) |
| 10 to 14 Year Olds | 52 (100.0%) | 0 (0.0%) |
| 15 to 17 Year Olds | 23 (100.0%) | 0 (0.0%) |
| 18 to 19 Year Olds | 0 (0.0%) | 0 (0.0%) |
| 20 to 24 Year Olds | 10 (100.0%) | 0 (0.0%) |
| 25 to 34 Year Olds | 0 (0.0%) | 0 (0.0%) |
| 35 Years and over | 16 (100.0%) | 0 (0.0%) |
| Total | 182 (95.8%) | 8 (4.2%) |
Educational Attainment by Field of Study in Pleasant Grove
Science & technology (81 | 37.2%), business (60 | 27.5%), education (24 | 11.0%), bio, nature & agricultural (22 | 10.1%), and arts & humanities (16 | 7.3%) are the most common fields of study among 218 individuals in Pleasant Grove who have obtained a bachelor's degree or higher.
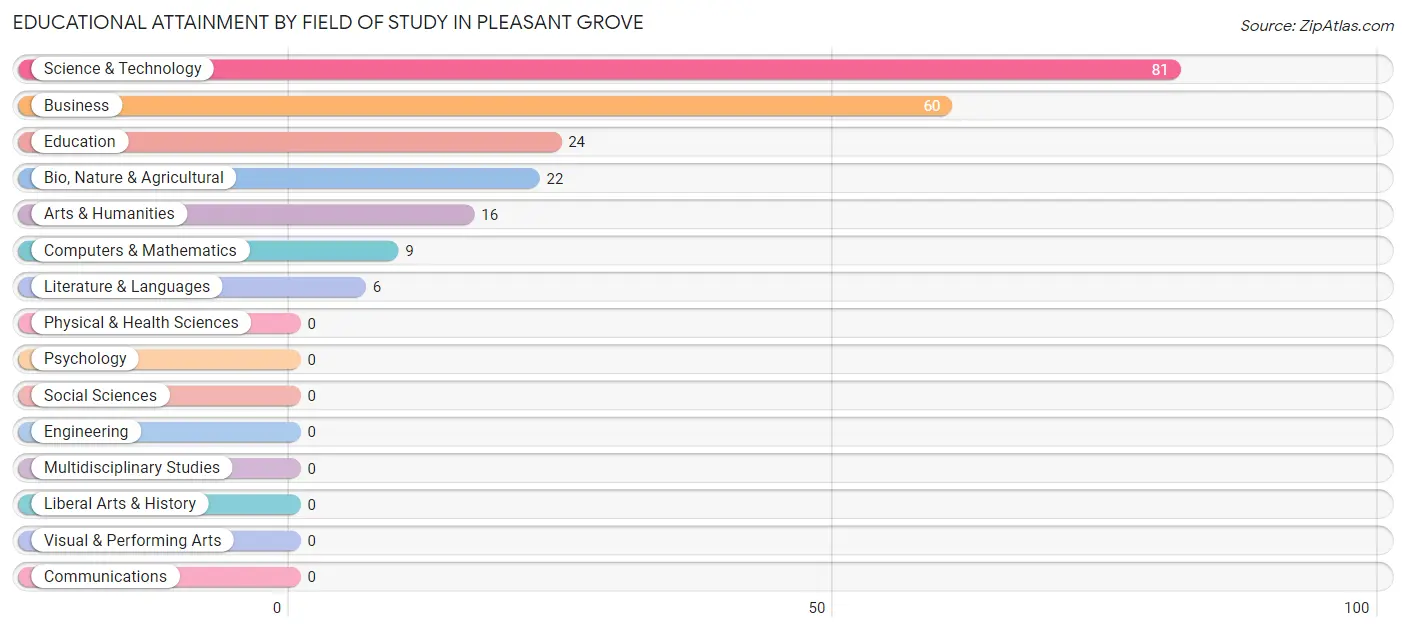
| Field of Study | # Graduates | % Graduates |
| Computers & Mathematics | 9 | 4.1% |
| Bio, Nature & Agricultural | 22 | 10.1% |
| Physical & Health Sciences | 0 | 0.0% |
| Psychology | 0 | 0.0% |
| Social Sciences | 0 | 0.0% |
| Engineering | 0 | 0.0% |
| Multidisciplinary Studies | 0 | 0.0% |
| Science & Technology | 81 | 37.2% |
| Business | 60 | 27.5% |
| Education | 24 | 11.0% |
| Literature & Languages | 6 | 2.8% |
| Liberal Arts & History | 0 | 0.0% |
| Visual & Performing Arts | 0 | 0.0% |
| Communications | 0 | 0.0% |
| Arts & Humanities | 16 | 7.3% |
| Total | 218 | 100.0% |
Transportation & Commute in Pleasant Grove
Vehicle Availability by Sex in Pleasant Grove
The most prevalent vehicle ownership categories in Pleasant Grove are males with 3 vehicles (119, accounting for 40.6%) and females with 3 vehicles (129, making up 32.3%).
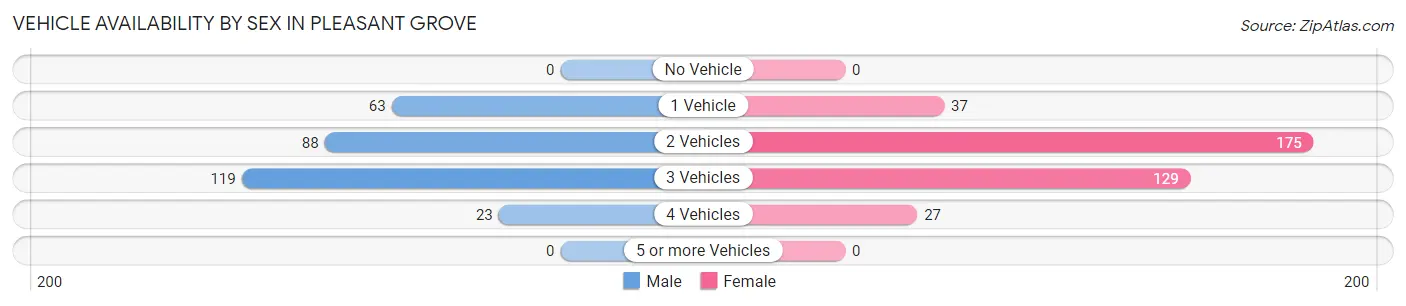
| Vehicles Available | Male | Female |
| No Vehicle | 0 (0.0%) | 0 (0.0%) |
| 1 Vehicle | 63 (21.5%) | 37 (10.1%) |
| 2 Vehicles | 88 (30.0%) | 175 (47.5%) |
| 3 Vehicles | 119 (40.6%) | 129 (35.0%) |
| 4 Vehicles | 23 (7.9%) | 27 (7.3%) |
| 5 or more Vehicles | 0 (0.0%) | 0 (0.0%) |
| Total | 293 (100.0%) | 368 (100.0%) |
Commute Time in Pleasant Grove
The most frequently occuring commute durations in Pleasant Grove are 10 to 14 minutes (170 commuters, 27.4%), 15 to 19 minutes (85 commuters, 13.7%), and 20 to 24 minutes (70 commuters, 11.3%).
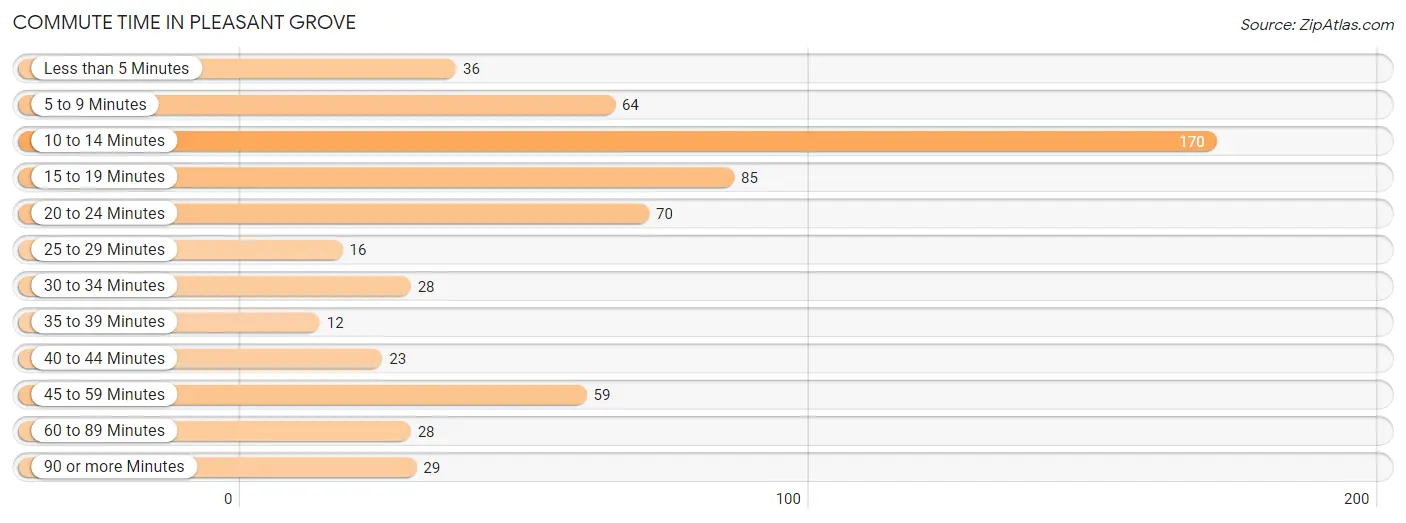
| Commute Time | # Commuters | % Commuters |
| Less than 5 Minutes | 36 | 5.8% |
| 5 to 9 Minutes | 64 | 10.3% |
| 10 to 14 Minutes | 170 | 27.4% |
| 15 to 19 Minutes | 85 | 13.7% |
| 20 to 24 Minutes | 70 | 11.3% |
| 25 to 29 Minutes | 16 | 2.6% |
| 30 to 34 Minutes | 28 | 4.5% |
| 35 to 39 Minutes | 12 | 1.9% |
| 40 to 44 Minutes | 23 | 3.7% |
| 45 to 59 Minutes | 59 | 9.5% |
| 60 to 89 Minutes | 28 | 4.5% |
| 90 or more Minutes | 29 | 4.7% |
Commute Time by Sex in Pleasant Grove
The most common commute times in Pleasant Grove are 10 to 14 minutes (87 commuters, 31.5%) for males and 10 to 14 minutes (83 commuters, 24.1%) for females.
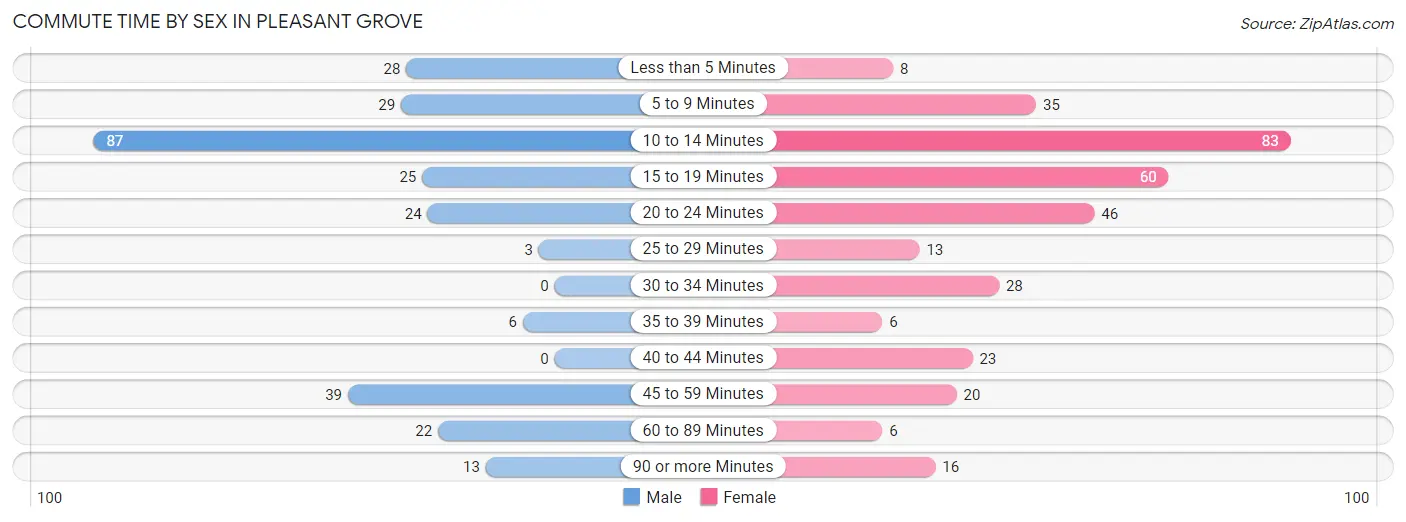
| Commute Time | Male | Female |
| Less than 5 Minutes | 28 (10.1%) | 8 (2.3%) |
| 5 to 9 Minutes | 29 (10.5%) | 35 (10.2%) |
| 10 to 14 Minutes | 87 (31.5%) | 83 (24.1%) |
| 15 to 19 Minutes | 25 (9.1%) | 60 (17.4%) |
| 20 to 24 Minutes | 24 (8.7%) | 46 (13.4%) |
| 25 to 29 Minutes | 3 (1.1%) | 13 (3.8%) |
| 30 to 34 Minutes | 0 (0.0%) | 28 (8.1%) |
| 35 to 39 Minutes | 6 (2.2%) | 6 (1.7%) |
| 40 to 44 Minutes | 0 (0.0%) | 23 (6.7%) |
| 45 to 59 Minutes | 39 (14.1%) | 20 (5.8%) |
| 60 to 89 Minutes | 22 (8.0%) | 6 (1.7%) |
| 90 or more Minutes | 13 (4.7%) | 16 (4.6%) |
Time of Departure to Work by Sex in Pleasant Grove
The most frequent times of departure to work in Pleasant Grove are 4:00 PM to 11:59 PM (75, 27.2%) for males and 8:00 AM to 8:29 AM (66, 19.2%) for females.
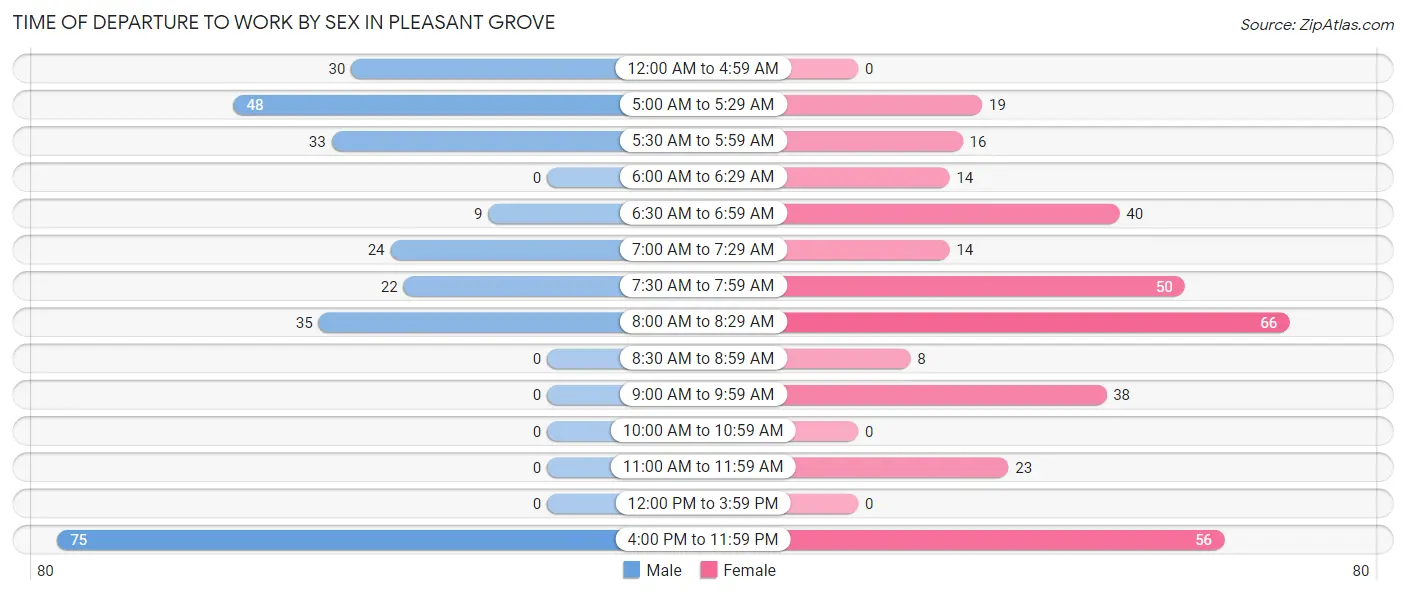
| Time of Departure | Male | Female |
| 12:00 AM to 4:59 AM | 30 (10.9%) | 0 (0.0%) |
| 5:00 AM to 5:29 AM | 48 (17.4%) | 19 (5.5%) |
| 5:30 AM to 5:59 AM | 33 (12.0%) | 16 (4.6%) |
| 6:00 AM to 6:29 AM | 0 (0.0%) | 14 (4.1%) |
| 6:30 AM to 6:59 AM | 9 (3.3%) | 40 (11.6%) |
| 7:00 AM to 7:29 AM | 24 (8.7%) | 14 (4.1%) |
| 7:30 AM to 7:59 AM | 22 (8.0%) | 50 (14.5%) |
| 8:00 AM to 8:29 AM | 35 (12.7%) | 66 (19.2%) |
| 8:30 AM to 8:59 AM | 0 (0.0%) | 8 (2.3%) |
| 9:00 AM to 9:59 AM | 0 (0.0%) | 38 (11.1%) |
| 10:00 AM to 10:59 AM | 0 (0.0%) | 0 (0.0%) |
| 11:00 AM to 11:59 AM | 0 (0.0%) | 23 (6.7%) |
| 12:00 PM to 3:59 PM | 0 (0.0%) | 0 (0.0%) |
| 4:00 PM to 11:59 PM | 75 (27.2%) | 56 (16.3%) |
| Total | 276 (100.0%) | 344 (100.0%) |
Housing Occupancy in Pleasant Grove
Occupancy by Ownership in Pleasant Grove
Of the total 619 dwellings in Pleasant Grove, owner-occupied units account for 463 (74.8%), while renter-occupied units make up 156 (25.2%).
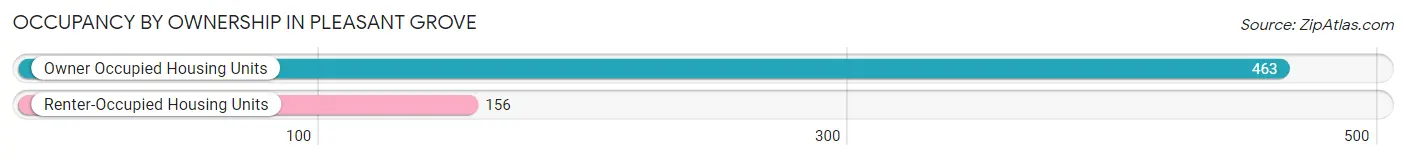
| Occupancy | # Housing Units | % Housing Units |
| Owner Occupied Housing Units | 463 | 74.8% |
| Renter-Occupied Housing Units | 156 | 25.2% |
| Total Occupied Housing Units | 619 | 100.0% |
Occupancy by Household Size in Pleasant Grove
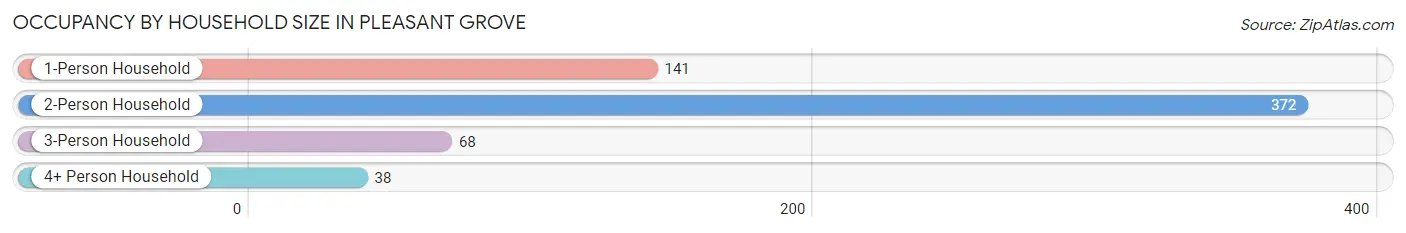
| Household Size | # Housing Units | % Housing Units |
| 1-Person Household | 141 | 22.8% |
| 2-Person Household | 372 | 60.1% |
| 3-Person Household | 68 | 11.0% |
| 4+ Person Household | 38 | 6.1% |
| Total Housing Units | 619 | 100.0% |
Occupancy by Ownership by Household Size in Pleasant Grove
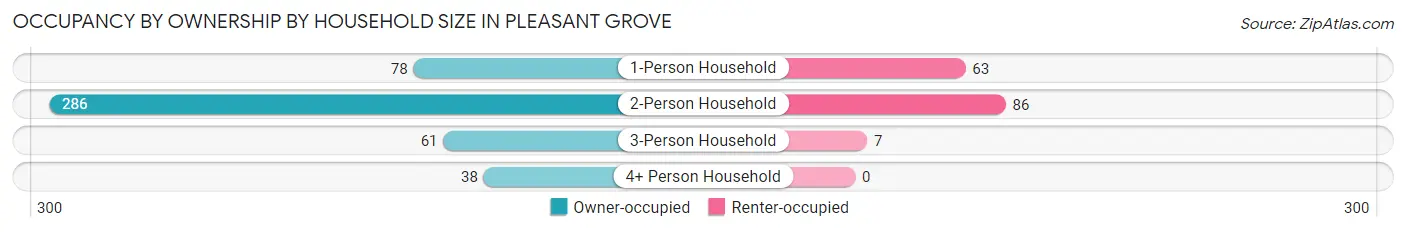
| Household Size | Owner-occupied | Renter-occupied |
| 1-Person Household | 78 (55.3%) | 63 (44.7%) |
| 2-Person Household | 286 (76.9%) | 86 (23.1%) |
| 3-Person Household | 61 (89.7%) | 7 (10.3%) |
| 4+ Person Household | 38 (100.0%) | 0 (0.0%) |
| Total Housing Units | 463 (74.8%) | 156 (25.2%) |
Occupancy by Educational Attainment in Pleasant Grove
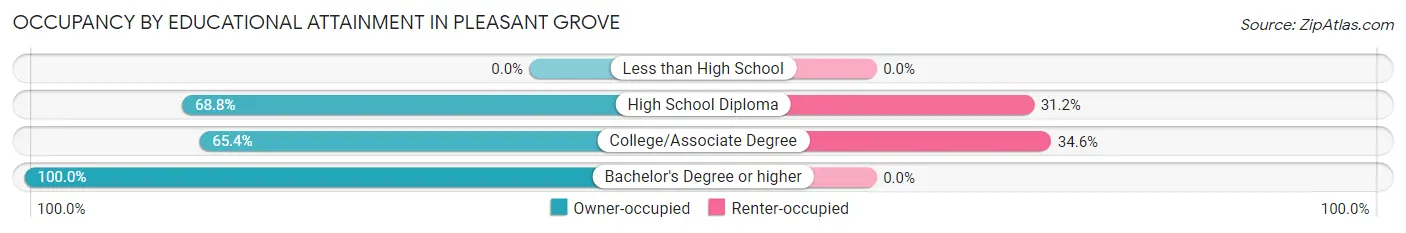
| Household Size | Owner-occupied | Renter-occupied |
| Less than High School | 0 (0.0%) | 0 (0.0%) |
| High School Diploma | 207 (68.8%) | 94 (31.2%) |
| College/Associate Degree | 117 (65.4%) | 62 (34.6%) |
| Bachelor's Degree or higher | 139 (100.0%) | 0 (0.0%) |
Occupancy by Age of Householder in Pleasant Grove
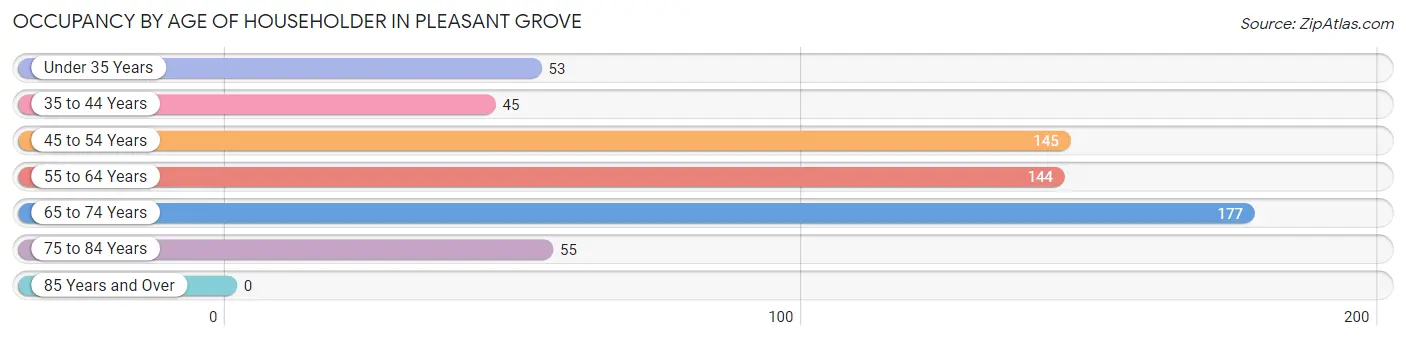
| Age Bracket | # Households | % Households |
| Under 35 Years | 53 | 8.6% |
| 35 to 44 Years | 45 | 7.3% |
| 45 to 54 Years | 145 | 23.4% |
| 55 to 64 Years | 144 | 23.3% |
| 65 to 74 Years | 177 | 28.6% |
| 75 to 84 Years | 55 | 8.9% |
| 85 Years and Over | 0 | 0.0% |
| Total | 619 | 100.0% |
Housing Finances in Pleasant Grove
Median Income by Occupancy in Pleasant Grove
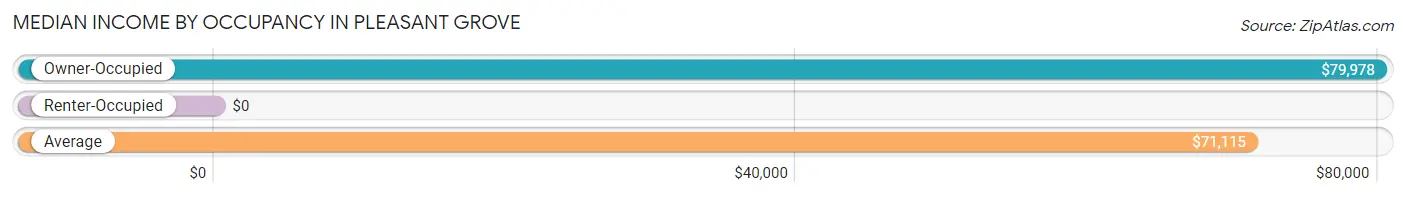
| Occupancy Type | # Households | Median Income |
| Owner-Occupied | 463 (74.8%) | $79,978 |
| Renter-Occupied | 156 (25.2%) | $0 |
| Average | 619 (100.0%) | $71,115 |
Occupancy by Householder Income Bracket in Pleasant Grove
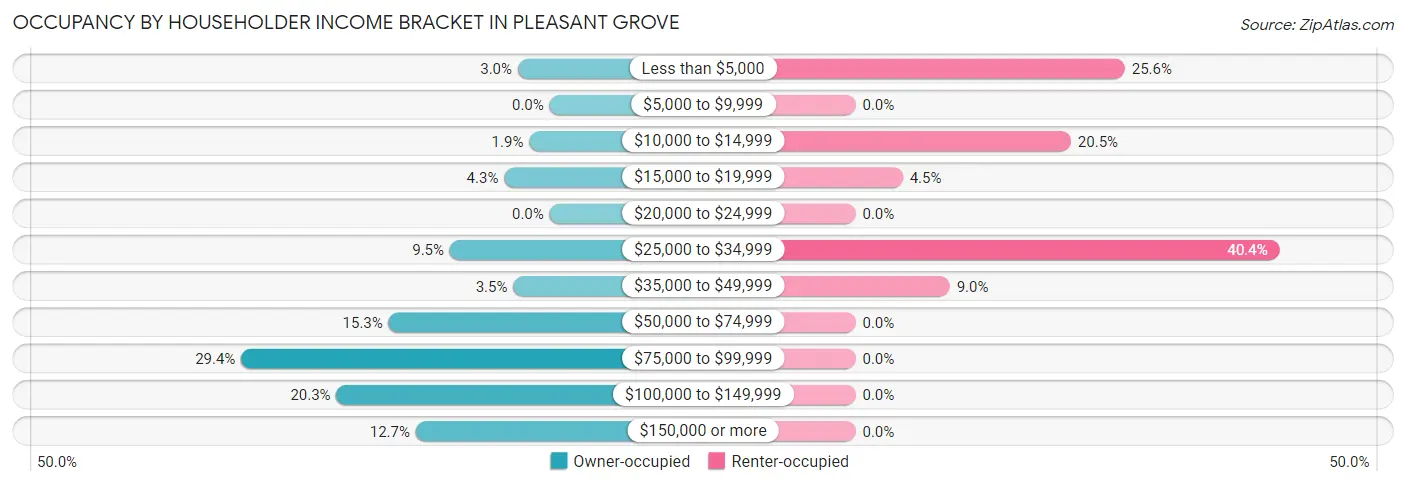
| Income Bracket | Owner-occupied | Renter-occupied |
| Less than $5,000 | 14 (3.0%) | 40 (25.6%) |
| $5,000 to $9,999 | 0 (0.0%) | 0 (0.0%) |
| $10,000 to $14,999 | 9 (1.9%) | 32 (20.5%) |
| $15,000 to $19,999 | 20 (4.3%) | 7 (4.5%) |
| $20,000 to $24,999 | 0 (0.0%) | 0 (0.0%) |
| $25,000 to $34,999 | 44 (9.5%) | 63 (40.4%) |
| $35,000 to $49,999 | 16 (3.5%) | 14 (9.0%) |
| $50,000 to $74,999 | 71 (15.3%) | 0 (0.0%) |
| $75,000 to $99,999 | 136 (29.4%) | 0 (0.0%) |
| $100,000 to $149,999 | 94 (20.3%) | 0 (0.0%) |
| $150,000 or more | 59 (12.7%) | 0 (0.0%) |
| Total | 463 (100.0%) | 156 (100.0%) |
Monthly Housing Cost Tiers in Pleasant Grove
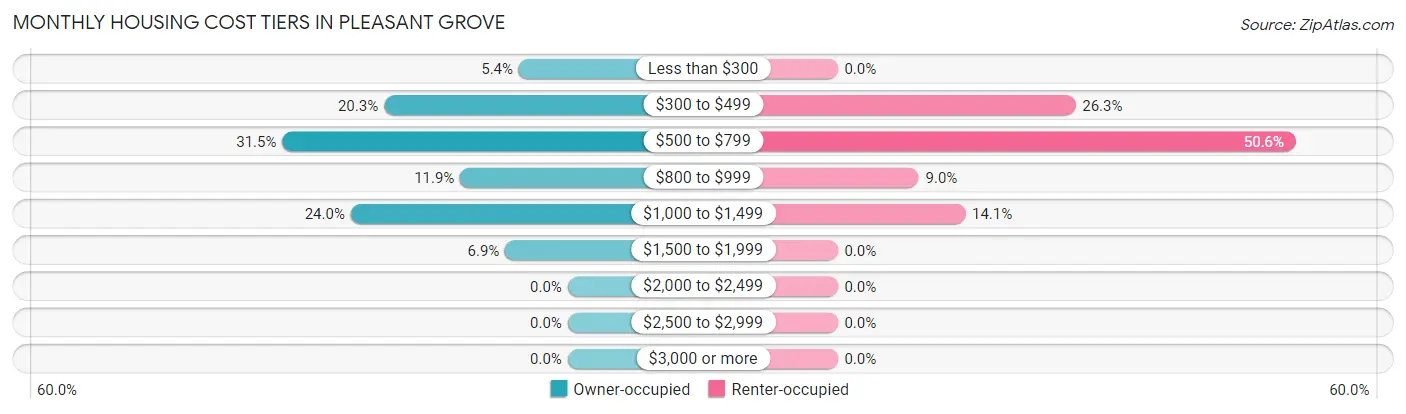
| Monthly Cost | Owner-occupied | Renter-occupied |
| Less than $300 | 25 (5.4%) | 0 (0.0%) |
| $300 to $499 | 94 (20.3%) | 41 (26.3%) |
| $500 to $799 | 146 (31.5%) | 79 (50.6%) |
| $800 to $999 | 55 (11.9%) | 14 (9.0%) |
| $1,000 to $1,499 | 111 (24.0%) | 22 (14.1%) |
| $1,500 to $1,999 | 32 (6.9%) | 0 (0.0%) |
| $2,000 to $2,499 | 0 (0.0%) | 0 (0.0%) |
| $2,500 to $2,999 | 0 (0.0%) | 0 (0.0%) |
| $3,000 or more | 0 (0.0%) | 0 (0.0%) |
| Total | 463 (100.0%) | 156 (100.0%) |
Physical Housing Characteristics in Pleasant Grove
Housing Structures in Pleasant Grove
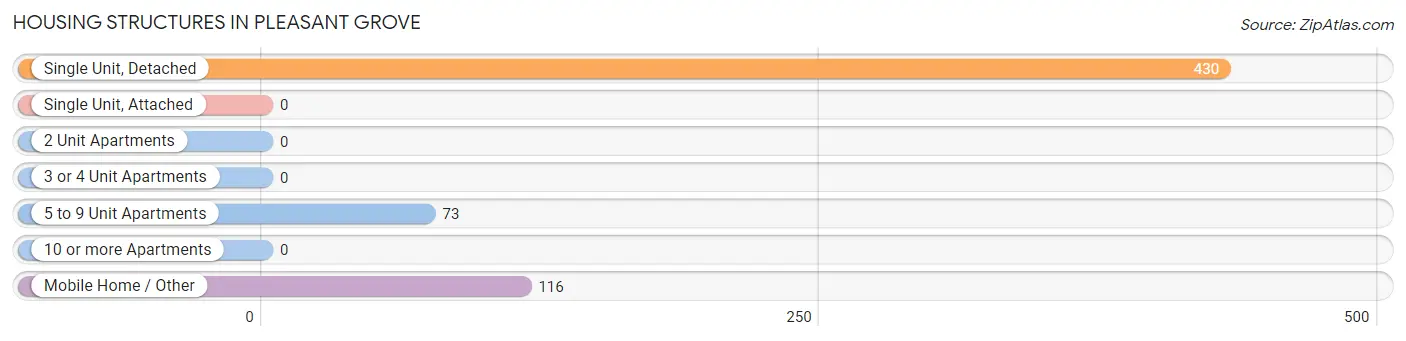
| Structure Type | # Housing Units | % Housing Units |
| Single Unit, Detached | 430 | 69.5% |
| Single Unit, Attached | 0 | 0.0% |
| 2 Unit Apartments | 0 | 0.0% |
| 3 or 4 Unit Apartments | 0 | 0.0% |
| 5 to 9 Unit Apartments | 73 | 11.8% |
| 10 or more Apartments | 0 | 0.0% |
| Mobile Home / Other | 116 | 18.7% |
| Total | 619 | 100.0% |
Housing Structures by Occupancy in Pleasant Grove
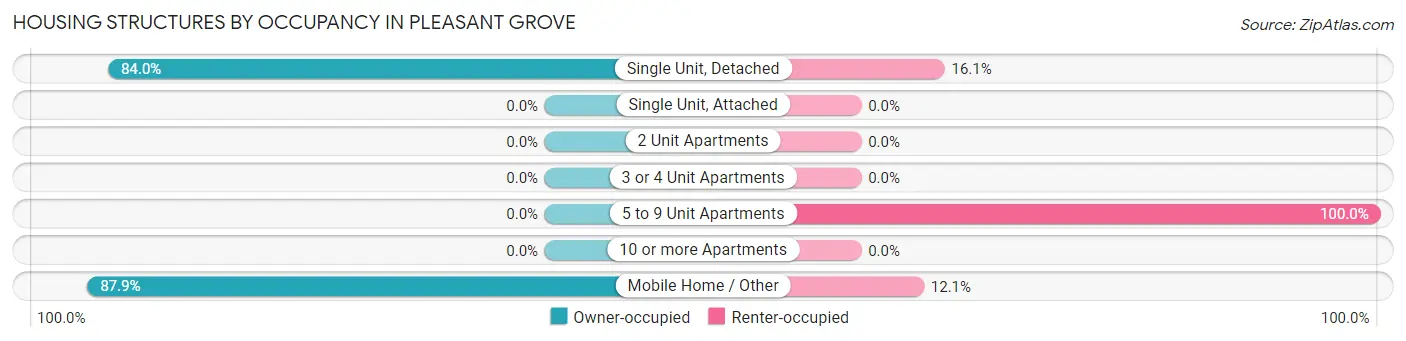
| Structure Type | Owner-occupied | Renter-occupied |
| Single Unit, Detached | 361 (84.0%) | 69 (16.1%) |
| Single Unit, Attached | 0 (0.0%) | 0 (0.0%) |
| 2 Unit Apartments | 0 (0.0%) | 0 (0.0%) |
| 3 or 4 Unit Apartments | 0 (0.0%) | 0 (0.0%) |
| 5 to 9 Unit Apartments | 0 (0.0%) | 73 (100.0%) |
| 10 or more Apartments | 0 (0.0%) | 0 (0.0%) |
| Mobile Home / Other | 102 (87.9%) | 14 (12.1%) |
| Total | 463 (74.8%) | 156 (25.2%) |
Housing Structures by Number of Rooms in Pleasant Grove
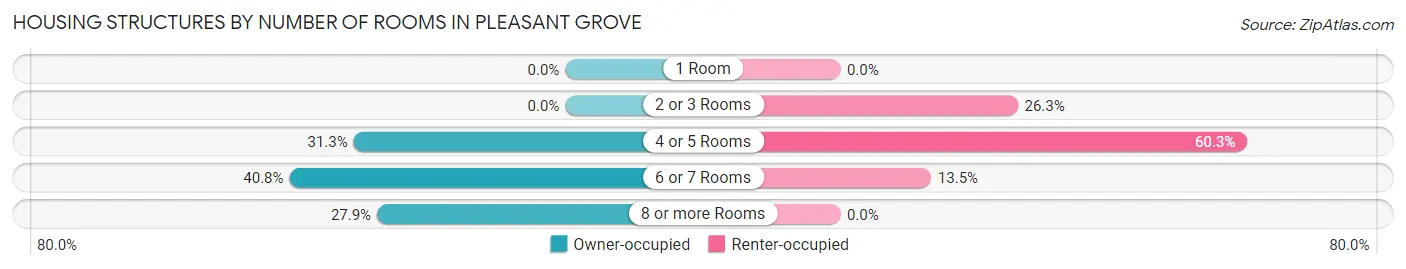
| Number of Rooms | Owner-occupied | Renter-occupied |
| 1 Room | 0 (0.0%) | 0 (0.0%) |
| 2 or 3 Rooms | 0 (0.0%) | 41 (26.3%) |
| 4 or 5 Rooms | 145 (31.3%) | 94 (60.3%) |
| 6 or 7 Rooms | 189 (40.8%) | 21 (13.5%) |
| 8 or more Rooms | 129 (27.9%) | 0 (0.0%) |
| Total | 463 (100.0%) | 156 (100.0%) |
Housing Structure by Heating Type in Pleasant Grove
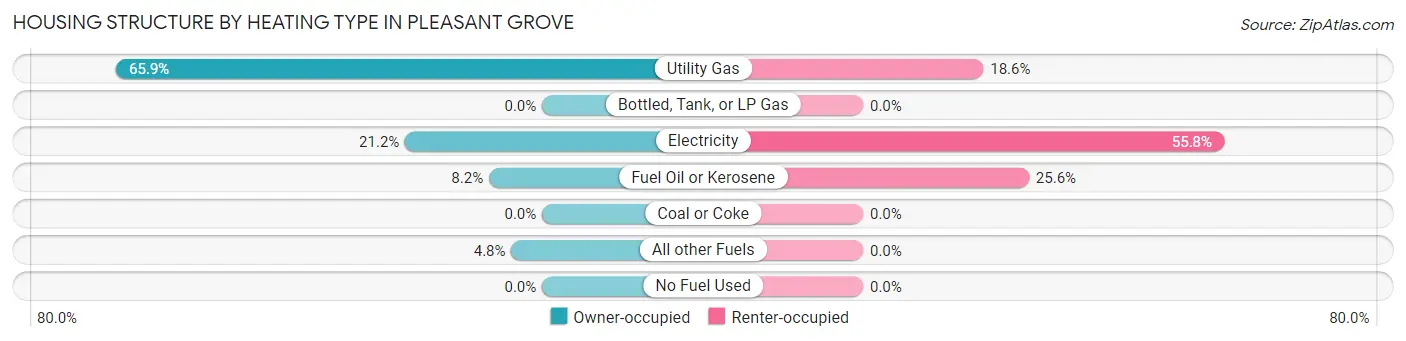
| Heating Type | Owner-occupied | Renter-occupied |
| Utility Gas | 305 (65.9%) | 29 (18.6%) |
| Bottled, Tank, or LP Gas | 0 (0.0%) | 0 (0.0%) |
| Electricity | 98 (21.2%) | 87 (55.8%) |
| Fuel Oil or Kerosene | 38 (8.2%) | 40 (25.6%) |
| Coal or Coke | 0 (0.0%) | 0 (0.0%) |
| All other Fuels | 22 (4.8%) | 0 (0.0%) |
| No Fuel Used | 0 (0.0%) | 0 (0.0%) |
| Total | 463 (100.0%) | 156 (100.0%) |
Household Vehicle Usage in Pleasant Grove
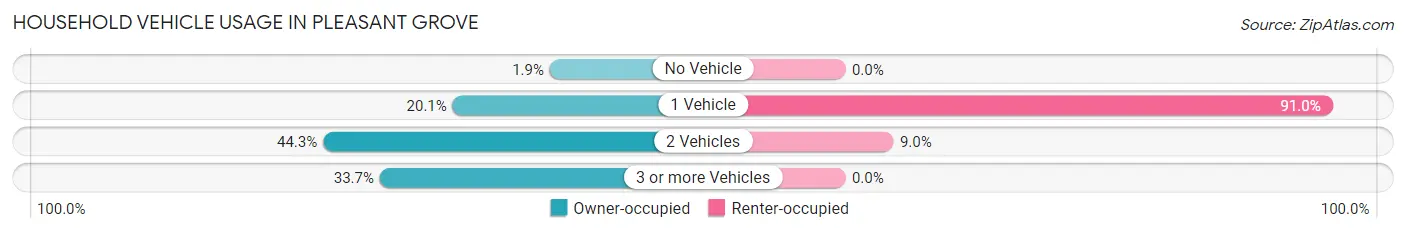
| Vehicles per Household | Owner-occupied | Renter-occupied |
| No Vehicle | 9 (1.9%) | 0 (0.0%) |
| 1 Vehicle | 93 (20.1%) | 142 (91.0%) |
| 2 Vehicles | 205 (44.3%) | 14 (9.0%) |
| 3 or more Vehicles | 156 (33.7%) | 0 (0.0%) |
| Total | 463 (100.0%) | 156 (100.0%) |
Real Estate & Mortgages in Pleasant Grove
Real Estate and Mortgage Overview in Pleasant Grove
| Characteristic | Without Mortgage | With Mortgage |
| Housing Units | 250 | 213 |
| Median Property Value | $150,500 | $158,400 |
| Median Household Income | $78,920 | $17 |
| Monthly Housing Costs | $518 | $0 |
| Real Estate Taxes | $1,683 | $0 |
Property Value by Mortgage Status in Pleasant Grove
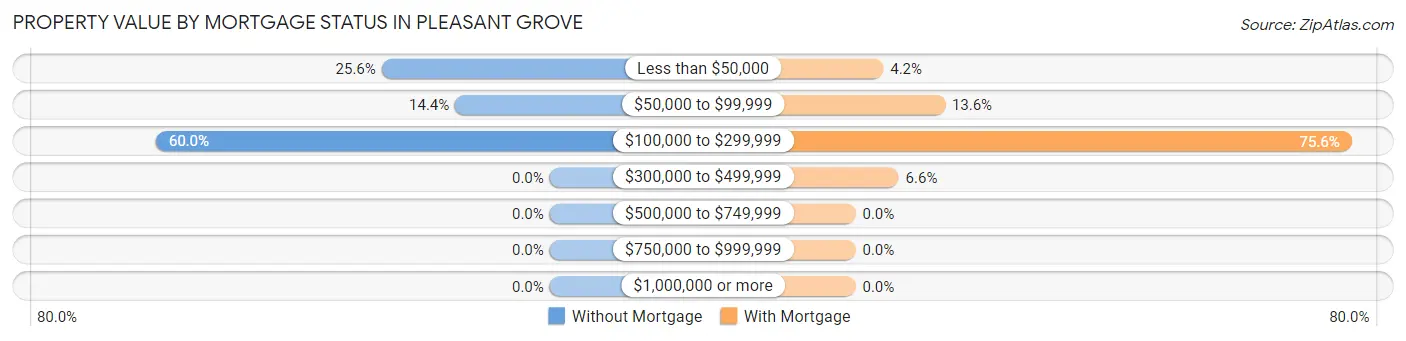
| Property Value | Without Mortgage | With Mortgage |
| Less than $50,000 | 64 (25.6%) | 9 (4.2%) |
| $50,000 to $99,999 | 36 (14.4%) | 29 (13.6%) |
| $100,000 to $299,999 | 150 (60.0%) | 161 (75.6%) |
| $300,000 to $499,999 | 0 (0.0%) | 14 (6.6%) |
| $500,000 to $749,999 | 0 (0.0%) | 0 (0.0%) |
| $750,000 to $999,999 | 0 (0.0%) | 0 (0.0%) |
| $1,000,000 or more | 0 (0.0%) | 0 (0.0%) |
| Total | 250 (100.0%) | 213 (100.0%) |
Household Income by Mortgage Status in Pleasant Grove
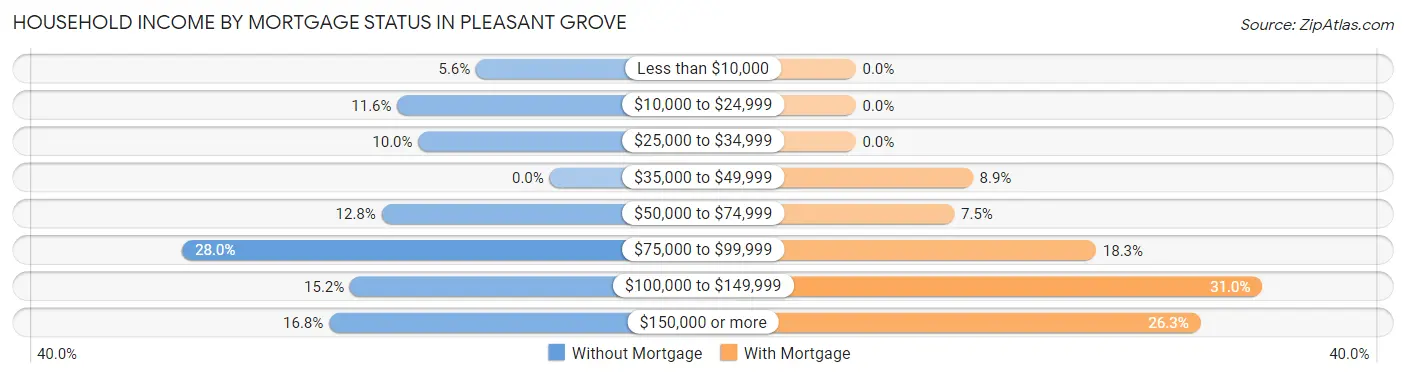
| Household Income | Without Mortgage | With Mortgage |
| Less than $10,000 | 14 (5.6%) | 0 (0.0%) |
| $10,000 to $24,999 | 29 (11.6%) | 0 (0.0%) |
| $25,000 to $34,999 | 25 (10.0%) | 0 (0.0%) |
| $35,000 to $49,999 | 0 (0.0%) | 19 (8.9%) |
| $50,000 to $74,999 | 32 (12.8%) | 16 (7.5%) |
| $75,000 to $99,999 | 70 (28.0%) | 39 (18.3%) |
| $100,000 to $149,999 | 38 (15.2%) | 66 (31.0%) |
| $150,000 or more | 42 (16.8%) | 56 (26.3%) |
| Total | 250 (100.0%) | 213 (100.0%) |
Property Value to Household Income Ratio in Pleasant Grove
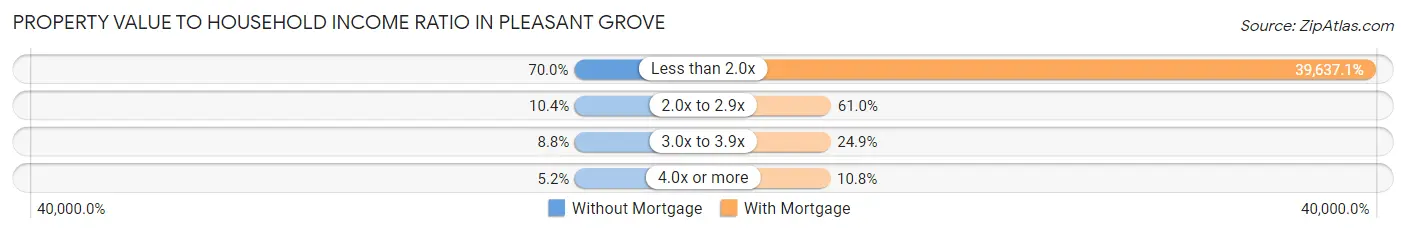
| Value-to-Income Ratio | Without Mortgage | With Mortgage |
| Less than 2.0x | 175 (70.0%) | 84,427 (39,637.1%) |
| 2.0x to 2.9x | 26 (10.4%) | 130 (61.0%) |
| 3.0x to 3.9x | 22 (8.8%) | 53 (24.9%) |
| 4.0x or more | 13 (5.2%) | 23 (10.8%) |
| Total | 250 (100.0%) | 213 (100.0%) |
Real Estate Taxes by Mortgage Status in Pleasant Grove
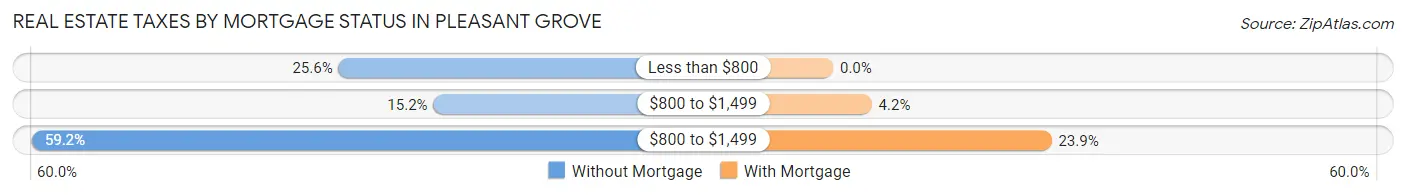
| Property Taxes | Without Mortgage | With Mortgage |
| Less than $800 | 64 (25.6%) | 0 (0.0%) |
| $800 to $1,499 | 38 (15.2%) | 9 (4.2%) |
| $800 to $1,499 | 148 (59.2%) | 51 (23.9%) |
| Total | 250 (100.0%) | 213 (100.0%) |
Health & Disability in Pleasant Grove
Health Insurance Coverage by Age in Pleasant Grove
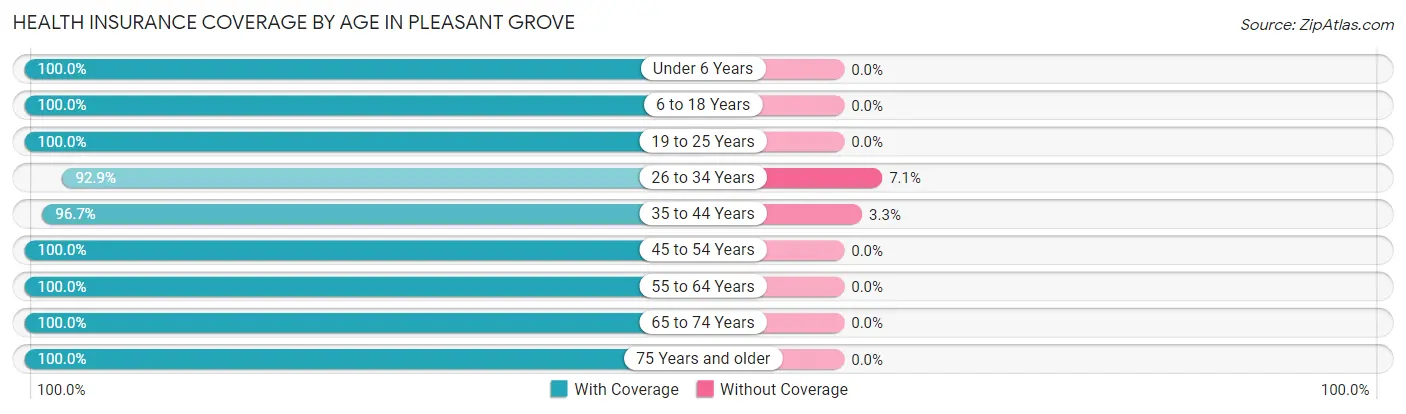
| Age Bracket | With Coverage | Without Coverage |
| Under 6 Years | 52 (100.0%) | 0 (0.0%) |
| 6 to 18 Years | 145 (100.0%) | 0 (0.0%) |
| 19 to 25 Years | 54 (100.0%) | 0 (0.0%) |
| 26 to 34 Years | 92 (92.9%) | 7 (7.1%) |
| 35 to 44 Years | 116 (96.7%) | 4 (3.3%) |
| 45 to 54 Years | 258 (100.0%) | 0 (0.0%) |
| 55 to 64 Years | 168 (100.0%) | 0 (0.0%) |
| 65 to 74 Years | 325 (100.0%) | 0 (0.0%) |
| 75 Years and older | 84 (100.0%) | 0 (0.0%) |
| Total | 1,294 (99.2%) | 11 (0.8%) |
Health Insurance Coverage by Citizenship Status in Pleasant Grove
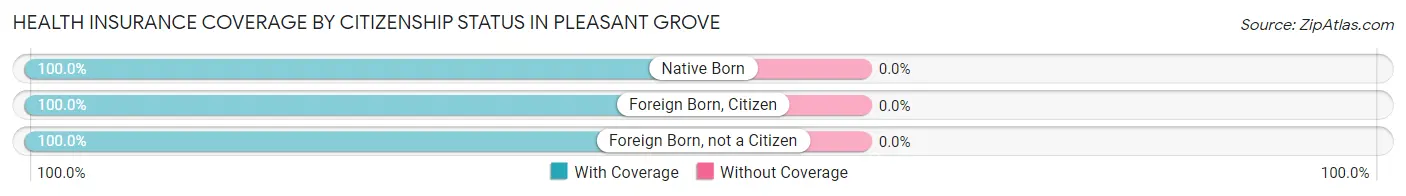
| Citizenship Status | With Coverage | Without Coverage |
| Native Born | 52 (100.0%) | 0 (0.0%) |
| Foreign Born, Citizen | 145 (100.0%) | 0 (0.0%) |
| Foreign Born, not a Citizen | 54 (100.0%) | 0 (0.0%) |
Health Insurance Coverage by Household Income in Pleasant Grove
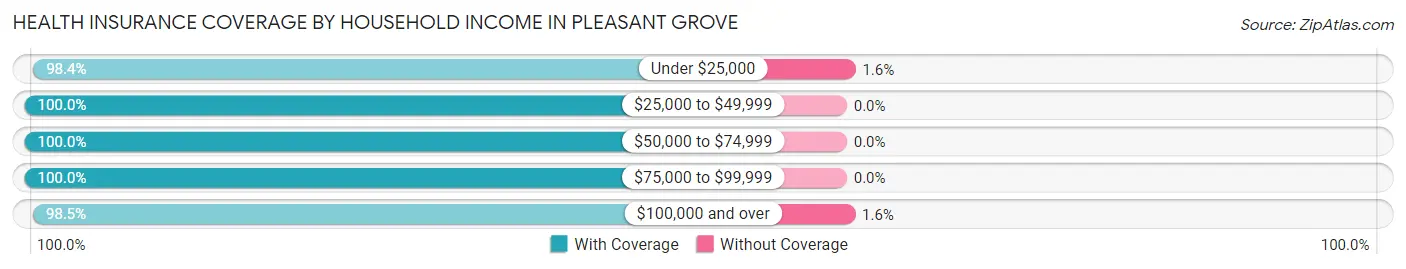
| Household Income | With Coverage | Without Coverage |
| Under $25,000 | 243 (98.4%) | 4 (1.6%) |
| $25,000 to $49,999 | 176 (100.0%) | 0 (0.0%) |
| $50,000 to $74,999 | 154 (100.0%) | 0 (0.0%) |
| $75,000 to $99,999 | 275 (100.0%) | 0 (0.0%) |
| $100,000 and over | 446 (98.5%) | 7 (1.5%) |
Public vs Private Health Insurance Coverage by Age in Pleasant Grove
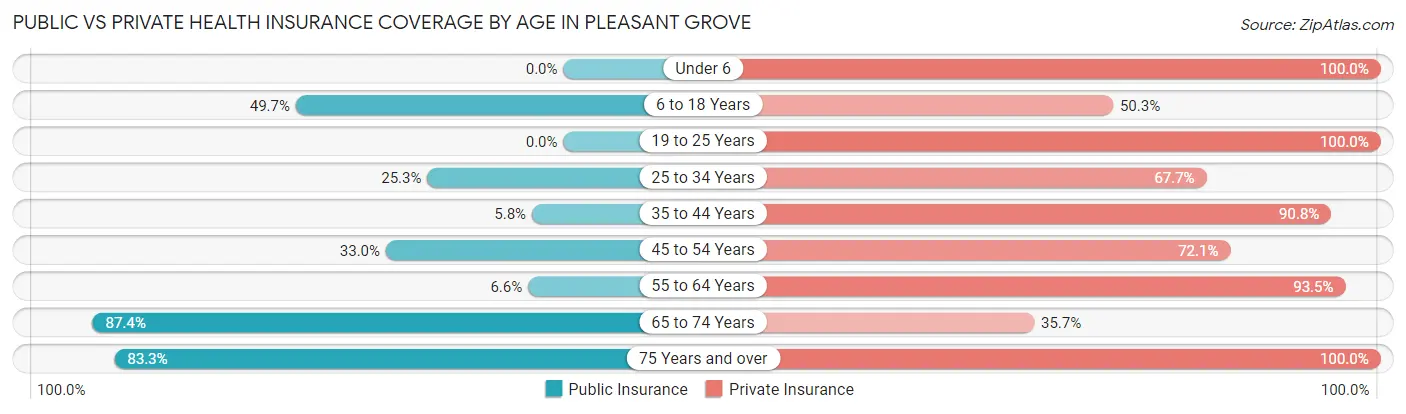
| Age Bracket | Public Insurance | Private Insurance |
| Under 6 | 0 (0.0%) | 52 (100.0%) |
| 6 to 18 Years | 72 (49.7%) | 73 (50.3%) |
| 19 to 25 Years | 0 (0.0%) | 54 (100.0%) |
| 25 to 34 Years | 25 (25.3%) | 67 (67.7%) |
| 35 to 44 Years | 7 (5.8%) | 109 (90.8%) |
| 45 to 54 Years | 85 (33.0%) | 186 (72.1%) |
| 55 to 64 Years | 11 (6.6%) | 157 (93.4%) |
| 65 to 74 Years | 284 (87.4%) | 116 (35.7%) |
| 75 Years and over | 70 (83.3%) | 84 (100.0%) |
| Total | 554 (42.4%) | 898 (68.8%) |
Disability Status by Sex by Age in Pleasant Grove
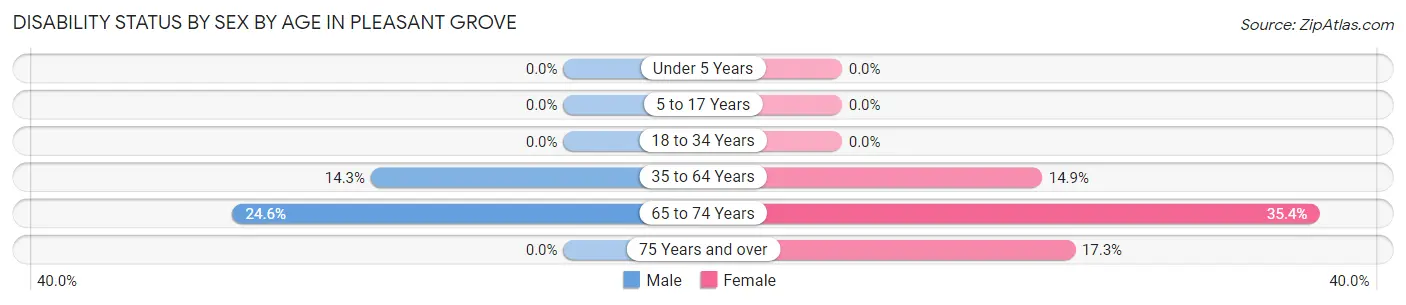
| Age Bracket | Male | Female |
| Under 5 Years | 0 (0.0%) | 0 (0.0%) |
| 5 to 17 Years | 0 (0.0%) | 0 (0.0%) |
| 18 to 34 Years | 0 (0.0%) | 0 (0.0%) |
| 35 to 64 Years | 27 (14.3%) | 53 (14.8%) |
| 65 to 74 Years | 41 (24.5%) | 56 (35.4%) |
| 75 Years and over | 0 (0.0%) | 9 (17.3%) |
Disability Class by Sex by Age in Pleasant Grove
Disability Class: Hearing Difficulty
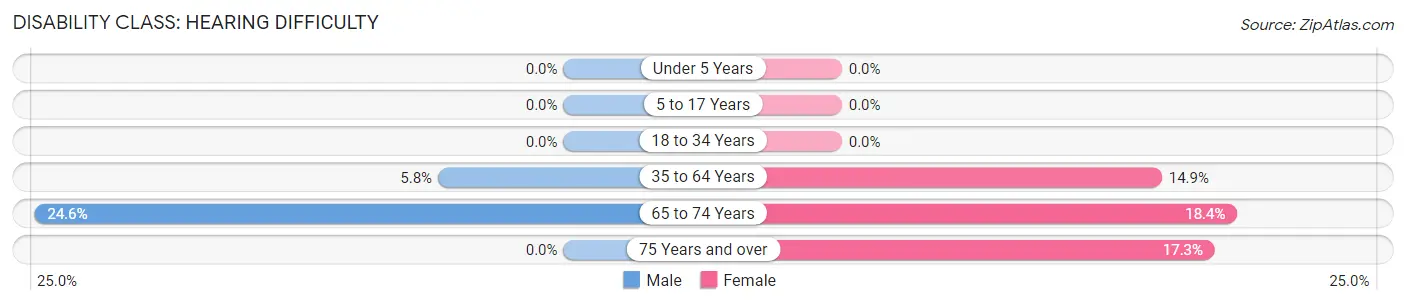
| Age Bracket | Male | Female |
| Under 5 Years | 0 (0.0%) | 0 (0.0%) |
| 5 to 17 Years | 0 (0.0%) | 0 (0.0%) |
| 18 to 34 Years | 0 (0.0%) | 0 (0.0%) |
| 35 to 64 Years | 11 (5.8%) | 53 (14.8%) |
| 65 to 74 Years | 41 (24.5%) | 29 (18.3%) |
| 75 Years and over | 0 (0.0%) | 9 (17.3%) |
Disability Class: Vision Difficulty
| Age Bracket | Male | Female |
| Under 5 Years | 0 (0.0%) | 0 (0.0%) |
| 5 to 17 Years | 0 (0.0%) | 0 (0.0%) |
| 18 to 34 Years | 0 (0.0%) | 0 (0.0%) |
| 35 to 64 Years | 0 (0.0%) | 0 (0.0%) |
| 65 to 74 Years | 0 (0.0%) | 0 (0.0%) |
| 75 Years and over | 0 (0.0%) | 0 (0.0%) |
Disability Class: Cognitive Difficulty
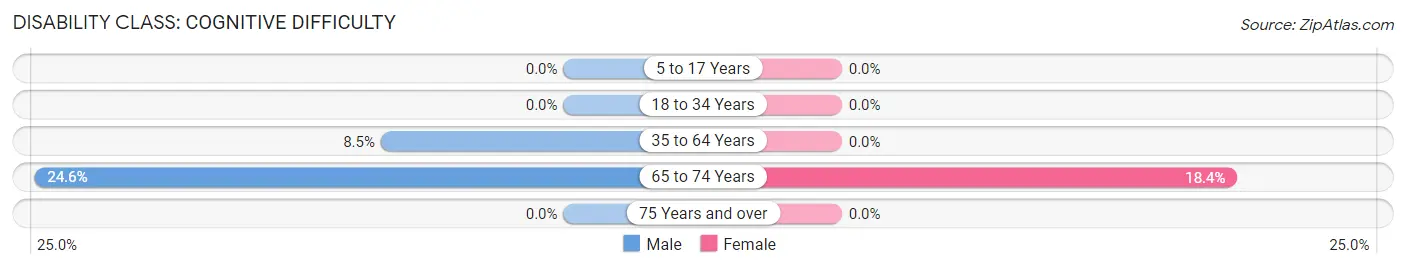
| Age Bracket | Male | Female |
| 5 to 17 Years | 0 (0.0%) | 0 (0.0%) |
| 18 to 34 Years | 0 (0.0%) | 0 (0.0%) |
| 35 to 64 Years | 16 (8.5%) | 0 (0.0%) |
| 65 to 74 Years | 41 (24.5%) | 29 (18.3%) |
| 75 Years and over | 0 (0.0%) | 0 (0.0%) |
Disability Class: Ambulatory Difficulty
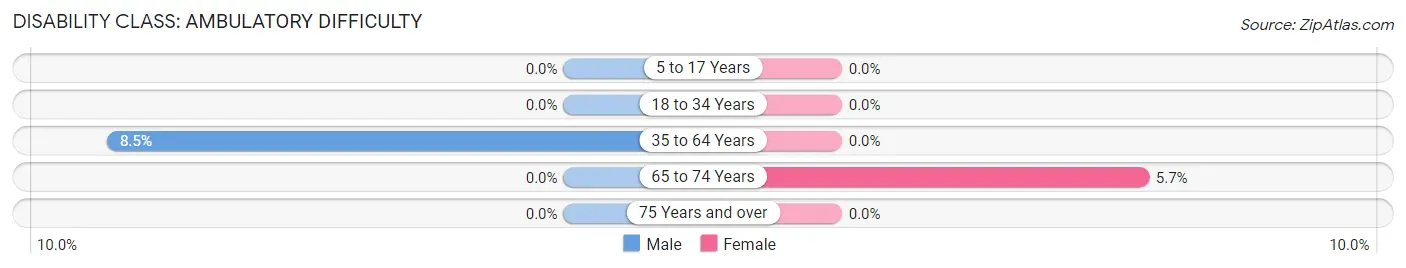
| Age Bracket | Male | Female |
| 5 to 17 Years | 0 (0.0%) | 0 (0.0%) |
| 18 to 34 Years | 0 (0.0%) | 0 (0.0%) |
| 35 to 64 Years | 16 (8.5%) | 0 (0.0%) |
| 65 to 74 Years | 0 (0.0%) | 9 (5.7%) |
| 75 Years and over | 0 (0.0%) | 0 (0.0%) |
Disability Class: Self-Care Difficulty
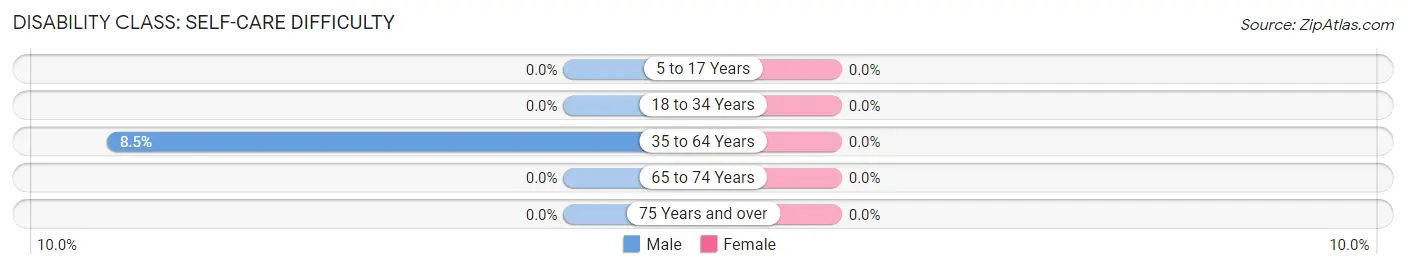
| Age Bracket | Male | Female |
| 5 to 17 Years | 0 (0.0%) | 0 (0.0%) |
| 18 to 34 Years | 0 (0.0%) | 0 (0.0%) |
| 35 to 64 Years | 16 (8.5%) | 0 (0.0%) |
| 65 to 74 Years | 0 (0.0%) | 0 (0.0%) |
| 75 Years and over | 0 (0.0%) | 0 (0.0%) |
Technology Access in Pleasant Grove
Computing Device Access in Pleasant Grove
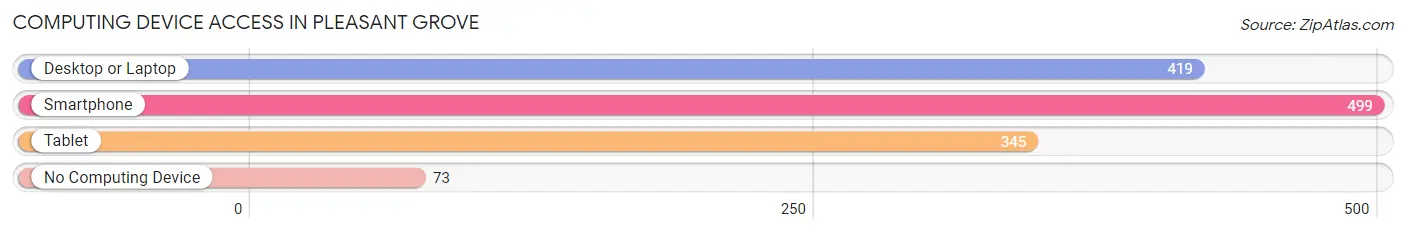
| Device Type | # Households | % Households |
| Desktop or Laptop | 419 | 67.7% |
| Smartphone | 499 | 80.6% |
| Tablet | 345 | 55.7% |
| No Computing Device | 73 | 11.8% |
| Total | 619 | 100.0% |
Internet Access in Pleasant Grove
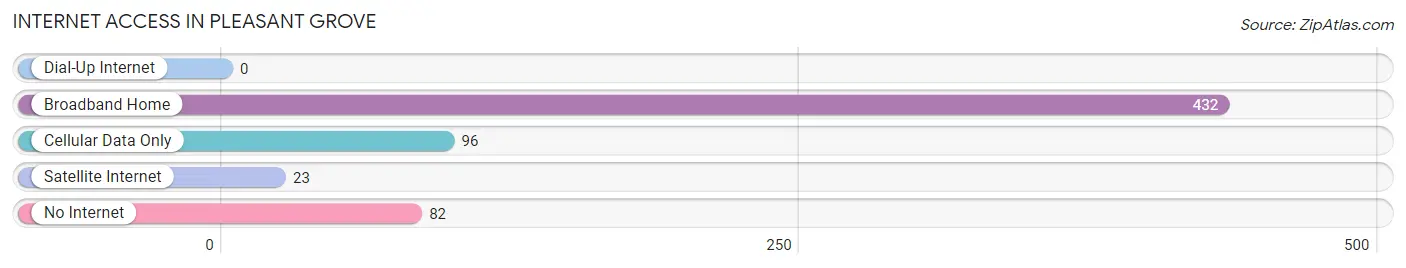
| Internet Type | # Households | % Households |
| Dial-Up Internet | 0 | 0.0% |
| Broadband Home | 432 | 69.8% |
| Cellular Data Only | 96 | 15.5% |
| Satellite Internet | 23 | 3.7% |
| No Internet | 82 | 13.3% |
| Total | 619 | 100.0% |
Pleasant Grove Summary
Pleasant Grove is a small unincorporated community located in the southeastern corner of Ohio, in the county of Belmont. It is situated on the Ohio River, just south of the city of Wheeling, West Virginia. The population of Pleasant Grove was estimated to be around 1,000 people in 2020.
History
Pleasant Grove was first settled in the early 1800s by a group of settlers from Pennsylvania. The settlement was originally known as “Pleasant Valley”, but the name was changed to Pleasant Grove in 1820. The community was originally a farming community, but it soon became a center for the coal and oil industries. The first coal mine in the area was opened in 1845, and the first oil well was drilled in 1859.
The community grew rapidly in the late 19th and early 20th centuries, and by the 1920s it had become a bustling town with a population of over 1,000 people. The town was home to several businesses, including a hotel, a bank, a post office, a general store, and several churches.
Geography
Pleasant Grove is located in the southeastern corner of Ohio, in the county of Belmont. It is situated on the Ohio River, just south of the city of Wheeling, West Virginia. The community is surrounded by rolling hills and wooded areas, and is located in a rural area. The nearest major city is Pittsburgh, which is located about 50 miles to the north.
Economy
The economy of Pleasant Grove is largely based on agriculture and the coal and oil industries. The town is home to several farms, and the surrounding area is known for its production of corn, soybeans, and hay. The coal and oil industries are also important to the local economy, and the town is home to several coal mines and oil wells.
In addition to agriculture and the coal and oil industries, Pleasant Grove is also home to several small businesses, including a hotel, a bank, a post office, a general store, and several churches. The town also has a few restaurants and bars, as well as a few small shops.
Demographics
The population of Pleasant Grove was estimated to be around 1,000 people in 2020. The racial makeup of the town is predominantly white, with a small percentage of African Americans and Native Americans. The median household income in the town is around $45,000, and the median home value is around $100,000. The town has a low unemployment rate, and the majority of the population is employed in the agriculture and coal and oil industries.
Common Questions
What is Per Capita Income in Pleasant Grove?
Per Capita income in Pleasant Grove is $35,793.
What is the Median Family Income in Pleasant Grove?
Median Family Income in Pleasant Grove is $80,577.
What is the Median Household income in Pleasant Grove?
Median Household Income in Pleasant Grove is $71,115.
What is Income or Wage Gap in Pleasant Grove?
Income or Wage Gap in Pleasant Grove is 47.7%.
Women in Pleasant Grove earn 52.3 cents for every dollar earned by a man.
What is Inequality or Gini Index in Pleasant Grove?
Inequality or Gini Index in Pleasant Grove is 0.44.
What is the Total Population of Pleasant Grove?
Total Population of Pleasant Grove is 1,310.
What is the Total Male Population of Pleasant Grove?
Total Male Population of Pleasant Grove is 614.
What is the Total Female Population of Pleasant Grove?
Total Female Population of Pleasant Grove is 696.
What is the Ratio of Males per 100 Females in Pleasant Grove?
There are 88.22 Males per 100 Females in Pleasant Grove.
What is the Ratio of Females per 100 Males in Pleasant Grove?
There are 113.36 Females per 100 Males in Pleasant Grove.
What is the Median Population Age in Pleasant Grove?
Median Population Age in Pleasant Grove is 50.0 Years.
What is the Average Family Size in Pleasant Grove
Average Family Size in Pleasant Grove is 2.5 People.
What is the Average Household Size in Pleasant Grove
Average Household Size in Pleasant Grove is 2.1 People.
How Large is the Labor Force in Pleasant Grove?
There are 717 People in the Labor Forcein in Pleasant Grove.
What is the Percentage of People in the Labor Force in Pleasant Grove?
62.8% of People are in the Labor Force in Pleasant Grove.
What is the Unemployment Rate in Pleasant Grove?
Unemployment Rate in Pleasant Grove is 2.2%.