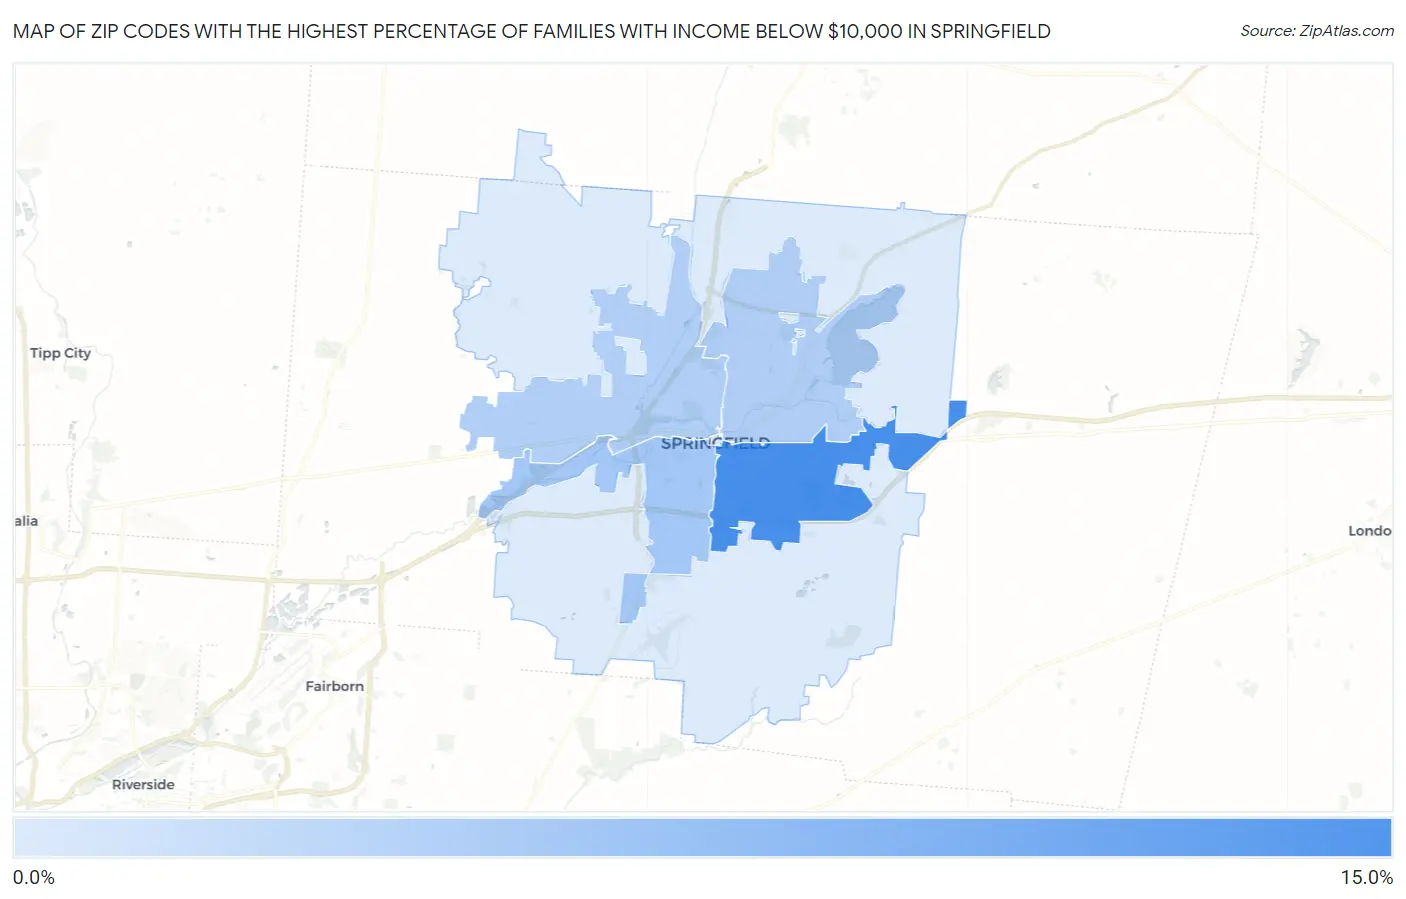
Zip Codes with the Highest Percentage of Families with Income Below $10,000 in Springfield, OH
RELATED REPORTS & OPTIONS
Family Income | $0-10k
Springfield
Compare Zip Codes
Map of Zip Codes with the Highest Percentage of Families with Income Below $10,000 in Springfield
1.2%
10.8%
Zip Codes with the Highest Percentage of Families with Income Below $10,000 in Springfield, OH
| Zip Code | Families with Income < $10k | vs State | vs National | |
| 1. | 45505 | 10.8% | 3.3%(+7.50)#59 | 3.1%(+7.70)#1,649 |
| 2. | 45506 | 4.8% | 3.3%(+1.50)#252 | 3.1%(+1.70)#6,483 |
| 3. | 45503 | 4.1% | 3.3%(+0.800)#301 | 3.1%(+1.000)#7,893 |
| 4. | 45504 | 3.9% | 3.3%(+0.600)#323 | 3.1%(+0.800)#8,460 |
| 5. | 45502 | 1.2% | 3.3%(-2.10)#735 | 3.1%(-1.90)#19,355 |
1
Common Questions
What are the Top 3 Zip Codes with the Highest Percentage of Families with Income Below $10,000 in Springfield, OH?
Top 3 Zip Codes with the Highest Percentage of Families with Income Below $10,000 in Springfield, OH are:
What zip code has the Highest Percentage of Families with Income Below $10,000 in Springfield, OH?
45505 has the Highest Percentage of Families with Income Below $10,000 in Springfield, OH with 10.8%.
What is the Percentage of Families with Income Below $10,000 in Springfield, OH?
Percentage of Families with Income Below $10,000 in Springfield is 8.2%.
What is the Percentage of Families with Income Below $10,000 in Ohio?
Percentage of Families with Income Below $10,000 in Ohio is 3.3%.
What is the Percentage of Families with Income Below $10,000 in the United States?
Percentage of Families with Income Below $10,000 in the United States is 3.1%.