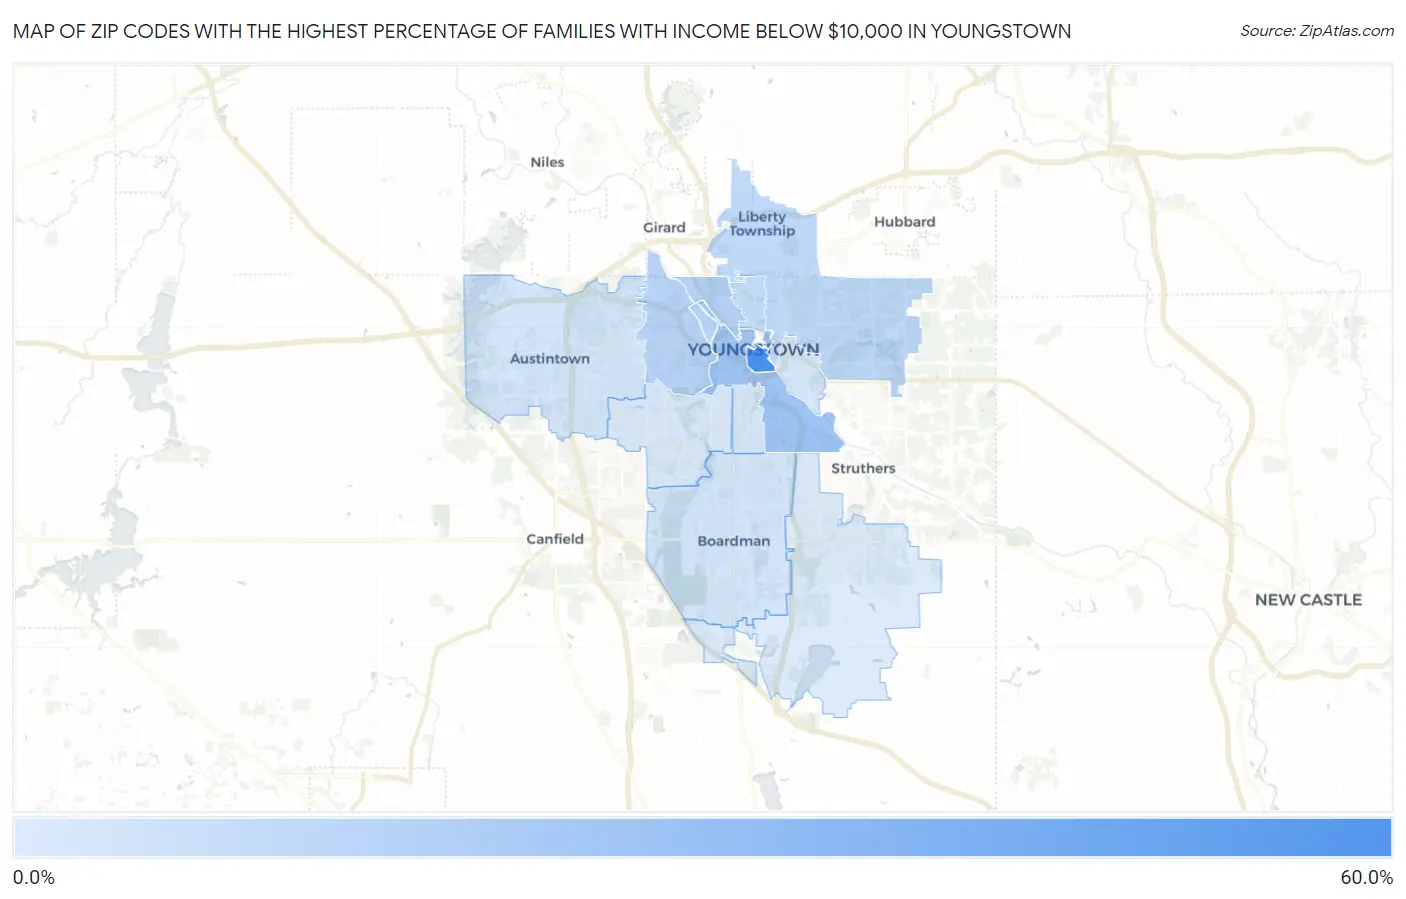
Zip Codes with the Highest Percentage of Families with Income Below $10,000 in Youngstown, OH
RELATED REPORTS & OPTIONS
Family Income | $0-10k
Youngstown
Compare Zip Codes
Map of Zip Codes with the Highest Percentage of Families with Income Below $10,000 in Youngstown
1.5%
52.4%
Zip Codes with the Highest Percentage of Families with Income Below $10,000 in Youngstown, OH
| Zip Code | Families with Income < $10k | vs State | vs National | |
| 1. | 44503 | 52.4% | 3.3%(+49.1)#2 | 3.1%(+49.3)#56 |
| 2. | 44502 | 20.4% | 3.3%(+17.1)#13 | 3.1%(+17.3)#459 |
| 3. | 44510 | 12.9% | 3.3%(+9.60)#33 | 3.1%(+9.80)#1,142 |
| 4. | 44509 | 12.1% | 3.3%(+8.80)#40 | 3.1%(+9.00)#1,298 |
| 5. | 44505 | 9.8% | 3.3%(+6.50)#75 | 3.1%(+6.70)#1,988 |
| 6. | 44504 | 7.8% | 3.3%(+4.50)#135 | 3.1%(+4.70)#3,095 |
| 7. | 44515 | 4.1% | 3.3%(+0.800)#304 | 3.1%(+1.000)#7,907 |
| 8. | 44512 | 3.9% | 3.3%(+0.600)#320 | 3.1%(+0.800)#8,405 |
| 9. | 44507 | 3.6% | 3.3%(+0.300)#354 | 3.1%(+0.500)#9,350 |
| 10. | 44506 | 2.9% | 3.3%(-0.400)#450 | 3.1%(-0.200)#11,673 |
| 11. | 44511 | 2.3% | 3.3%(-1.00)#529 | 3.1%(-0.800)#14,005 |
| 12. | 44514 | 1.5% | 3.3%(-1.80)#673 | 3.1%(-1.60)#17,779 |
1
Common Questions
What are the Top 10 Zip Codes with the Highest Percentage of Families with Income Below $10,000 in Youngstown, OH?
Top 10 Zip Codes with the Highest Percentage of Families with Income Below $10,000 in Youngstown, OH are:
What zip code has the Highest Percentage of Families with Income Below $10,000 in Youngstown, OH?
44503 has the Highest Percentage of Families with Income Below $10,000 in Youngstown, OH with 52.4%.
What is the Percentage of Families with Income Below $10,000 in Youngstown, OH?
Percentage of Families with Income Below $10,000 in Youngstown is 10.6%.
What is the Percentage of Families with Income Below $10,000 in Ohio?
Percentage of Families with Income Below $10,000 in Ohio is 3.3%.
What is the Percentage of Families with Income Below $10,000 in the United States?
Percentage of Families with Income Below $10,000 in the United States is 3.1%.