Manchester, OH Map & Demographics
Manchester Map
Manchester Overview
$22,824
PER CAPITA INCOME
$29,615
AVG FAMILY INCOME
$30,313
AVG HOUSEHOLD INCOME
23.2%
WAGE / INCOME GAP [ % ]
76.8¢/ $1
WAGE / INCOME GAP [ $ ]
$12,371
FAMILY INCOME DEFICIT
0.57
INEQUALITY / GINI INDEX
2,110
TOTAL POPULATION
1,007
MALE POPULATION
1,103
FEMALE POPULATION
91.30
MALES / 100 FEMALES
109.53
FEMALES / 100 MALES
32.6
MEDIAN AGE
3.0
AVG FAMILY SIZE
2.7
AVG HOUSEHOLD SIZE
863
LABOR FORCE [ PEOPLE ]
52.8%
PERCENT IN LABOR FORCE
10.8%
UNEMPLOYMENT RATE
Manchester Zip Codes
Manchester Area Codes
Income in Manchester
Income Overview in Manchester
Per Capita Income in Manchester is $22,824, while median incomes of families and households are $29,615 and $30,313 respectively.
| Characteristic | Number | Measure |
| Per Capita Income | 2,110 | $22,824 |
| Median Family Income | 524 | $29,615 |
| Mean Family Income | 524 | $66,994 |
| Median Household Income | 784 | $30,313 |
| Mean Household Income | 784 | $58,995 |
| Income Deficit | 524 | $12,371 |
| Wage / Income Gap (%) | 2,110 | 23.20% |
| Wage / Income Gap ($) | 2,110 | 76.80¢ per $1 |
| Gini / Inequality Index | 2,110 | 0.57 |
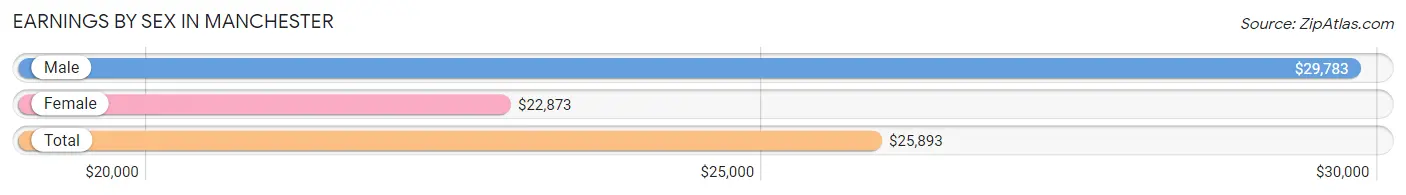
Earnings by Sex in Manchester
Average Earnings in Manchester are $25,893, $29,783 for men and $22,873 for women, a difference of 23.2%.
| Sex | Number | Average Earnings |
| Male | 363 (44.2%) | $29,783 |
| Female | 459 (55.8%) | $22,873 |
| Total | 822 (100.0%) | $25,893 |
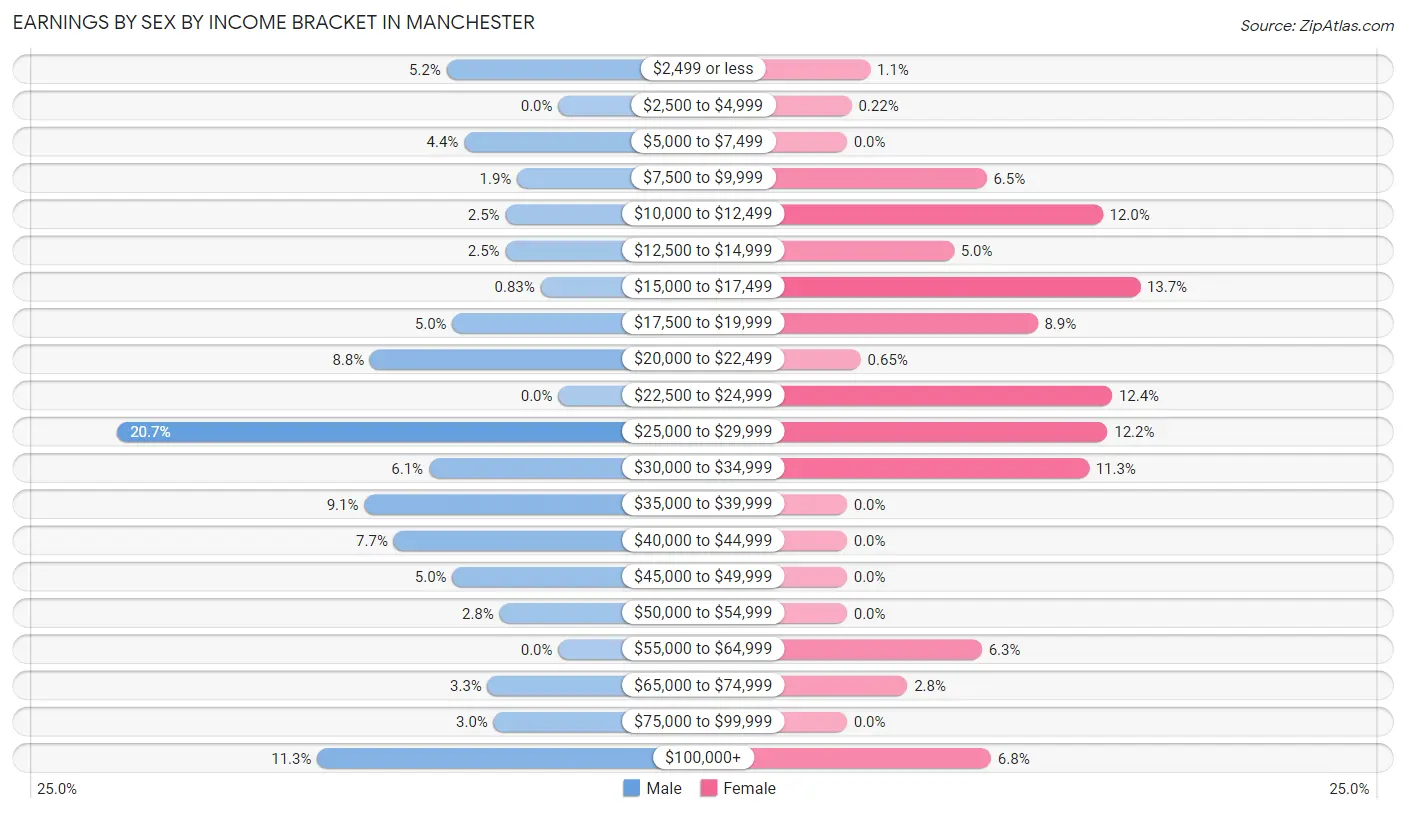
Earnings by Sex by Income Bracket in Manchester
The most common earnings brackets in Manchester are $25,000 to $29,999 for men (75 | 20.7%) and $15,000 to $17,499 for women (63 | 13.7%).
| Income | Male | Female |
| $2,499 or less | 19 (5.2%) | 5 (1.1%) |
| $2,500 to $4,999 | 0 (0.0%) | 1 (0.2%) |
| $5,000 to $7,499 | 16 (4.4%) | 0 (0.0%) |
| $7,500 to $9,999 | 7 (1.9%) | 30 (6.5%) |
| $10,000 to $12,499 | 9 (2.5%) | 55 (12.0%) |
| $12,500 to $14,999 | 9 (2.5%) | 23 (5.0%) |
| $15,000 to $17,499 | 3 (0.8%) | 63 (13.7%) |
| $17,500 to $19,999 | 18 (5.0%) | 41 (8.9%) |
| $20,000 to $22,499 | 32 (8.8%) | 3 (0.6%) |
| $22,500 to $24,999 | 0 (0.0%) | 57 (12.4%) |
| $25,000 to $29,999 | 75 (20.7%) | 56 (12.2%) |
| $30,000 to $34,999 | 22 (6.1%) | 52 (11.3%) |
| $35,000 to $39,999 | 33 (9.1%) | 0 (0.0%) |
| $40,000 to $44,999 | 28 (7.7%) | 0 (0.0%) |
| $45,000 to $49,999 | 18 (5.0%) | 0 (0.0%) |
| $50,000 to $54,999 | 10 (2.8%) | 0 (0.0%) |
| $55,000 to $64,999 | 0 (0.0%) | 29 (6.3%) |
| $65,000 to $74,999 | 12 (3.3%) | 13 (2.8%) |
| $75,000 to $99,999 | 11 (3.0%) | 0 (0.0%) |
| $100,000+ | 41 (11.3%) | 31 (6.8%) |
| Total | 363 (100.0%) | 459 (100.0%) |
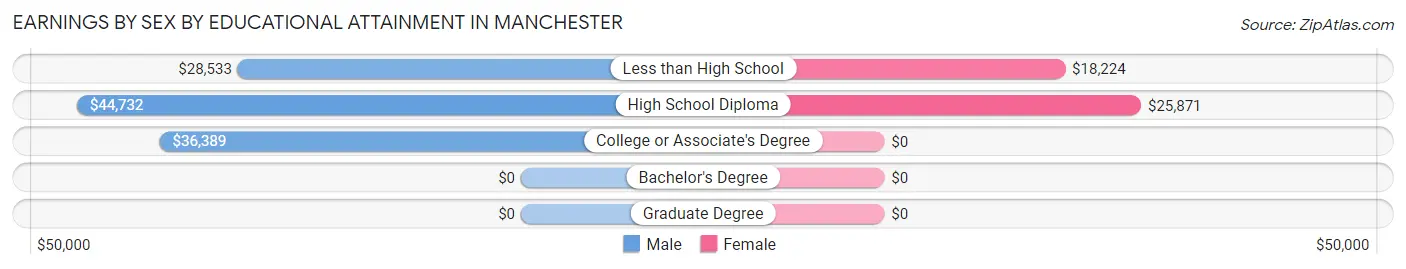
Earnings by Sex by Educational Attainment in Manchester
Average earnings in Manchester are $35,833 for men and $19,939 for women, a difference of 44.4%. Men with an educational attainment of high school diploma enjoy the highest average annual earnings of $44,732, while those with less than high school education earn the least with $28,533. Women with an educational attainment of high school diploma earn the most with the average annual earnings of $25,871, while those with less than high school education have the smallest earnings of $18,224.
| Educational Attainment | Male Income | Female Income |
| Less than High School | $28,533 | $18,224 |
| High School Diploma | $44,732 | $25,871 |
| College or Associate's Degree | $36,389 | $0 |
| Bachelor's Degree | - | - |
| Graduate Degree | - | - |
| Total | $35,833 | $19,939 |
Family Income in Manchester
Family Income Brackets in Manchester
According to the Manchester family income data, there are 121 families falling into the $15,000 to $24,999 income range, which is the most common income bracket and makes up 23.1% of all families. Conversely, the $150,000 to $199,999 income bracket is the least frequent group with only 14 families (2.7%) belonging to this category.
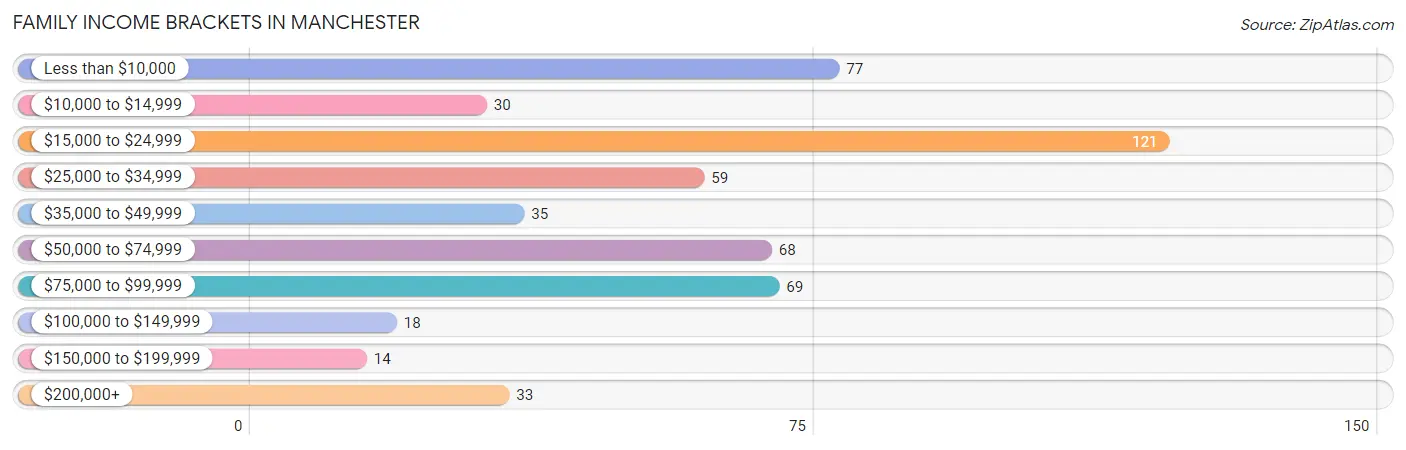
| Income Bracket | # Families | % Families |
| Less than $10,000 | 77 | 14.7% |
| $10,000 to $14,999 | 30 | 5.7% |
| $15,000 to $24,999 | 121 | 23.1% |
| $25,000 to $34,999 | 59 | 11.3% |
| $35,000 to $49,999 | 35 | 6.7% |
| $50,000 to $74,999 | 68 | 13.0% |
| $75,000 to $99,999 | 69 | 13.2% |
| $100,000 to $149,999 | 18 | 3.4% |
| $150,000 to $199,999 | 14 | 2.7% |
| $200,000+ | 33 | 6.3% |
Family Income by Famaliy Size in Manchester
4-person families (93 | 17.7%) account for the highest median family income in Manchester with $85,938 per family, while 4-person families (93 | 17.7%) have the highest median income of $21,484 per family member.
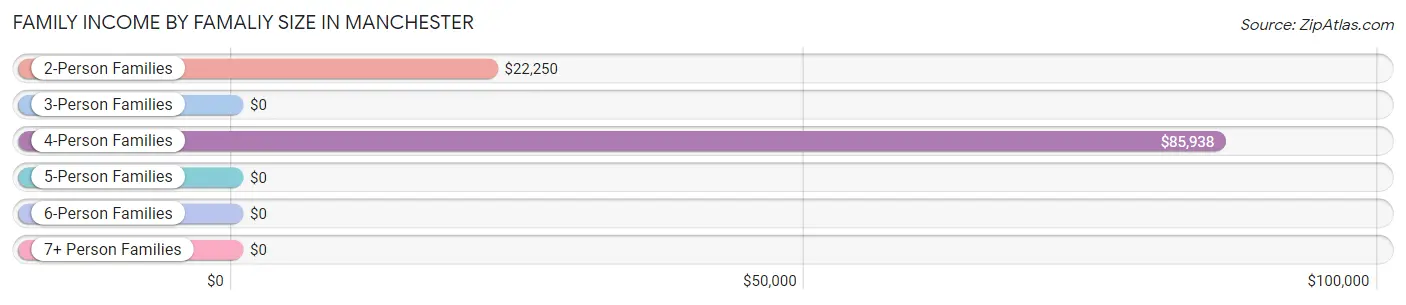
| Income Bracket | # Families | Median Income |
| 2-Person Families | 291 (55.5%) | $22,250 |
| 3-Person Families | 108 (20.6%) | $0 |
| 4-Person Families | 93 (17.7%) | $85,938 |
| 5-Person Families | 0 (0.0%) | $0 |
| 6-Person Families | 32 (6.1%) | $0 |
| 7+ Person Families | 0 (0.0%) | $0 |
| Total | 524 (100.0%) | $29,615 |
Family Income by Number of Earners in Manchester
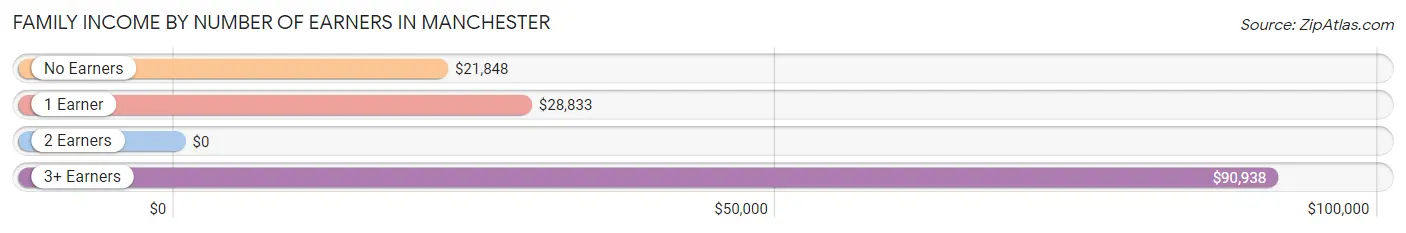
| Number of Earners | # Families | Median Income |
| No Earners | 188 (35.9%) | $21,848 |
| 1 Earner | 178 (34.0%) | $28,833 |
| 2 Earners | 109 (20.8%) | $0 |
| 3+ Earners | 49 (9.3%) | $90,938 |
| Total | 524 (100.0%) | $29,615 |
Household Income in Manchester
Household Income Brackets in Manchester
With 144 households falling in the category, the $15,000 to $24,999 income range is the most frequent in Manchester, accounting for 18.4% of all households. In contrast, only 14 households (1.8%) fall into the $150,000 to $199,999 income bracket, making it the least populous group.
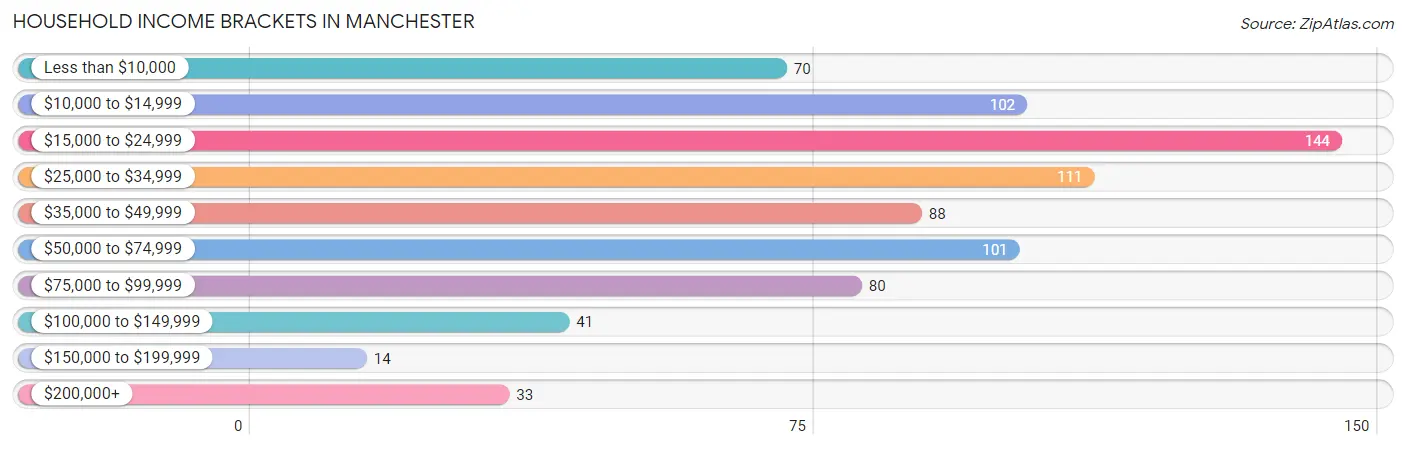
| Income Bracket | # Households | % Households |
| Less than $10,000 | 70 | 8.9% |
| $10,000 to $14,999 | 102 | 13.0% |
| $15,000 to $24,999 | 144 | 18.4% |
| $25,000 to $34,999 | 111 | 14.2% |
| $35,000 to $49,999 | 88 | 11.2% |
| $50,000 to $74,999 | 101 | 12.9% |
| $75,000 to $99,999 | 80 | 10.2% |
| $100,000 to $149,999 | 41 | 5.2% |
| $150,000 to $199,999 | 14 | 1.8% |
| $200,000+ | 33 | 4.2% |
Household Income by Householder Age in Manchester
The median household income in Manchester is $30,313, with the highest median household income of $53,261 found in the 25 to 44 years age bracket for the primary householder. A total of 270 households (34.4%) fall into this category. Meanwhile, the 15 to 24 years age bracket for the primary householder has the lowest median household income of $20,313, with 86 households (11.0%) in this group.
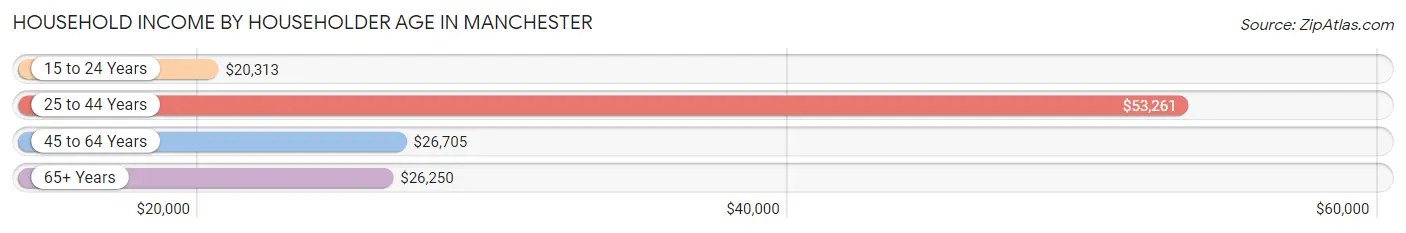
| Income Bracket | # Households | Median Income |
| 15 to 24 Years | 86 (11.0%) | $20,313 |
| 25 to 44 Years | 270 (34.4%) | $53,261 |
| 45 to 64 Years | 222 (28.3%) | $26,705 |
| 65+ Years | 206 (26.3%) | $26,250 |
| Total | 784 (100.0%) | $30,313 |
Poverty in Manchester
Income Below Poverty by Sex and Age in Manchester
With 33.6% poverty level for males and 40.5% for females among the residents of Manchester, 16 and 17 year old males and 5 year old females are the most vulnerable to poverty, with 24 males (100.0%) and 18 females (100.0%) in their respective age groups living below the poverty level.
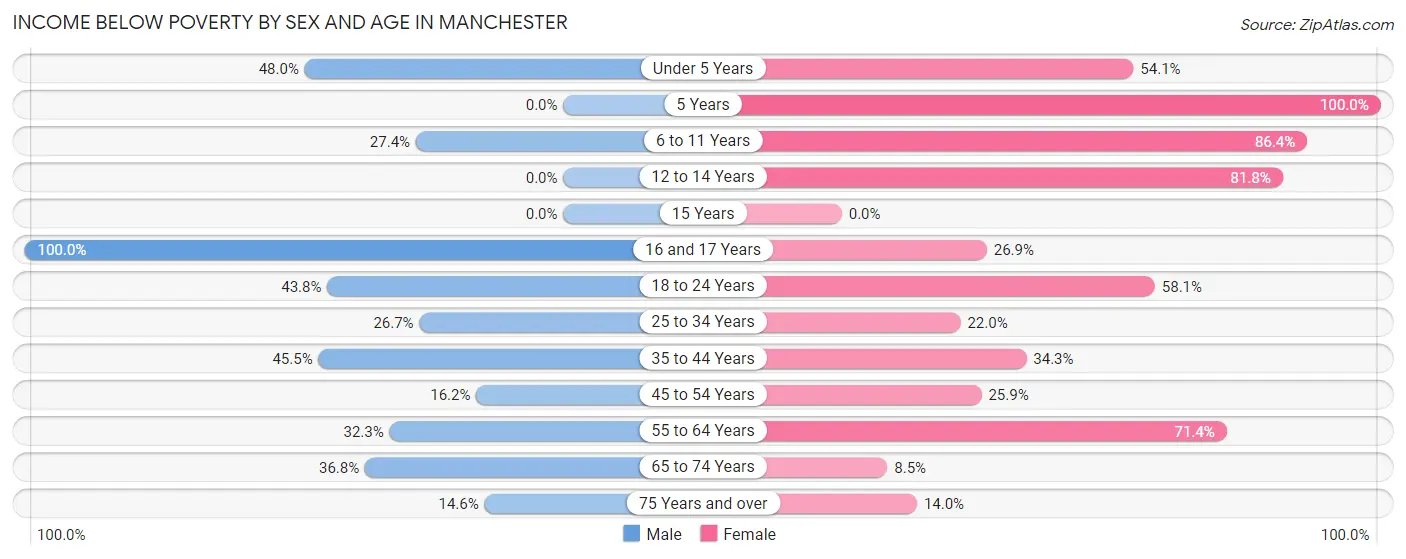
| Age Bracket | Male | Female |
| Under 5 Years | 48 (48.0%) | 59 (54.1%) |
| 5 Years | 0 (0.0%) | 18 (100.0%) |
| 6 to 11 Years | 26 (27.4%) | 57 (86.4%) |
| 12 to 14 Years | 0 (0.0%) | 18 (81.8%) |
| 15 Years | 0 (0.0%) | 0 (0.0%) |
| 16 and 17 Years | 24 (100.0%) | 7 (26.9%) |
| 18 to 24 Years | 39 (43.8%) | 86 (58.1%) |
| 25 to 34 Years | 39 (26.7%) | 50 (22.0%) |
| 35 to 44 Years | 50 (45.5%) | 37 (34.3%) |
| 45 to 54 Years | 16 (16.2%) | 28 (25.9%) |
| 55 to 64 Years | 30 (32.3%) | 70 (71.4%) |
| 65 to 74 Years | 53 (36.8%) | 11 (8.5%) |
| 75 Years and over | 6 (14.6%) | 6 (14.0%) |
| Total | 331 (33.6%) | 447 (40.5%) |
Income Above Poverty by Sex and Age in Manchester
According to the poverty statistics in Manchester, males aged 12 to 14 years and females aged 65 to 74 years are the age groups that are most secure financially, with 100.0% of males and 91.5% of females in these age groups living above the poverty line.
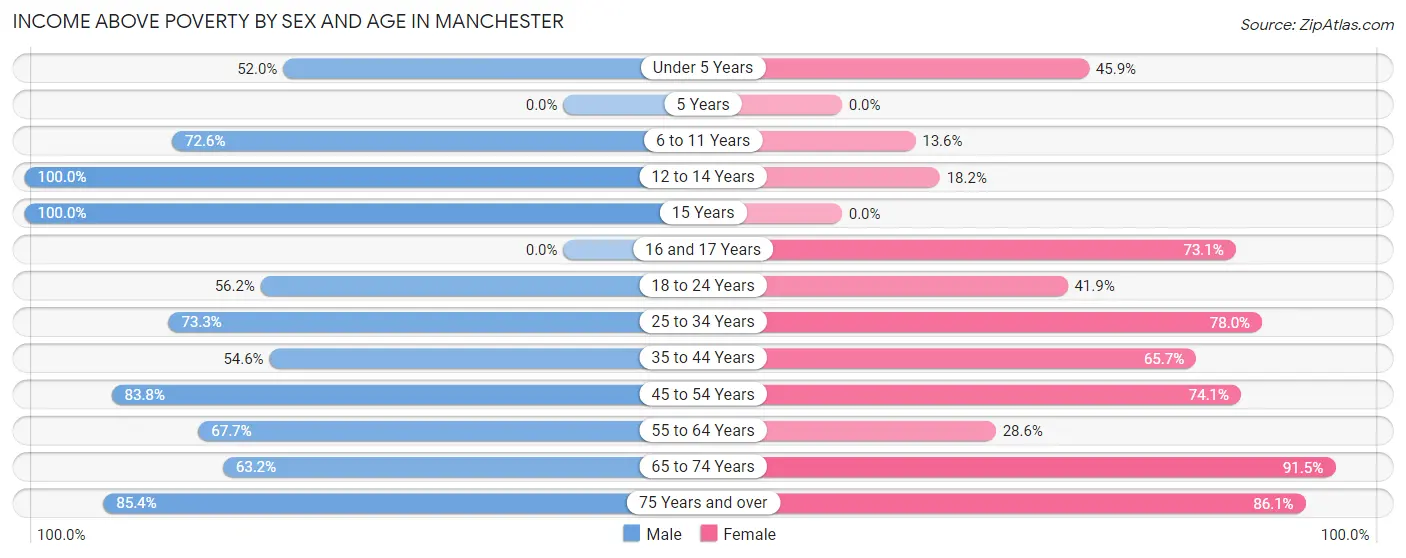
| Age Bracket | Male | Female |
| Under 5 Years | 52 (52.0%) | 50 (45.9%) |
| 5 Years | 0 (0.0%) | 0 (0.0%) |
| 6 to 11 Years | 69 (72.6%) | 9 (13.6%) |
| 12 to 14 Years | 36 (100.0%) | 4 (18.2%) |
| 15 Years | 7 (100.0%) | 0 (0.0%) |
| 16 and 17 Years | 0 (0.0%) | 19 (73.1%) |
| 18 to 24 Years | 50 (56.2%) | 62 (41.9%) |
| 25 to 34 Years | 107 (73.3%) | 177 (78.0%) |
| 35 to 44 Years | 60 (54.5%) | 71 (65.7%) |
| 45 to 54 Years | 83 (83.8%) | 80 (74.1%) |
| 55 to 64 Years | 63 (67.7%) | 28 (28.6%) |
| 65 to 74 Years | 91 (63.2%) | 119 (91.5%) |
| 75 Years and over | 35 (85.4%) | 37 (86.1%) |
| Total | 653 (66.4%) | 656 (59.5%) |
Income Below Poverty Among Married-Couple Families in Manchester
The poverty statistics for married-couple families in Manchester show that 13.1% or 41 of the total 314 families live below the poverty line. Families with 3 or 4 children have the highest poverty rate of 43.8%, comprising of 14 families. On the other hand, families with no children have the lowest poverty rate of 0.0%, which includes 0 families.
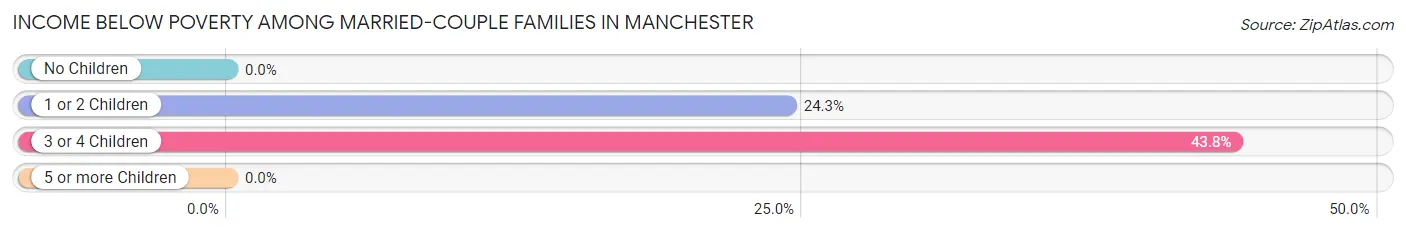
| Children | Above Poverty | Below Poverty |
| No Children | 171 (100.0%) | 0 (0.0%) |
| 1 or 2 Children | 84 (75.7%) | 27 (24.3%) |
| 3 or 4 Children | 18 (56.2%) | 14 (43.8%) |
| 5 or more Children | 0 (0.0%) | 0 (0.0%) |
| Total | 273 (86.9%) | 41 (13.1%) |
Income Below Poverty Among Single-Parent Households in Manchester
According to the poverty data in Manchester, 59.0% or 49 single-father households and 60.6% or 77 single-mother households are living below the poverty line. Among single-father households, those with 1 or 2 children have the highest poverty rate, with 49 households (60.5%) experiencing poverty. Likewise, among single-mother households, those with 3 or 4 children have the highest poverty rate, with 4 households (100.0%) falling below the poverty line.
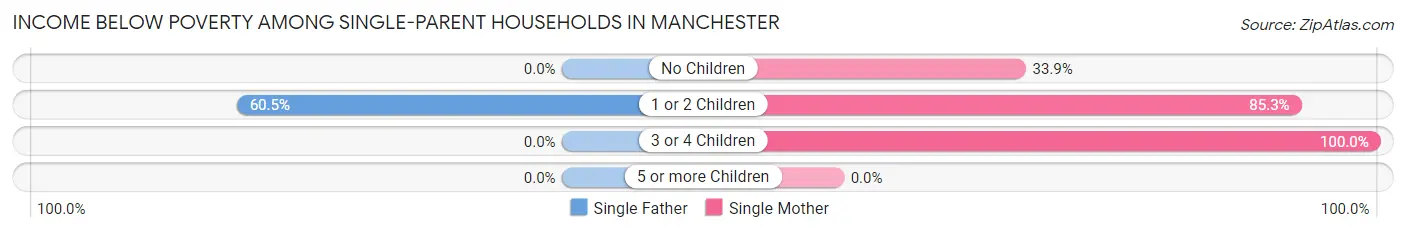
| Children | Single Father | Single Mother |
| No Children | 0 (0.0%) | 21 (33.9%) |
| 1 or 2 Children | 49 (60.5%) | 52 (85.3%) |
| 3 or 4 Children | 0 (0.0%) | 4 (100.0%) |
| 5 or more Children | 0 (0.0%) | 0 (0.0%) |
| Total | 49 (59.0%) | 77 (60.6%) |
Income Below Poverty Among Married-Couple vs Single-Parent Households in Manchester
The poverty data for Manchester shows that 41 of the married-couple family households (13.1%) and 126 of the single-parent households (60.0%) are living below the poverty level. Within the married-couple family households, those with 3 or 4 children have the highest poverty rate, with 14 households (43.8%) falling below the poverty line. Among the single-parent households, those with 3 or 4 children have the highest poverty rate, with 4 household (100.0%) living below poverty.
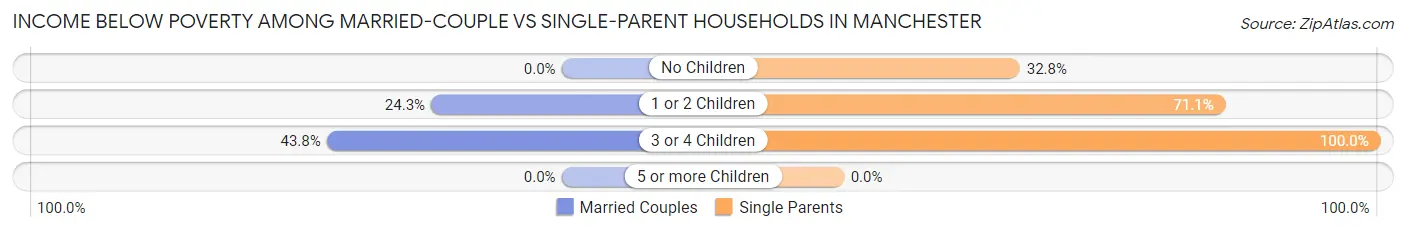
| Children | Married-Couple Families | Single-Parent Households |
| No Children | 0 (0.0%) | 21 (32.8%) |
| 1 or 2 Children | 27 (24.3%) | 101 (71.1%) |
| 3 or 4 Children | 14 (43.8%) | 4 (100.0%) |
| 5 or more Children | 0 (0.0%) | 0 (0.0%) |
| Total | 41 (13.1%) | 126 (60.0%) |
Race in Manchester
The most populous races in Manchester are White / Caucasian (2,076 | 98.4%), Hispanic or Latino (54 | 2.6%), and Two or more Races (33 | 1.6%).
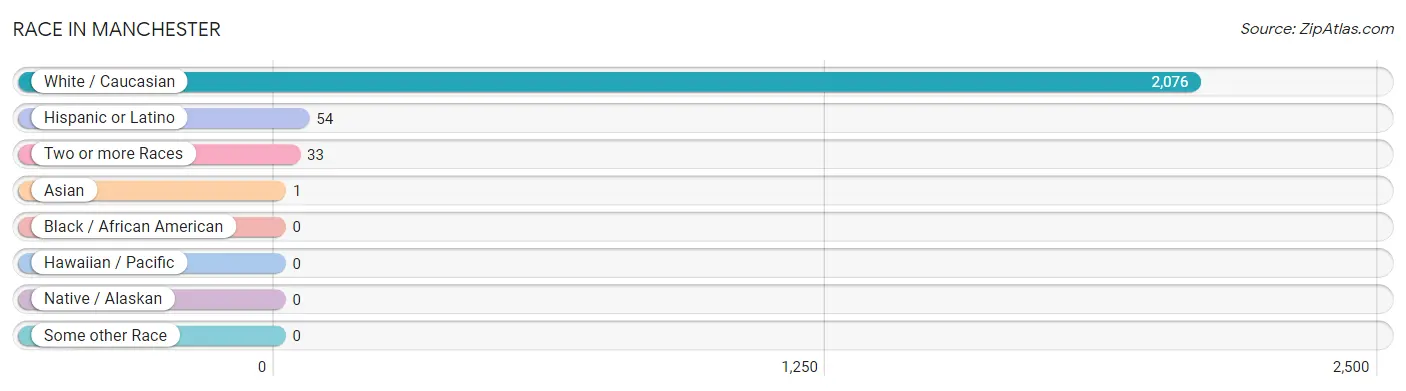
| Race | # Population | % Population |
| Asian | 1 | 0.1% |
| Black / African American | 0 | 0.0% |
| Hawaiian / Pacific | 0 | 0.0% |
| Hispanic or Latino | 54 | 2.6% |
| Native / Alaskan | 0 | 0.0% |
| White / Caucasian | 2,076 | 98.4% |
| Two or more Races | 33 | 1.6% |
| Some other Race | 0 | 0.0% |
| Total | 2,110 | 100.0% |
Ancestry in Manchester
The most populous ancestries reported in Manchester are Irish (240 | 11.4%), German (222 | 10.5%), American (85 | 4.0%), French (79 | 3.7%), and Mexican (54 | 2.6%), together accounting for 32.2% of all Manchester residents.
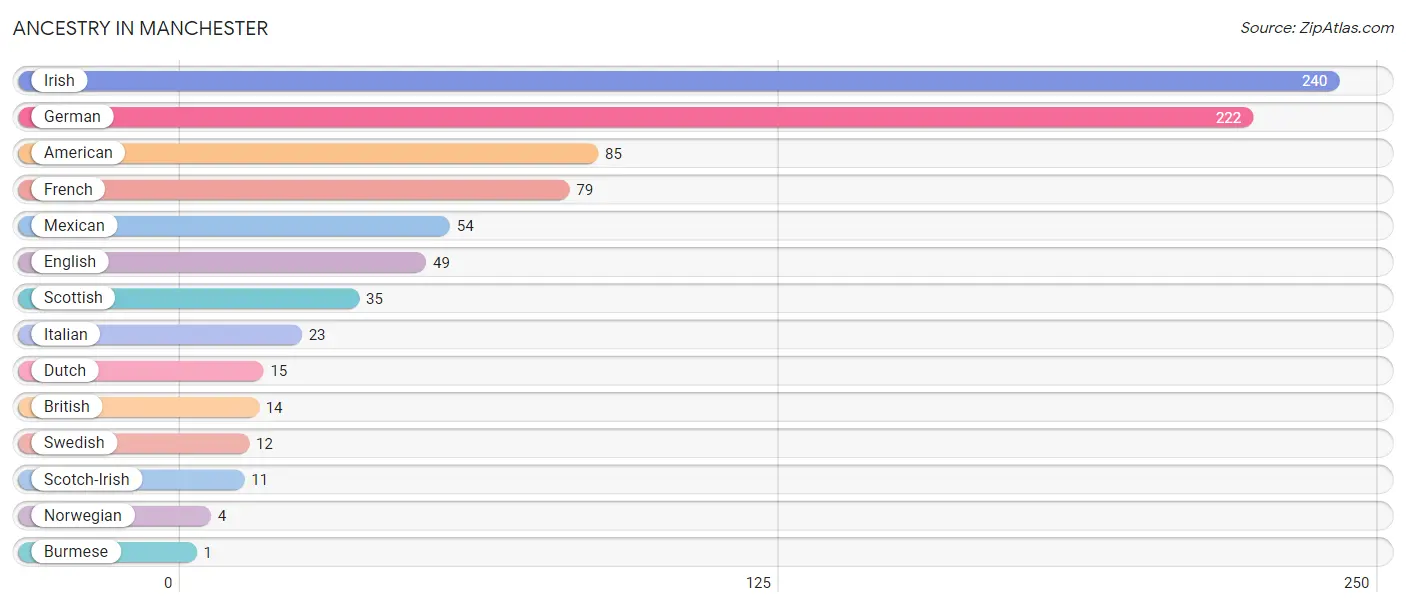
| Ancestry | # Population | % Population |
| American | 85 | 4.0% |
| British | 14 | 0.7% |
| Burmese | 1 | 0.1% |
| Dutch | 15 | 0.7% |
| English | 49 | 2.3% |
| French | 79 | 3.7% |
| German | 222 | 10.5% |
| Irish | 240 | 11.4% |
| Italian | 23 | 1.1% |
| Mexican | 54 | 2.6% |
| Norwegian | 4 | 0.2% |
| Scotch-Irish | 11 | 0.5% |
| Scottish | 35 | 1.7% |
| Swedish | 12 | 0.6% | View All 14 Rows |
Immigrants in Manchester
The most numerous immigrant groups reported in Manchester came from Asia (1 | 0.1%), Eastern Asia (1 | 0.1%), and Korea (1 | 0.1%), together accounting for 0.2% of all Manchester residents.
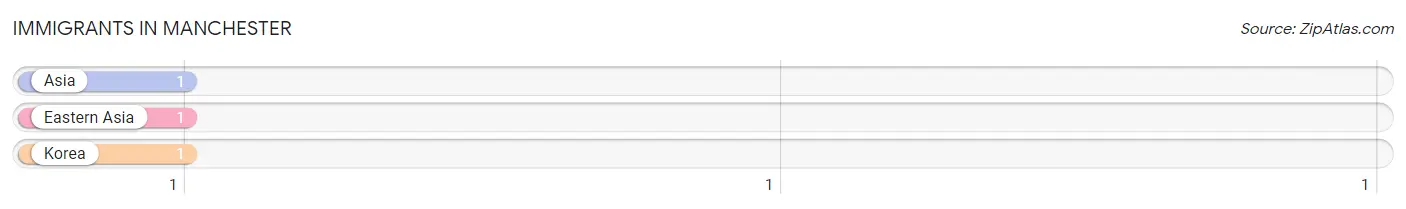
| Immigration Origin | # Population | % Population |
| Asia | 1 | 0.1% |
| Eastern Asia | 1 | 0.1% |
| Korea | 1 | 0.1% | View All 3 Rows |
Sex and Age in Manchester
Sex and Age in Manchester
The most populous age groups in Manchester are Under 5 Years (100 | 9.9%) for men and 30 to 34 Years (145 | 13.2%) for women.
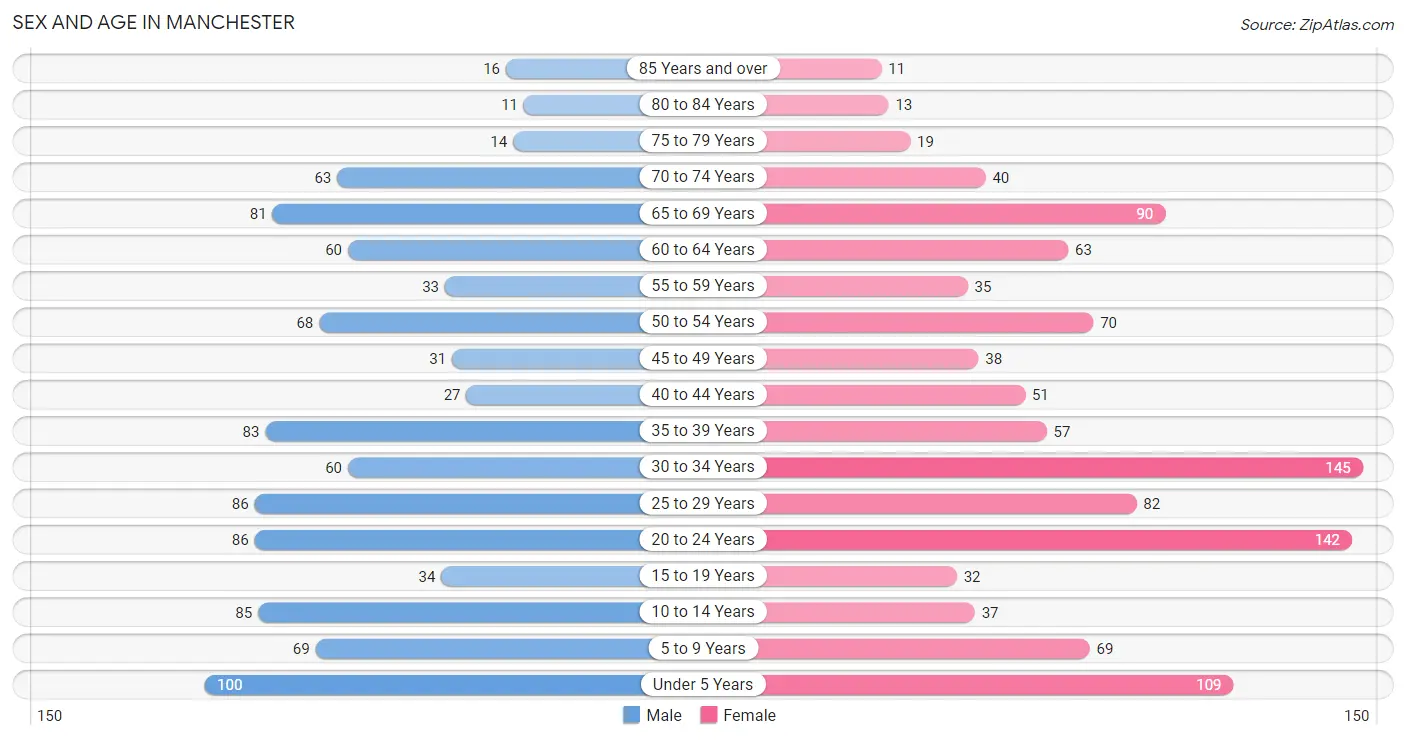
| Age Bracket | Male | Female |
| Under 5 Years | 100 (9.9%) | 109 (9.9%) |
| 5 to 9 Years | 69 (6.9%) | 69 (6.3%) |
| 10 to 14 Years | 85 (8.4%) | 37 (3.4%) |
| 15 to 19 Years | 34 (3.4%) | 32 (2.9%) |
| 20 to 24 Years | 86 (8.5%) | 142 (12.9%) |
| 25 to 29 Years | 86 (8.5%) | 82 (7.4%) |
| 30 to 34 Years | 60 (6.0%) | 145 (13.2%) |
| 35 to 39 Years | 83 (8.2%) | 57 (5.2%) |
| 40 to 44 Years | 27 (2.7%) | 51 (4.6%) |
| 45 to 49 Years | 31 (3.1%) | 38 (3.5%) |
| 50 to 54 Years | 68 (6.8%) | 70 (6.4%) |
| 55 to 59 Years | 33 (3.3%) | 35 (3.2%) |
| 60 to 64 Years | 60 (6.0%) | 63 (5.7%) |
| 65 to 69 Years | 81 (8.0%) | 90 (8.2%) |
| 70 to 74 Years | 63 (6.3%) | 40 (3.6%) |
| 75 to 79 Years | 14 (1.4%) | 19 (1.7%) |
| 80 to 84 Years | 11 (1.1%) | 13 (1.2%) |
| 85 Years and over | 16 (1.6%) | 11 (1.0%) |
| Total | 1,007 (100.0%) | 1,103 (100.0%) |
Families and Households in Manchester
Median Family Size in Manchester
The median family size in Manchester is 3.02 persons per family, with married-couple families (314 | 59.9%) accounting for the largest median family size of 3.43 persons per family. On the other hand, single female/mother families (127 | 24.2%) represent the smallest median family size with 2.28 persons per family.
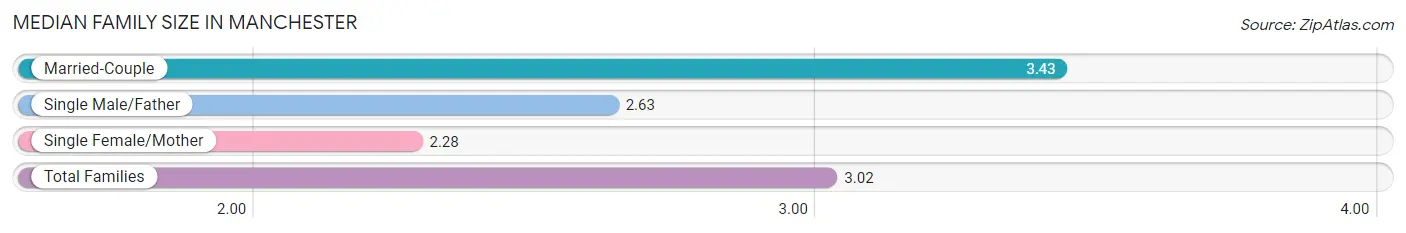
| Family Type | # Families | Family Size |
| Married-Couple | 314 (59.9%) | 3.43 |
| Single Male/Father | 83 (15.8%) | 2.63 |
| Single Female/Mother | 127 (24.2%) | 2.28 |
| Total Families | 524 (100.0%) | 3.02 |
Median Household Size in Manchester
The median household size in Manchester is 2.69 persons per household, with single male/father households (83 | 10.6%) accounting for the largest median household size of 3.6 persons per household. non-family households (260 | 33.2%) represent the smallest median household size with 1.48 persons per household.
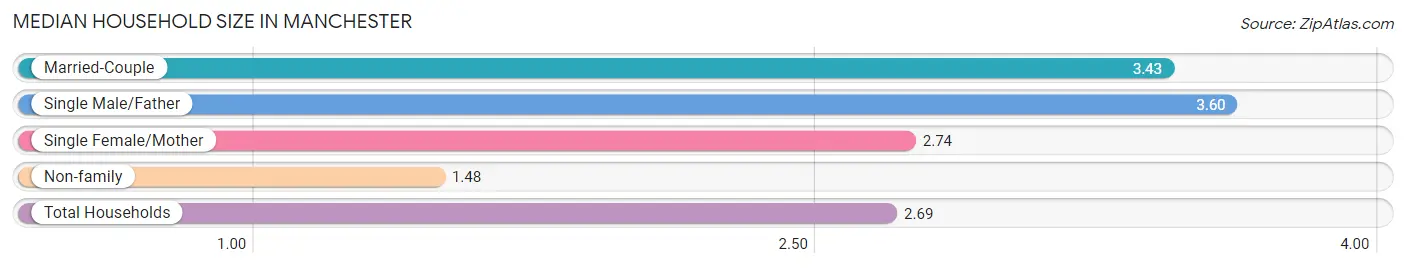
| Household Type | # Households | Household Size |
| Married-Couple | 314 (40.1%) | 3.43 |
| Single Male/Father | 83 (10.6%) | 3.60 |
| Single Female/Mother | 127 (16.2%) | 2.74 |
| Non-family | 260 (33.2%) | 1.48 |
| Total Households | 784 (100.0%) | 2.69 |
Household Size by Marriage Status in Manchester
Out of a total of 784 households in Manchester, 524 (66.8%) are family households, while 260 (33.2%) are nonfamily households. The most numerous type of family households are 2-person households, comprising 201, and the most common type of nonfamily households are 1-person households, comprising 175.
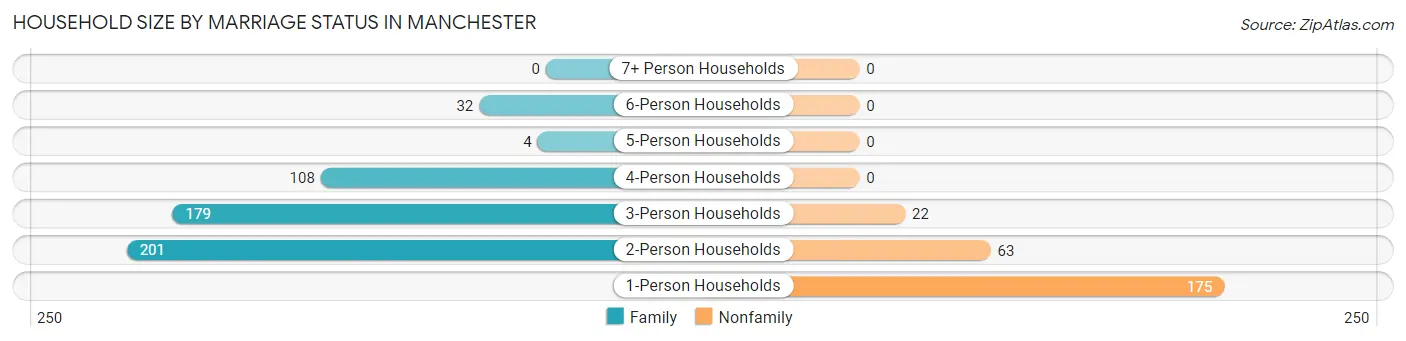
| Household Size | Family Households | Nonfamily Households |
| 1-Person Households | - | 175 (22.3%) |
| 2-Person Households | 201 (25.6%) | 63 (8.0%) |
| 3-Person Households | 179 (22.8%) | 22 (2.8%) |
| 4-Person Households | 108 (13.8%) | 0 (0.0%) |
| 5-Person Households | 4 (0.5%) | 0 (0.0%) |
| 6-Person Households | 32 (4.1%) | 0 (0.0%) |
| 7+ Person Households | 0 (0.0%) | 0 (0.0%) |
| Total | 524 (66.8%) | 260 (33.2%) |
Female Fertility in Manchester
Fertility by Age in Manchester
Average fertility rate in Manchester is 102.0 births per 1,000 women. Women in the age bracket of 20 to 34 years have the highest fertility rate with 157.0 births per 1,000 women. Women in the age bracket of 20 to 34 years acount for 100.0% of all women with births.
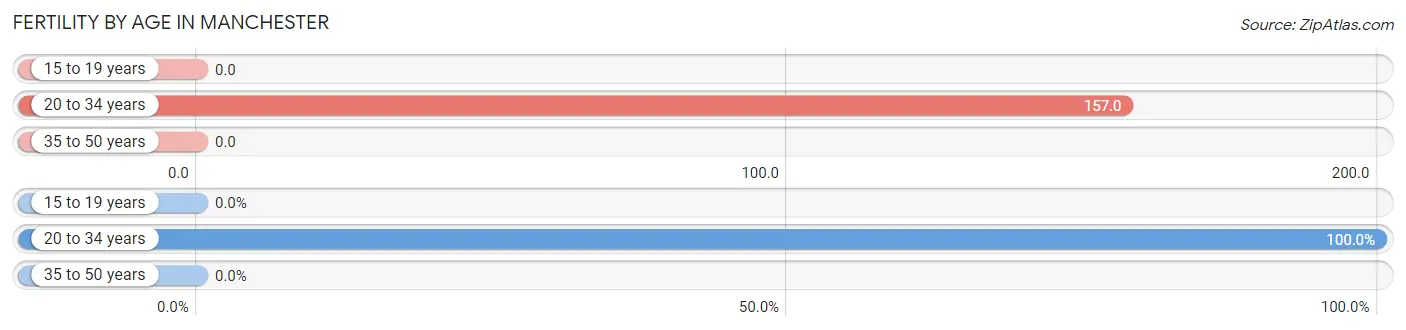
| Age Bracket | Women with Births | Births / 1,000 Women |
| 15 to 19 years | 0 (0.0%) | 0.0 |
| 20 to 34 years | 58 (100.0%) | 157.0 |
| 35 to 50 years | 0 (0.0%) | 0.0 |
| Total | 58 (100.0%) | 102.0 |
Fertility by Age by Marriage Status in Manchester
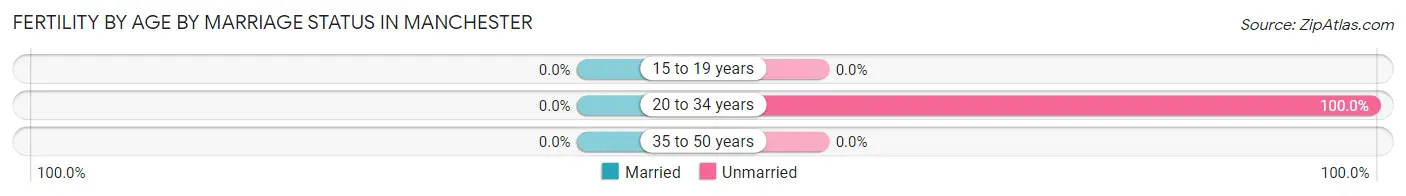
| Age Bracket | Married | Unmarried |
| 15 to 19 years | 0 (0.0%) | 0 (0.0%) |
| 20 to 34 years | 0 (0.0%) | 58 (100.0%) |
| 35 to 50 years | 0 (0.0%) | 0 (0.0%) |
| Total | 0 (0.0%) | 58 (100.0%) |
Fertility by Education in Manchester
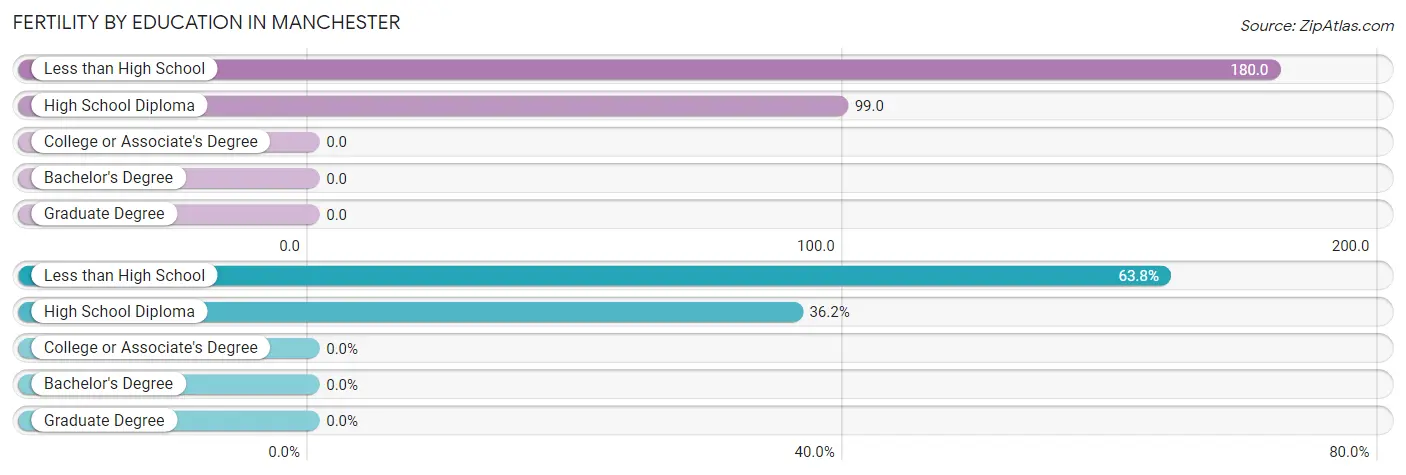
| Educational Attainment | Women with Births | Births / 1,000 Women |
| Less than High School | 37 (63.8%) | 180.0 |
| High School Diploma | 21 (36.2%) | 99.0 |
| College or Associate's Degree | 0 (0.0%) | 0.0 |
| Bachelor's Degree | 0 (0.0%) | 0.0 |
| Graduate Degree | 0 (0.0%) | 0.0 |
| Total | 58 (100.0%) | 102.0 |
Fertility by Education by Marriage Status in Manchester
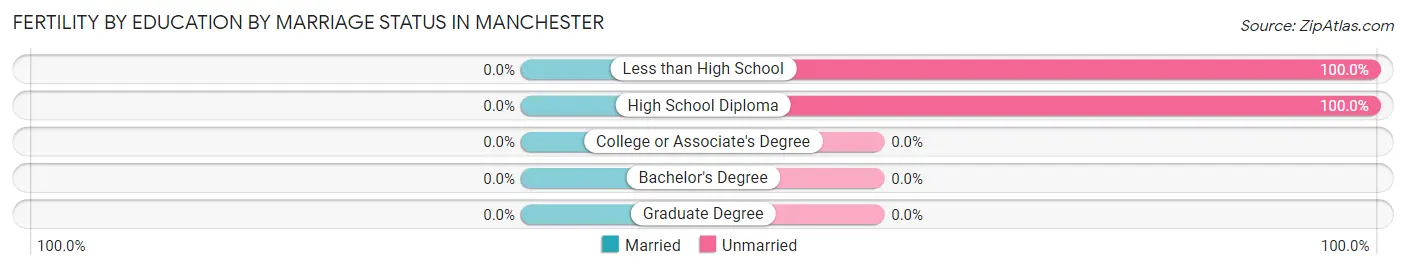
| Educational Attainment | Married | Unmarried |
| Less than High School | 0 (0.0%) | 37 (100.0%) |
| High School Diploma | 0 (0.0%) | 21 (100.0%) |
| College or Associate's Degree | 0 (0.0%) | 0 (0.0%) |
| Bachelor's Degree | 0 (0.0%) | 0 (0.0%) |
| Graduate Degree | 0 (0.0%) | 0 (0.0%) |
| Total | 0 (0.0%) | 58 (100.0%) |
Employment Characteristics in Manchester
Employment by Class of Employer in Manchester
Among the 761 employed individuals in Manchester, private company employees (670 | 88.0%), state government employees (21 | 2.8%), and federal government employees (21 | 2.8%) make up the most common classes of employment.
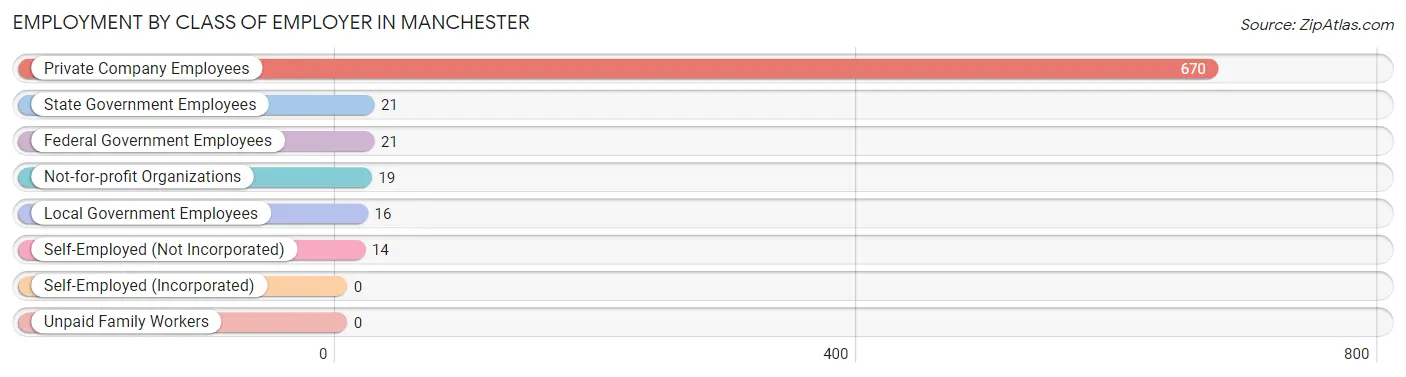
| Employer Class | # Employees | % Employees |
| Private Company Employees | 670 | 88.0% |
| Self-Employed (Incorporated) | 0 | 0.0% |
| Self-Employed (Not Incorporated) | 14 | 1.8% |
| Not-for-profit Organizations | 19 | 2.5% |
| Local Government Employees | 16 | 2.1% |
| State Government Employees | 21 | 2.8% |
| Federal Government Employees | 21 | 2.8% |
| Unpaid Family Workers | 0 | 0.0% |
| Total | 761 | 100.0% |
Employment Status by Age in Manchester
According to the labor force statistics for Manchester, out of the total population over 16 years of age (1,634), 52.8% or 863 individuals are in the labor force, with 10.8% or 93 of them unemployed. The age group with the highest labor force participation rate is 30 to 34 years, with 80.0% or 164 individuals in the labor force. Within the labor force, the 25 to 29 years age range has the highest percentage of unemployed individuals, with 29.1% or 39 of them being unemployed.
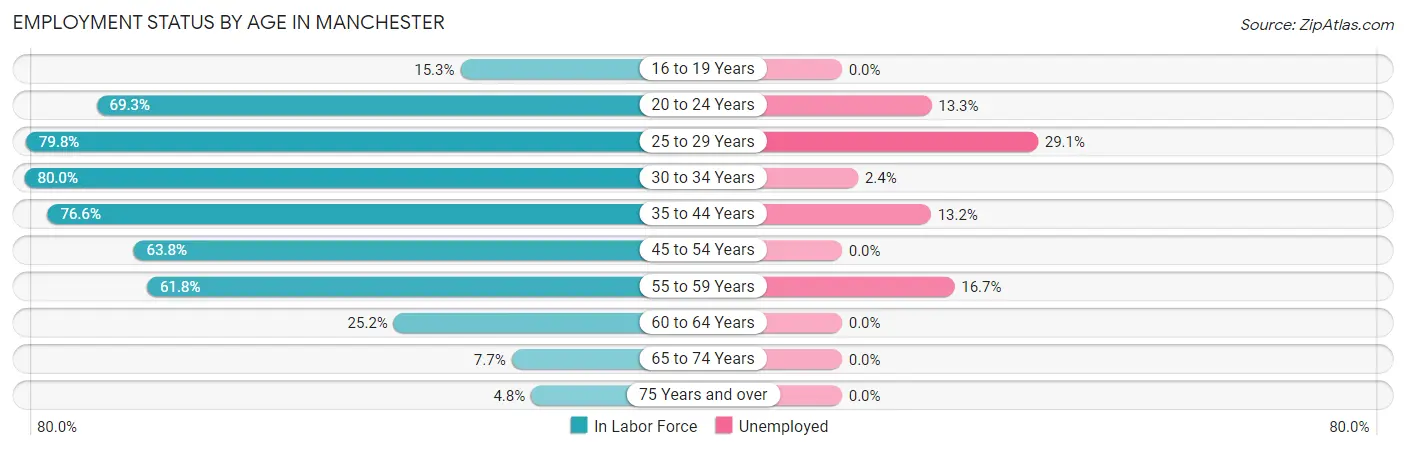
| Age Bracket | In Labor Force | Unemployed |
| 16 to 19 Years | 9 (15.3%) | 0 (0.0%) |
| 20 to 24 Years | 158 (69.3%) | 21 (13.3%) |
| 25 to 29 Years | 134 (79.8%) | 39 (29.1%) |
| 30 to 34 Years | 164 (80.0%) | 4 (2.4%) |
| 35 to 44 Years | 167 (76.6%) | 22 (13.2%) |
| 45 to 54 Years | 132 (63.8%) | 0 (0.0%) |
| 55 to 59 Years | 42 (61.8%) | 7 (16.7%) |
| 60 to 64 Years | 31 (25.2%) | 0 (0.0%) |
| 65 to 74 Years | 21 (7.7%) | 0 (0.0%) |
| 75 Years and over | 4 (4.8%) | 0 (0.0%) |
| Total | 863 (52.8%) | 93 (10.8%) |
Employment Status by Educational Attainment in Manchester
According to labor force statistics for Manchester, 67.7% of individuals (670) out of the total population between 25 and 64 years of age (989) are in the labor force, with 10.7% or 72 of them being unemployed. The group with the highest labor force participation rate are those with the educational attainment of bachelor's degree or higher, with 100.0% or 13 individuals in the labor force. Within the labor force, individuals with less than high school education have the highest percentage of unemployment, with 35.0% or 57 of them being unemployed.
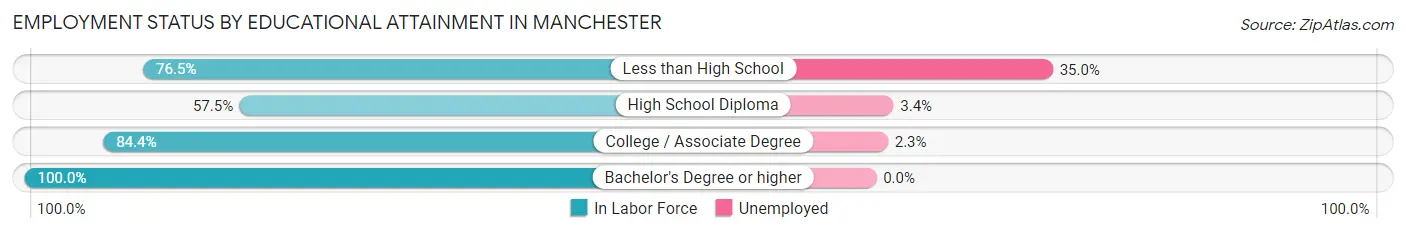
| Educational Attainment | In Labor Force | Unemployed |
| Less than High School | 163 (76.5%) | 75 (35.0%) |
| High School Diploma | 321 (57.5%) | 19 (3.4%) |
| College / Associate Degree | 173 (84.4%) | 5 (2.3%) |
| Bachelor's Degree or higher | 13 (100.0%) | 0 (0.0%) |
| Total | 670 (67.7%) | 106 (10.7%) |
Employment Occupations by Sex in Manchester
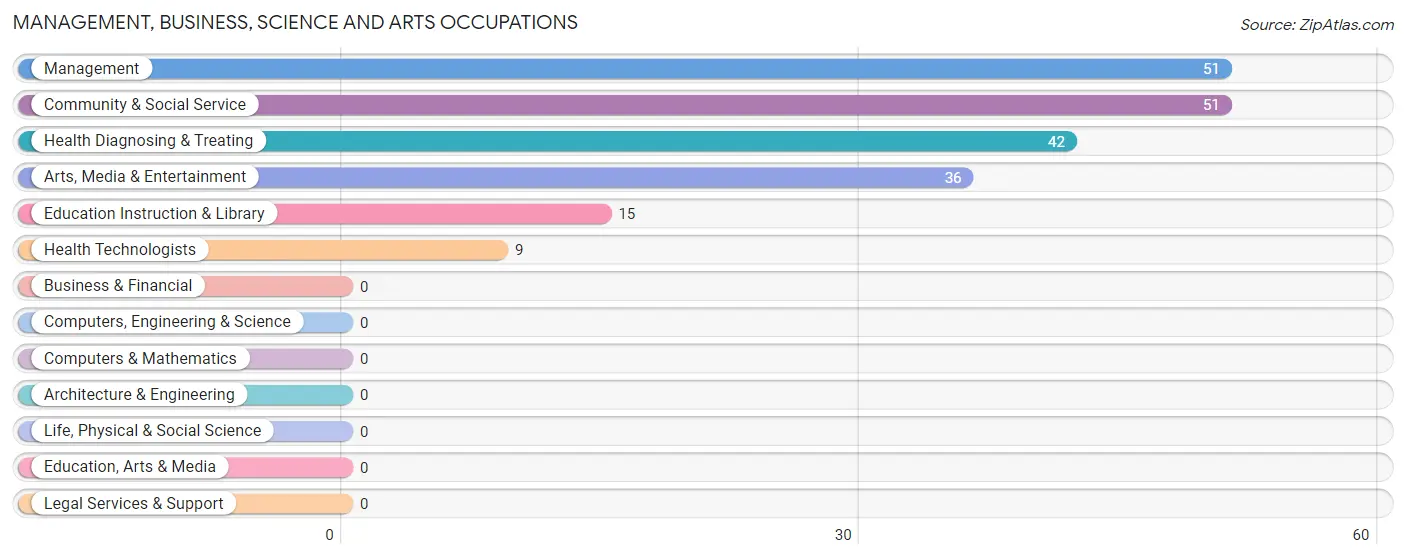
Management, Business, Science and Arts Occupations
The most common Management, Business, Science and Arts occupations in Manchester are Management (51 | 6.6%), Community & Social Service (51 | 6.6%), Health Diagnosing & Treating (42 | 5.5%), Arts, Media & Entertainment (36 | 4.7%), and Education Instruction & Library (15 | 1.9%).
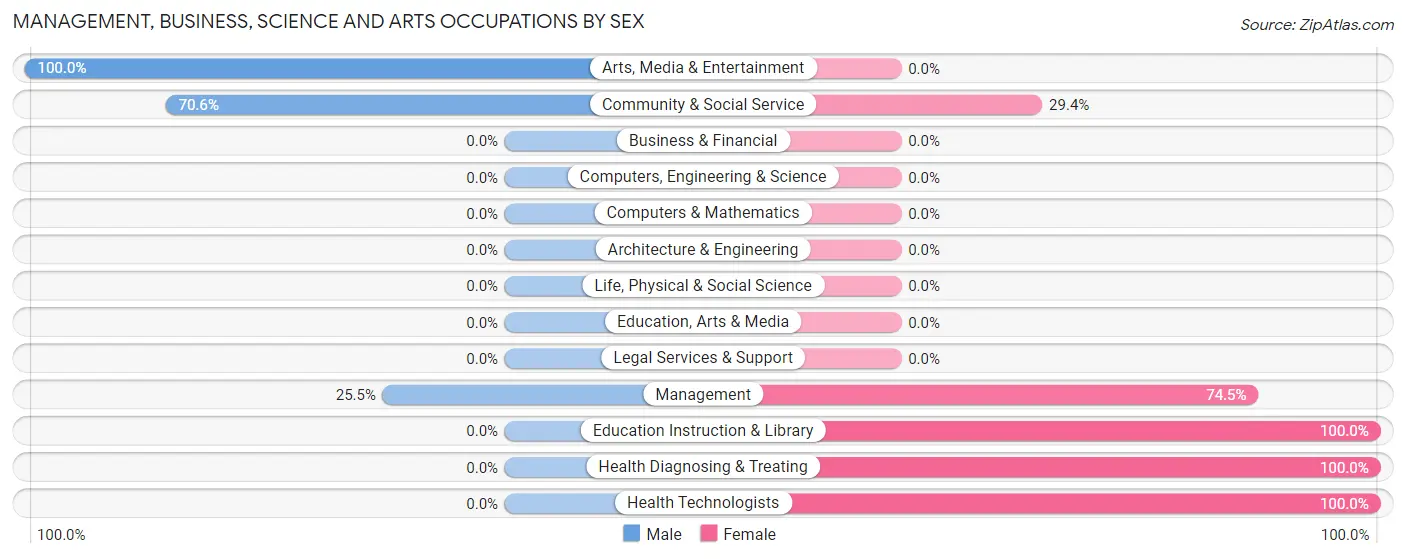
Management, Business, Science and Arts Occupations by Sex
Within the Management, Business, Science and Arts occupations in Manchester, the most male-oriented occupations are Arts, Media & Entertainment (100.0%), Community & Social Service (70.6%), and Management (25.5%), while the most female-oriented occupations are Education Instruction & Library (100.0%), Health Diagnosing & Treating (100.0%), and Health Technologists (100.0%).
| Occupation | Male | Female |
| Management | 13 (25.5%) | 38 (74.5%) |
| Business & Financial | 0 (0.0%) | 0 (0.0%) |
| Computers, Engineering & Science | 0 (0.0%) | 0 (0.0%) |
| Computers & Mathematics | 0 (0.0%) | 0 (0.0%) |
| Architecture & Engineering | 0 (0.0%) | 0 (0.0%) |
| Life, Physical & Social Science | 0 (0.0%) | 0 (0.0%) |
| Community & Social Service | 36 (70.6%) | 15 (29.4%) |
| Education, Arts & Media | 0 (0.0%) | 0 (0.0%) |
| Legal Services & Support | 0 (0.0%) | 0 (0.0%) |
| Education Instruction & Library | 0 (0.0%) | 15 (100.0%) |
| Arts, Media & Entertainment | 36 (100.0%) | 0 (0.0%) |
| Health Diagnosing & Treating | 0 (0.0%) | 42 (100.0%) |
| Health Technologists | 0 (0.0%) | 9 (100.0%) |
| Total (Category) | 49 (34.0%) | 95 (66.0%) |
| Total (Overall) | 310 (40.3%) | 459 (59.7%) |
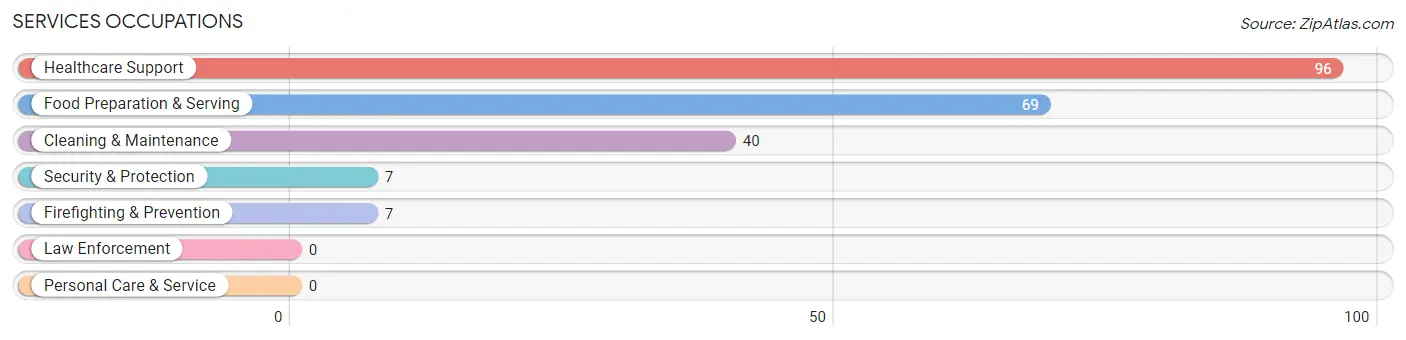
Services Occupations
The most common Services occupations in Manchester are Healthcare Support (96 | 12.5%), Food Preparation & Serving (69 | 9.0%), Cleaning & Maintenance (40 | 5.2%), Security & Protection (7 | 0.9%), and Firefighting & Prevention (7 | 0.9%).
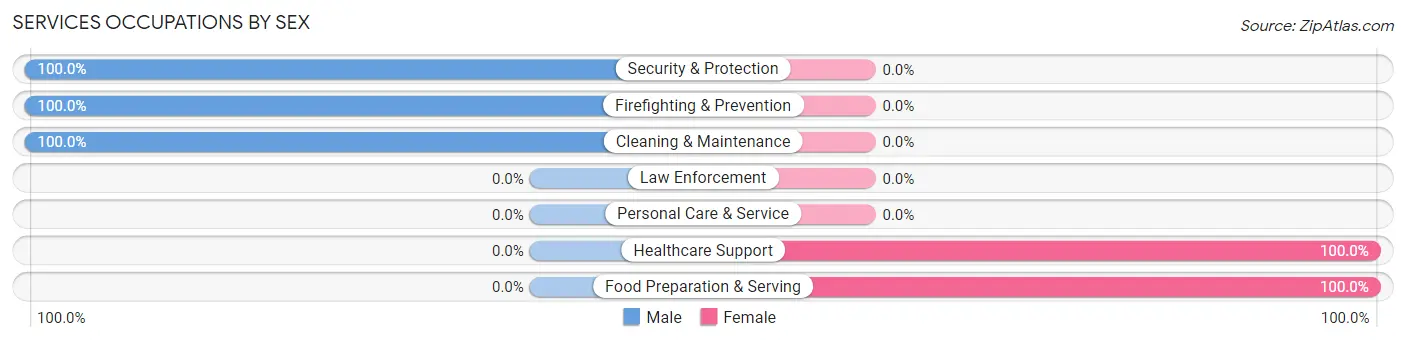
Services Occupations by Sex
Within the Services occupations in Manchester, the most male-oriented occupations are Security & Protection (100.0%), Firefighting & Prevention (100.0%), and Cleaning & Maintenance (100.0%), while the most female-oriented occupations are Healthcare Support (100.0%), and Food Preparation & Serving (100.0%).
| Occupation | Male | Female |
| Healthcare Support | 0 (0.0%) | 96 (100.0%) |
| Security & Protection | 7 (100.0%) | 0 (0.0%) |
| Firefighting & Prevention | 7 (100.0%) | 0 (0.0%) |
| Law Enforcement | 0 (0.0%) | 0 (0.0%) |
| Food Preparation & Serving | 0 (0.0%) | 69 (100.0%) |
| Cleaning & Maintenance | 40 (100.0%) | 0 (0.0%) |
| Personal Care & Service | 0 (0.0%) | 0 (0.0%) |
| Total (Category) | 47 (22.2%) | 165 (77.8%) |
| Total (Overall) | 310 (40.3%) | 459 (59.7%) |
Sales and Office Occupations
The most common Sales and Office occupations in Manchester are Sales & Related (108 | 14.0%), and Office & Administration (40 | 5.2%).
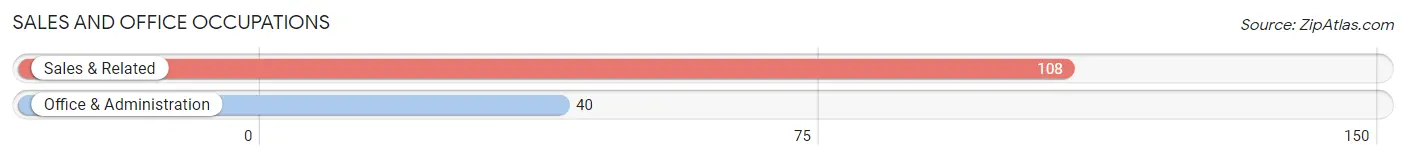
Sales and Office Occupations by Sex
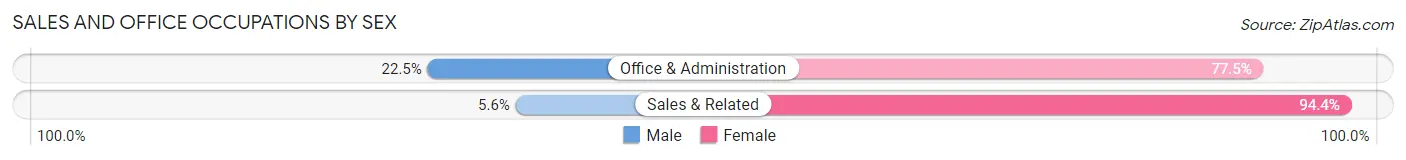
| Occupation | Male | Female |
| Sales & Related | 6 (5.6%) | 102 (94.4%) |
| Office & Administration | 9 (22.5%) | 31 (77.5%) |
| Total (Category) | 15 (10.1%) | 133 (89.9%) |
| Total (Overall) | 310 (40.3%) | 459 (59.7%) |
Natural Resources, Construction and Maintenance Occupations
The most common Natural Resources, Construction and Maintenance occupations in Manchester are Construction & Extraction (39 | 5.1%), and Installation, Maintenance & Repair (15 | 1.9%).
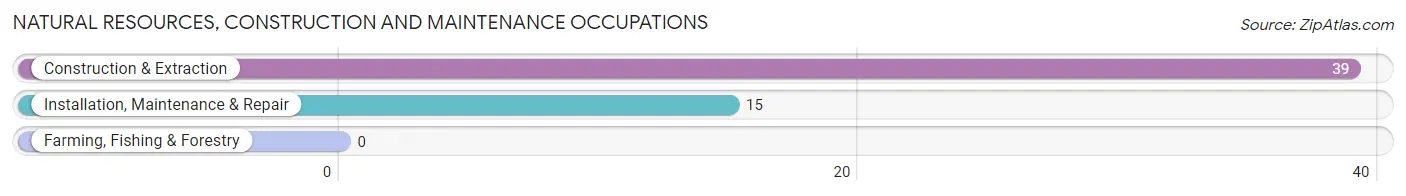
Natural Resources, Construction and Maintenance Occupations by Sex
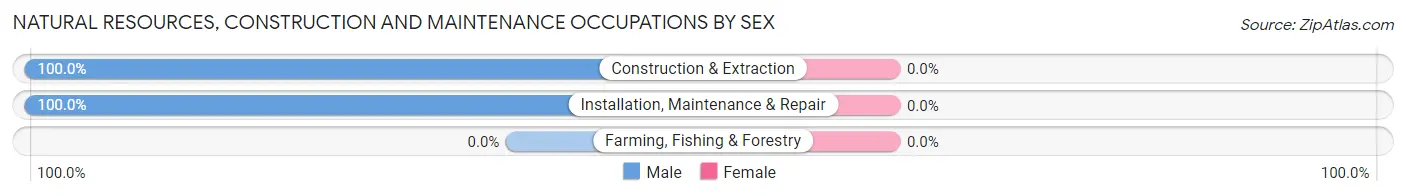
| Occupation | Male | Female |
| Farming, Fishing & Forestry | 0 (0.0%) | 0 (0.0%) |
| Construction & Extraction | 39 (100.0%) | 0 (0.0%) |
| Installation, Maintenance & Repair | 15 (100.0%) | 0 (0.0%) |
| Total (Category) | 54 (100.0%) | 0 (0.0%) |
| Total (Overall) | 310 (40.3%) | 459 (59.7%) |
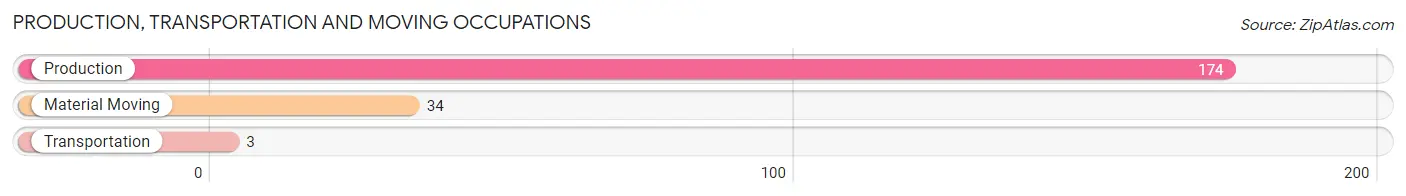
Production, Transportation and Moving Occupations
The most common Production, Transportation and Moving occupations in Manchester are Production (174 | 22.6%), Material Moving (34 | 4.4%), and Transportation (3 | 0.4%).
Production, Transportation and Moving Occupations by Sex
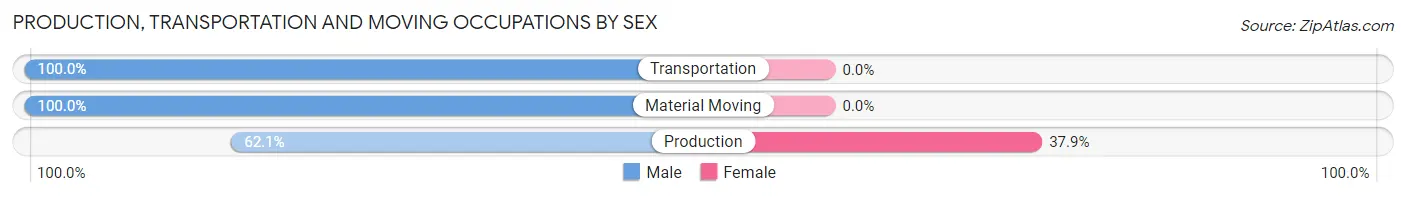
| Occupation | Male | Female |
| Production | 108 (62.1%) | 66 (37.9%) |
| Transportation | 3 (100.0%) | 0 (0.0%) |
| Material Moving | 34 (100.0%) | 0 (0.0%) |
| Total (Category) | 145 (68.7%) | 66 (31.3%) |
| Total (Overall) | 310 (40.3%) | 459 (59.7%) |
Employment Industries by Sex in Manchester
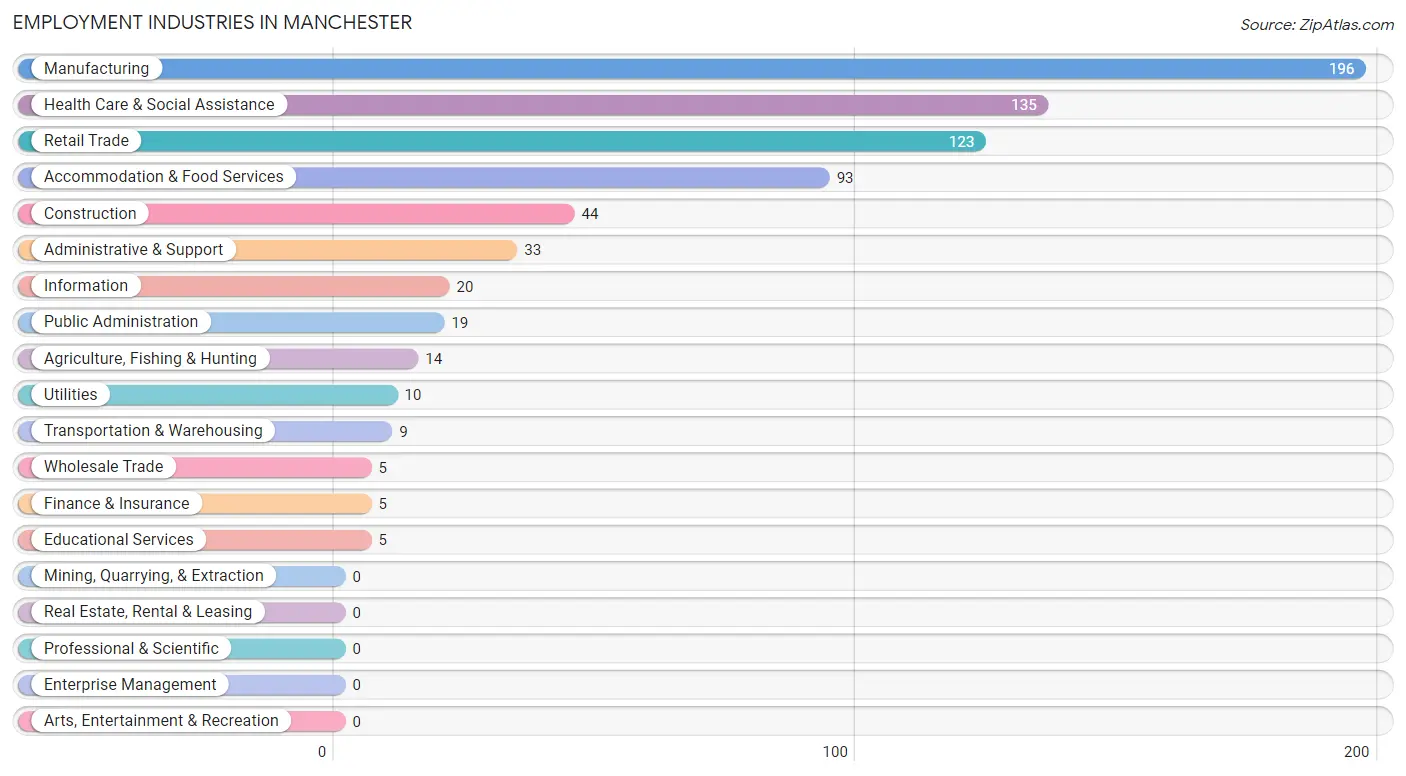
Employment Industries in Manchester
The major employment industries in Manchester include Manufacturing (196 | 25.5%), Health Care & Social Assistance (135 | 17.6%), Retail Trade (123 | 16.0%), Accommodation & Food Services (93 | 12.1%), and Construction (44 | 5.7%).
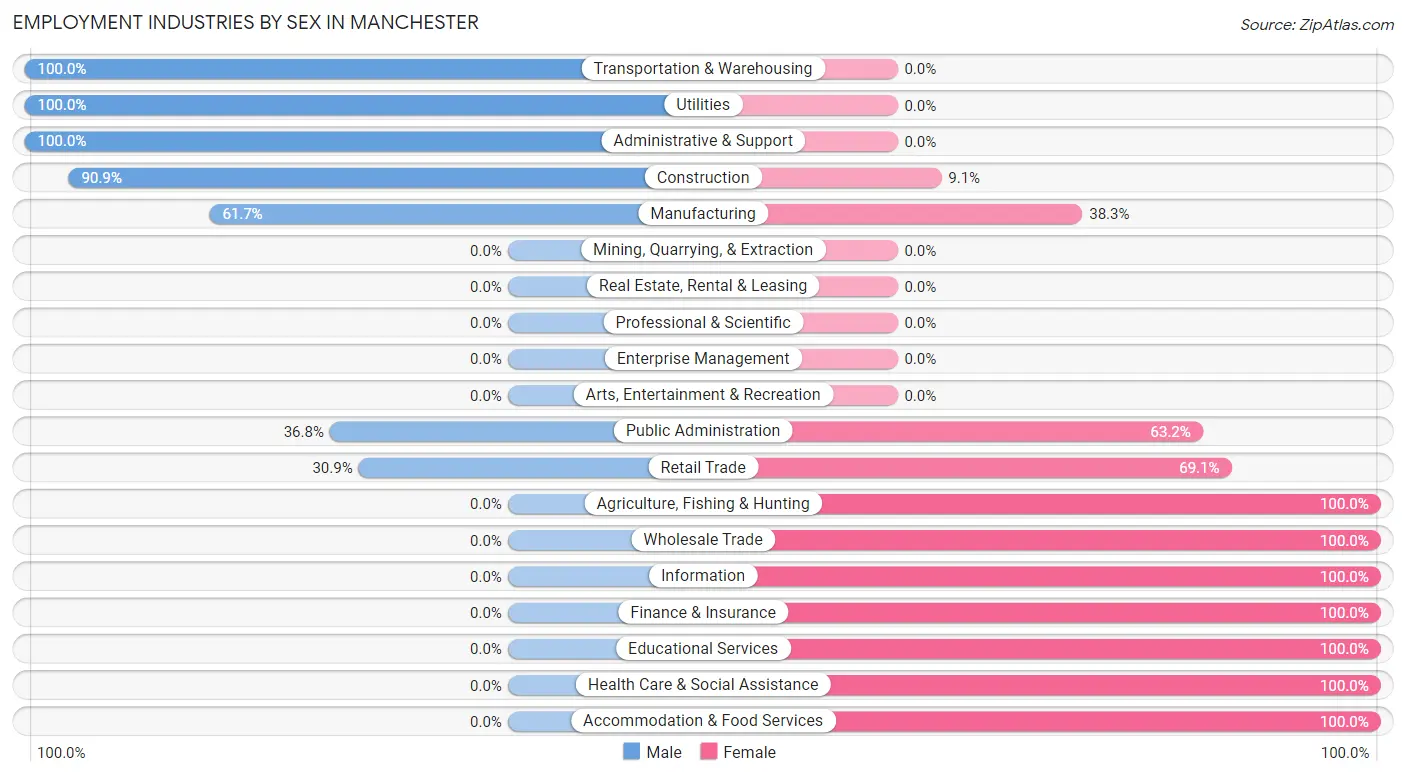
Employment Industries by Sex in Manchester
The Manchester industries that see more men than women are Transportation & Warehousing (100.0%), Utilities (100.0%), and Administrative & Support (100.0%), whereas the industries that tend to have a higher number of women are Agriculture, Fishing & Hunting (100.0%), Wholesale Trade (100.0%), and Information (100.0%).
| Industry | Male | Female |
| Agriculture, Fishing & Hunting | 0 (0.0%) | 14 (100.0%) |
| Mining, Quarrying, & Extraction | 0 (0.0%) | 0 (0.0%) |
| Construction | 40 (90.9%) | 4 (9.1%) |
| Manufacturing | 121 (61.7%) | 75 (38.3%) |
| Wholesale Trade | 0 (0.0%) | 5 (100.0%) |
| Retail Trade | 38 (30.9%) | 85 (69.1%) |
| Transportation & Warehousing | 9 (100.0%) | 0 (0.0%) |
| Utilities | 10 (100.0%) | 0 (0.0%) |
| Information | 0 (0.0%) | 20 (100.0%) |
| Finance & Insurance | 0 (0.0%) | 5 (100.0%) |
| Real Estate, Rental & Leasing | 0 (0.0%) | 0 (0.0%) |
| Professional & Scientific | 0 (0.0%) | 0 (0.0%) |
| Enterprise Management | 0 (0.0%) | 0 (0.0%) |
| Administrative & Support | 33 (100.0%) | 0 (0.0%) |
| Educational Services | 0 (0.0%) | 5 (100.0%) |
| Health Care & Social Assistance | 0 (0.0%) | 135 (100.0%) |
| Arts, Entertainment & Recreation | 0 (0.0%) | 0 (0.0%) |
| Accommodation & Food Services | 0 (0.0%) | 93 (100.0%) |
| Public Administration | 7 (36.8%) | 12 (63.2%) |
| Total | 310 (40.3%) | 459 (59.7%) |
Education in Manchester
School Enrollment in Manchester
The most common levels of schooling among the 388 students in Manchester are elementary school (110 | 28.3%), middle school (94 | 24.2%), and college / undergraduate (82 | 21.1%).
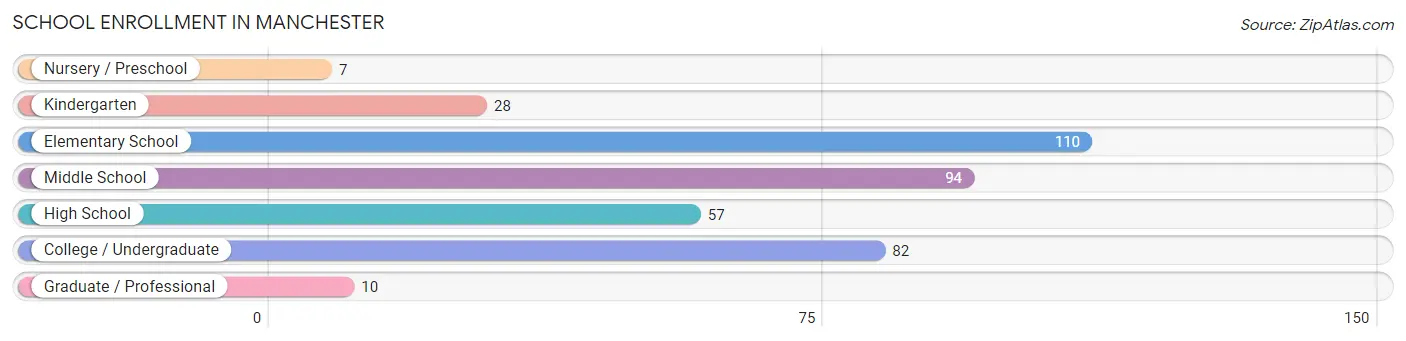
| School Level | # Students | % Students |
| Nursery / Preschool | 7 | 1.8% |
| Kindergarten | 28 | 7.2% |
| Elementary School | 110 | 28.3% |
| Middle School | 94 | 24.2% |
| High School | 57 | 14.7% |
| College / Undergraduate | 82 | 21.1% |
| Graduate / Professional | 10 | 2.6% |
| Total | 388 | 100.0% |
School Enrollment by Age by Funding Source in Manchester
Out of a total of 388 students who are enrolled in schools in Manchester, 30 (7.7%) attend a private institution, while the remaining 358 (92.3%) are enrolled in public schools. The age group of 3 to 4 year olds has the highest likelihood of being enrolled in private schools, with 7 (100.0% in the age bracket) enrolled. Conversely, the age group of 15 to 17 year olds has the lowest likelihood of being enrolled in a private school, with 57 (100.0% in the age bracket) attending a public institution.
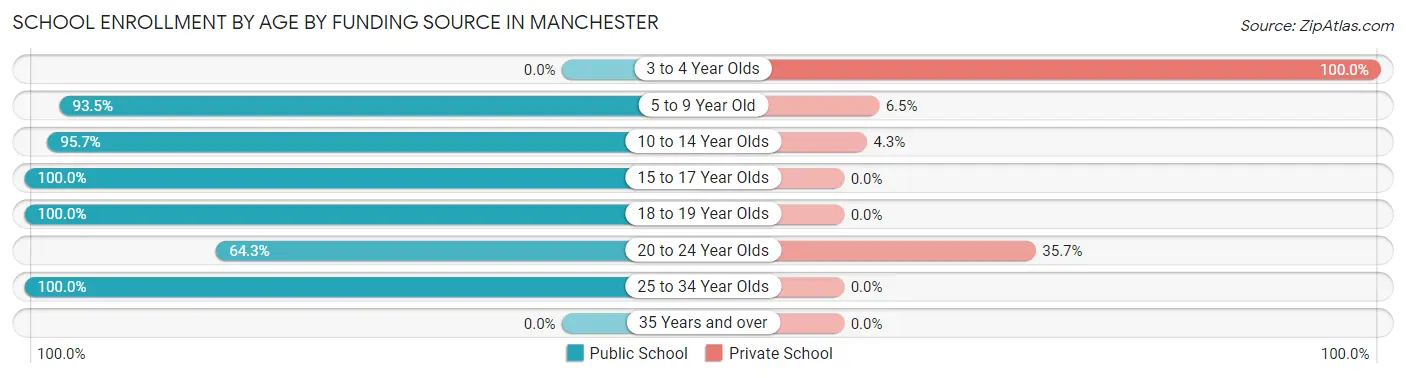
| Age Bracket | Public School | Private School |
| 3 to 4 Year Olds | 0 (0.0%) | 7 (100.0%) |
| 5 to 9 Year Old | 129 (93.5%) | 9 (6.5%) |
| 10 to 14 Year Olds | 90 (95.7%) | 4 (4.3%) |
| 15 to 17 Year Olds | 57 (100.0%) | 0 (0.0%) |
| 18 to 19 Year Olds | 8 (100.0%) | 0 (0.0%) |
| 20 to 24 Year Olds | 18 (64.3%) | 10 (35.7%) |
| 25 to 34 Year Olds | 56 (100.0%) | 0 (0.0%) |
| 35 Years and over | 0 (0.0%) | 0 (0.0%) |
| Total | 358 (92.3%) | 30 (7.7%) |
Educational Attainment by Field of Study in Manchester
Education (34 | 80.9%), visual & performing arts (4 | 9.5%), and arts & humanities (4 | 9.5%) are the most common fields of study among 42 individuals in Manchester who have obtained a bachelor's degree or higher.
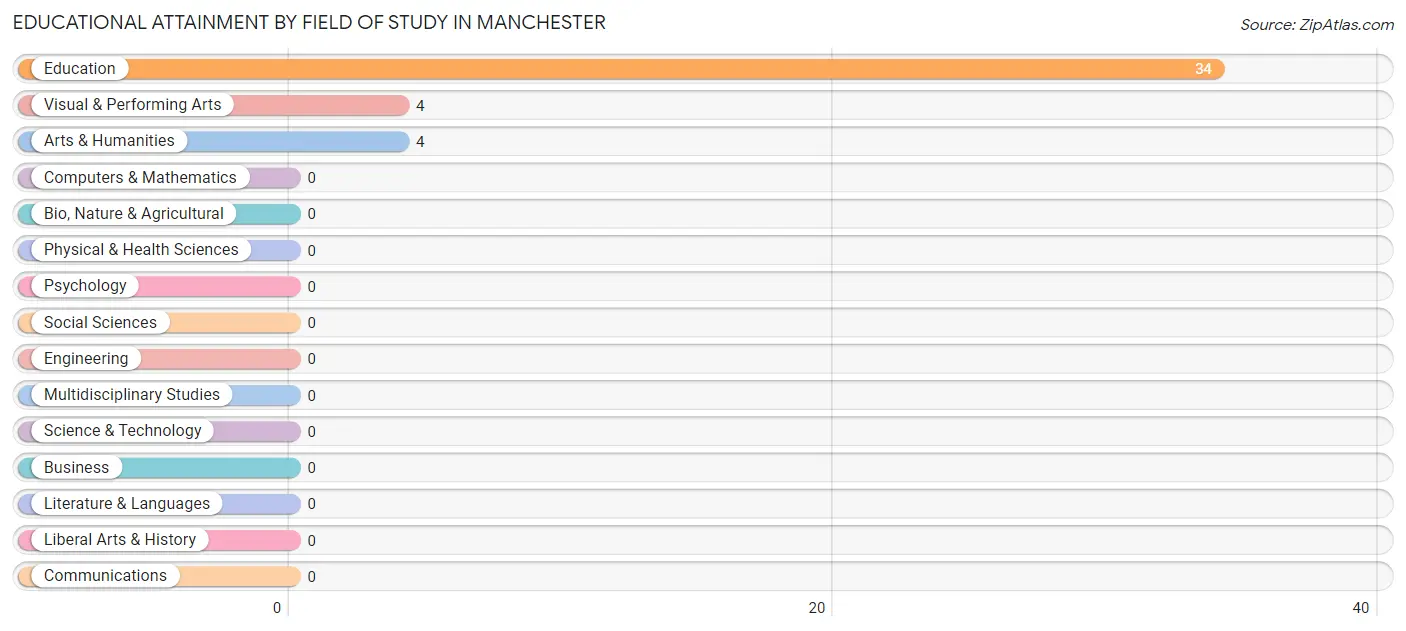
| Field of Study | # Graduates | % Graduates |
| Computers & Mathematics | 0 | 0.0% |
| Bio, Nature & Agricultural | 0 | 0.0% |
| Physical & Health Sciences | 0 | 0.0% |
| Psychology | 0 | 0.0% |
| Social Sciences | 0 | 0.0% |
| Engineering | 0 | 0.0% |
| Multidisciplinary Studies | 0 | 0.0% |
| Science & Technology | 0 | 0.0% |
| Business | 0 | 0.0% |
| Education | 34 | 80.9% |
| Literature & Languages | 0 | 0.0% |
| Liberal Arts & History | 0 | 0.0% |
| Visual & Performing Arts | 4 | 9.5% |
| Communications | 0 | 0.0% |
| Arts & Humanities | 4 | 9.5% |
| Total | 42 | 100.0% |
Transportation & Commute in Manchester
Vehicle Availability by Sex in Manchester
The most prevalent vehicle ownership categories in Manchester are males with 3 vehicles (143, accounting for 47.3%) and females with 3 vehicles (190, making up 31.1%).
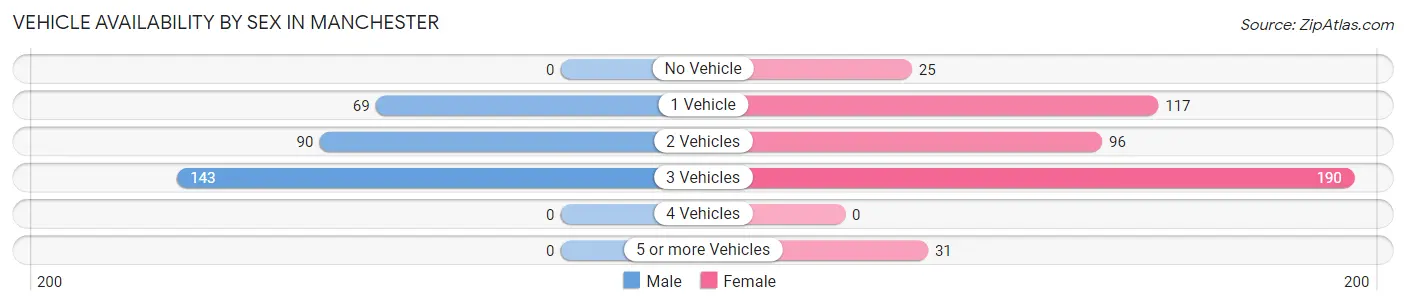
| Vehicles Available | Male | Female |
| No Vehicle | 0 (0.0%) | 25 (5.4%) |
| 1 Vehicle | 69 (22.9%) | 117 (25.5%) |
| 2 Vehicles | 90 (29.8%) | 96 (20.9%) |
| 3 Vehicles | 143 (47.3%) | 190 (41.4%) |
| 4 Vehicles | 0 (0.0%) | 0 (0.0%) |
| 5 or more Vehicles | 0 (0.0%) | 31 (6.8%) |
| Total | 302 (100.0%) | 459 (100.0%) |
Commute Time in Manchester
The most frequently occuring commute durations in Manchester are 20 to 24 minutes (141 commuters, 18.6%), 15 to 19 minutes (115 commuters, 15.2%), and 10 to 14 minutes (99 commuters, 13.1%).
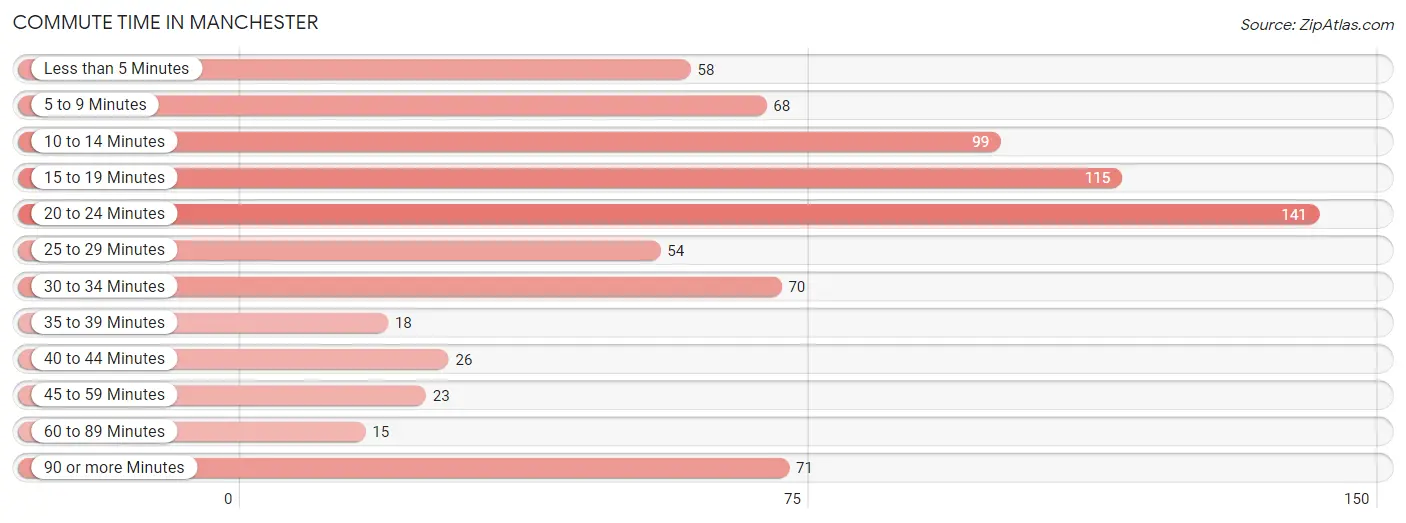
| Commute Time | # Commuters | % Commuters |
| Less than 5 Minutes | 58 | 7.6% |
| 5 to 9 Minutes | 68 | 9.0% |
| 10 to 14 Minutes | 99 | 13.1% |
| 15 to 19 Minutes | 115 | 15.2% |
| 20 to 24 Minutes | 141 | 18.6% |
| 25 to 29 Minutes | 54 | 7.1% |
| 30 to 34 Minutes | 70 | 9.2% |
| 35 to 39 Minutes | 18 | 2.4% |
| 40 to 44 Minutes | 26 | 3.4% |
| 45 to 59 Minutes | 23 | 3.0% |
| 60 to 89 Minutes | 15 | 2.0% |
| 90 or more Minutes | 71 | 9.4% |
Commute Time by Sex in Manchester
The most common commute times in Manchester are 90 or more minutes (59 commuters, 19.7%) for males and 15 to 19 minutes (112 commuters, 24.4%) for females.
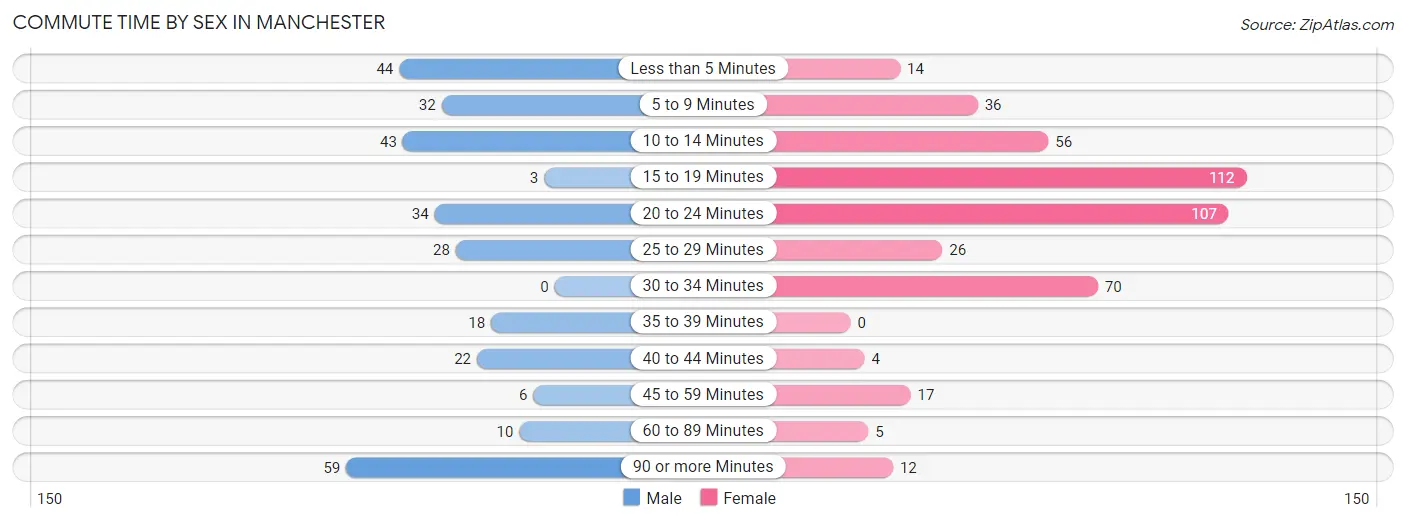
| Commute Time | Male | Female |
| Less than 5 Minutes | 44 (14.7%) | 14 (3.0%) |
| 5 to 9 Minutes | 32 (10.7%) | 36 (7.8%) |
| 10 to 14 Minutes | 43 (14.4%) | 56 (12.2%) |
| 15 to 19 Minutes | 3 (1.0%) | 112 (24.4%) |
| 20 to 24 Minutes | 34 (11.4%) | 107 (23.3%) |
| 25 to 29 Minutes | 28 (9.4%) | 26 (5.7%) |
| 30 to 34 Minutes | 0 (0.0%) | 70 (15.2%) |
| 35 to 39 Minutes | 18 (6.0%) | 0 (0.0%) |
| 40 to 44 Minutes | 22 (7.4%) | 4 (0.9%) |
| 45 to 59 Minutes | 6 (2.0%) | 17 (3.7%) |
| 60 to 89 Minutes | 10 (3.3%) | 5 (1.1%) |
| 90 or more Minutes | 59 (19.7%) | 12 (2.6%) |
Time of Departure to Work by Sex in Manchester
The most frequent times of departure to work in Manchester are 7:00 AM to 7:29 AM (96, 32.1%) for males and 12:00 PM to 3:59 PM (118, 25.7%) for females.
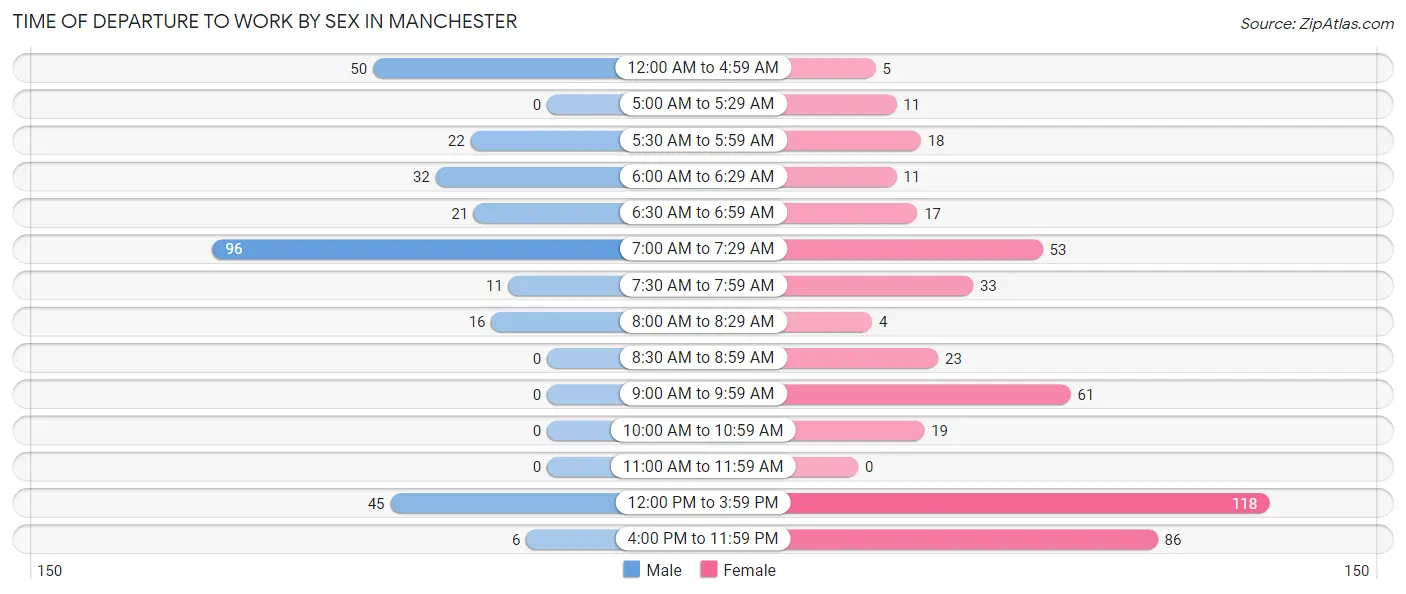
| Time of Departure | Male | Female |
| 12:00 AM to 4:59 AM | 50 (16.7%) | 5 (1.1%) |
| 5:00 AM to 5:29 AM | 0 (0.0%) | 11 (2.4%) |
| 5:30 AM to 5:59 AM | 22 (7.4%) | 18 (3.9%) |
| 6:00 AM to 6:29 AM | 32 (10.7%) | 11 (2.4%) |
| 6:30 AM to 6:59 AM | 21 (7.0%) | 17 (3.7%) |
| 7:00 AM to 7:29 AM | 96 (32.1%) | 53 (11.6%) |
| 7:30 AM to 7:59 AM | 11 (3.7%) | 33 (7.2%) |
| 8:00 AM to 8:29 AM | 16 (5.3%) | 4 (0.9%) |
| 8:30 AM to 8:59 AM | 0 (0.0%) | 23 (5.0%) |
| 9:00 AM to 9:59 AM | 0 (0.0%) | 61 (13.3%) |
| 10:00 AM to 10:59 AM | 0 (0.0%) | 19 (4.1%) |
| 11:00 AM to 11:59 AM | 0 (0.0%) | 0 (0.0%) |
| 12:00 PM to 3:59 PM | 45 (15.0%) | 118 (25.7%) |
| 4:00 PM to 11:59 PM | 6 (2.0%) | 86 (18.7%) |
| Total | 299 (100.0%) | 459 (100.0%) |
Housing Occupancy in Manchester
Occupancy by Ownership in Manchester
Of the total 784 dwellings in Manchester, owner-occupied units account for 387 (49.4%), while renter-occupied units make up 397 (50.6%).
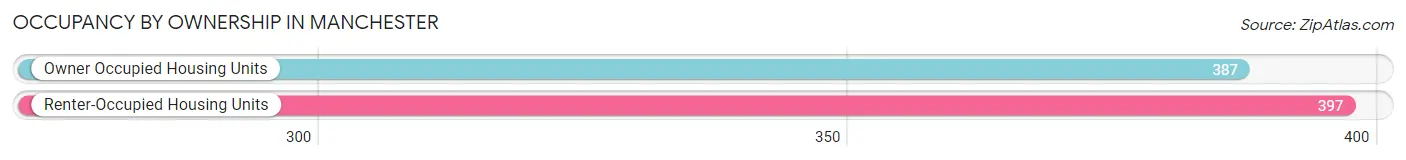
| Occupancy | # Housing Units | % Housing Units |
| Owner Occupied Housing Units | 387 | 49.4% |
| Renter-Occupied Housing Units | 397 | 50.6% |
| Total Occupied Housing Units | 784 | 100.0% |
Occupancy by Household Size in Manchester
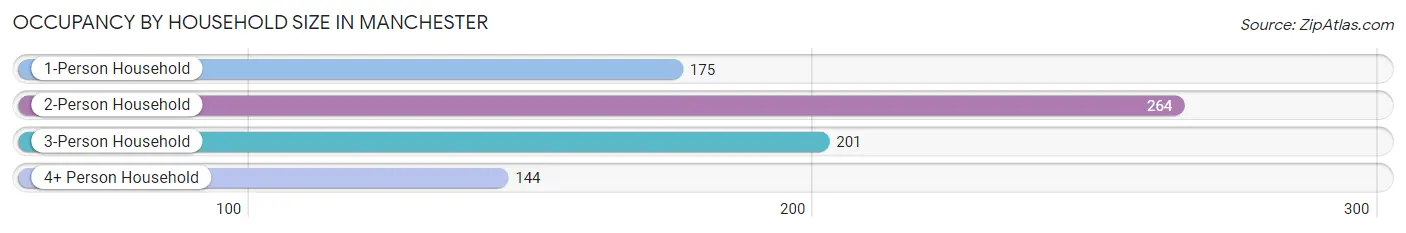
| Household Size | # Housing Units | % Housing Units |
| 1-Person Household | 175 | 22.3% |
| 2-Person Household | 264 | 33.7% |
| 3-Person Household | 201 | 25.6% |
| 4+ Person Household | 144 | 18.4% |
| Total Housing Units | 784 | 100.0% |
Occupancy by Ownership by Household Size in Manchester
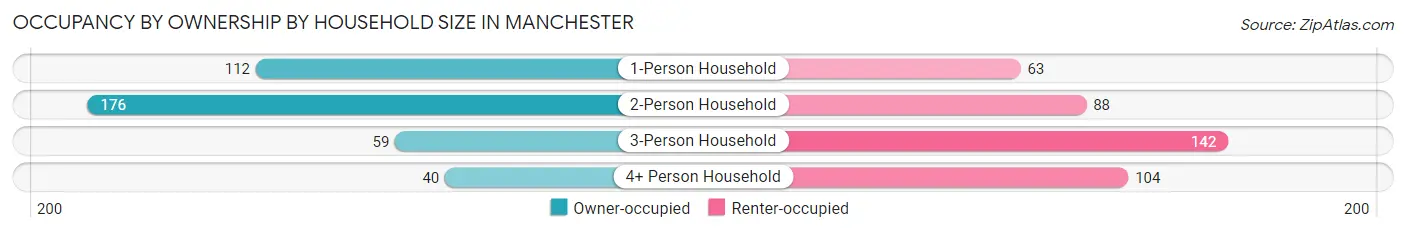
| Household Size | Owner-occupied | Renter-occupied |
| 1-Person Household | 112 (64.0%) | 63 (36.0%) |
| 2-Person Household | 176 (66.7%) | 88 (33.3%) |
| 3-Person Household | 59 (29.3%) | 142 (70.7%) |
| 4+ Person Household | 40 (27.8%) | 104 (72.2%) |
| Total Housing Units | 387 (49.4%) | 397 (50.6%) |
Occupancy by Educational Attainment in Manchester
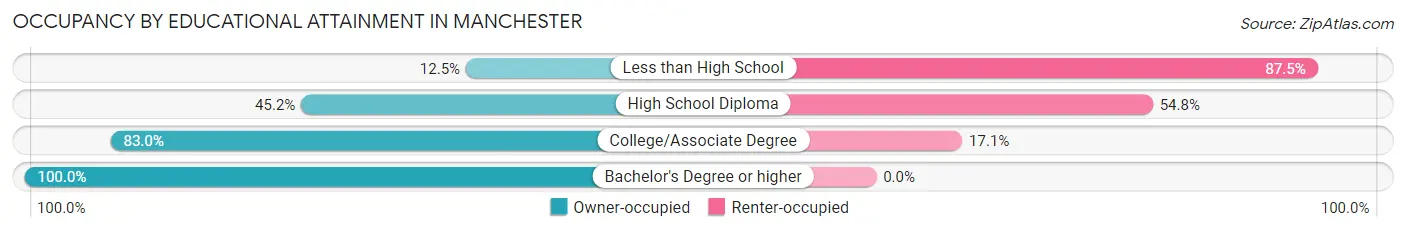
| Household Size | Owner-occupied | Renter-occupied |
| Less than High School | 20 (12.5%) | 140 (87.5%) |
| High School Diploma | 187 (45.2%) | 227 (54.8%) |
| College/Associate Degree | 146 (83.0%) | 30 (17.1%) |
| Bachelor's Degree or higher | 34 (100.0%) | 0 (0.0%) |
Occupancy by Age of Householder in Manchester
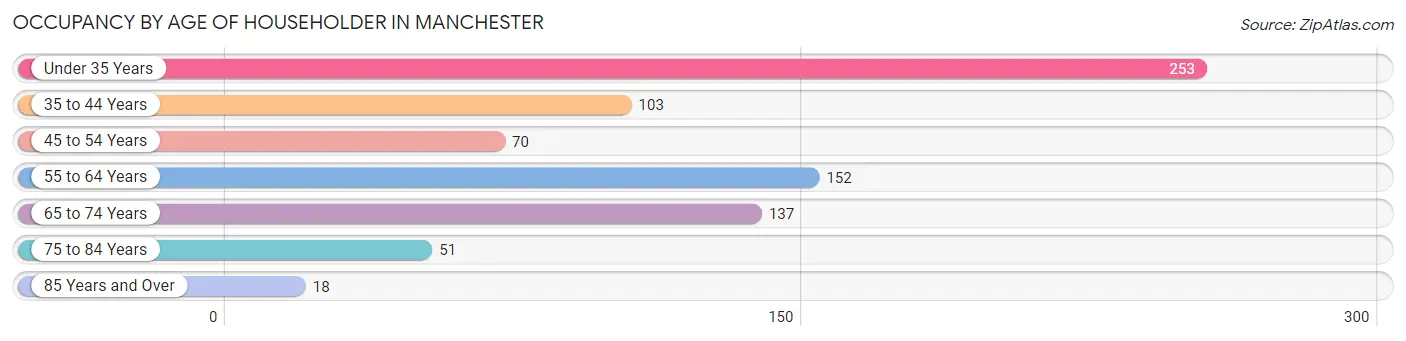
| Age Bracket | # Households | % Households |
| Under 35 Years | 253 | 32.3% |
| 35 to 44 Years | 103 | 13.1% |
| 45 to 54 Years | 70 | 8.9% |
| 55 to 64 Years | 152 | 19.4% |
| 65 to 74 Years | 137 | 17.5% |
| 75 to 84 Years | 51 | 6.5% |
| 85 Years and Over | 18 | 2.3% |
| Total | 784 | 100.0% |
Housing Finances in Manchester
Median Income by Occupancy in Manchester
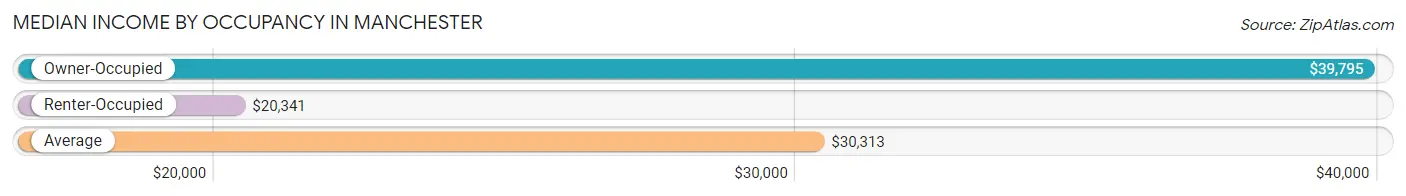
| Occupancy Type | # Households | Median Income |
| Owner-Occupied | 387 (49.4%) | $39,795 |
| Renter-Occupied | 397 (50.6%) | $20,341 |
| Average | 784 (100.0%) | $30,313 |
Occupancy by Householder Income Bracket in Manchester
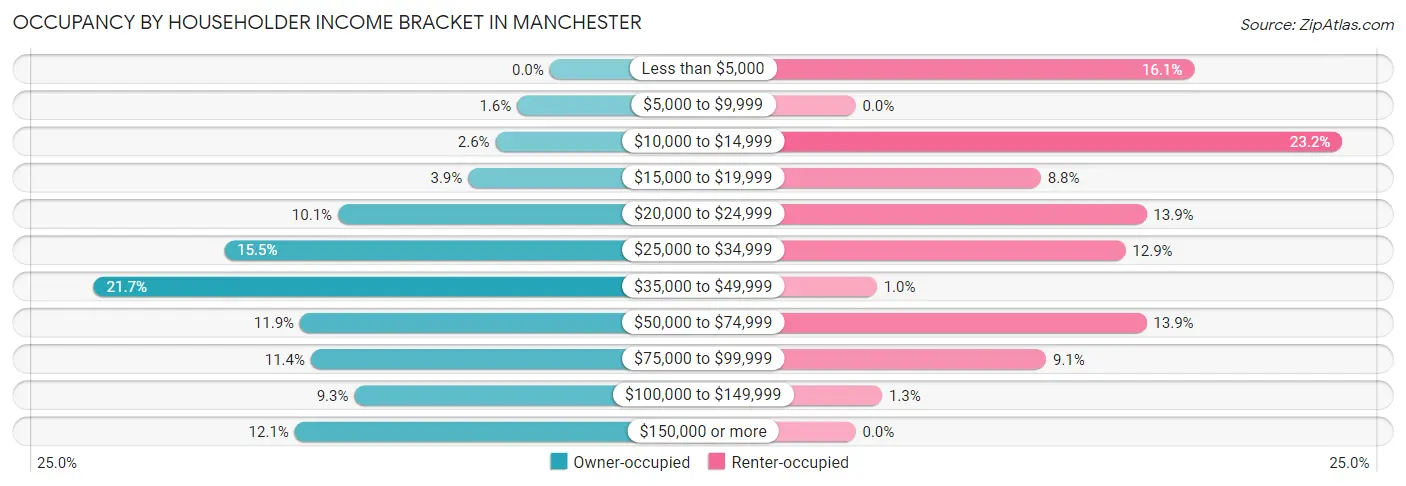
| Income Bracket | Owner-occupied | Renter-occupied |
| Less than $5,000 | 0 (0.0%) | 64 (16.1%) |
| $5,000 to $9,999 | 6 (1.5%) | 0 (0.0%) |
| $10,000 to $14,999 | 10 (2.6%) | 92 (23.2%) |
| $15,000 to $19,999 | 15 (3.9%) | 35 (8.8%) |
| $20,000 to $24,999 | 39 (10.1%) | 55 (13.9%) |
| $25,000 to $34,999 | 60 (15.5%) | 51 (12.9%) |
| $35,000 to $49,999 | 84 (21.7%) | 4 (1.0%) |
| $50,000 to $74,999 | 46 (11.9%) | 55 (13.9%) |
| $75,000 to $99,999 | 44 (11.4%) | 36 (9.1%) |
| $100,000 to $149,999 | 36 (9.3%) | 5 (1.3%) |
| $150,000 or more | 47 (12.1%) | 0 (0.0%) |
| Total | 387 (100.0%) | 397 (100.0%) |
Monthly Housing Cost Tiers in Manchester
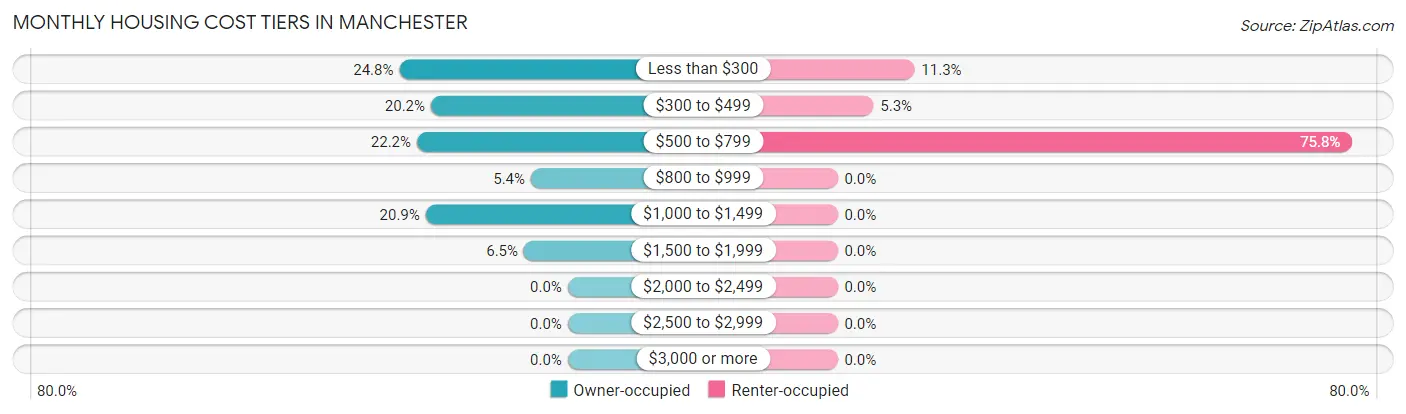
| Monthly Cost | Owner-occupied | Renter-occupied |
| Less than $300 | 96 (24.8%) | 45 (11.3%) |
| $300 to $499 | 78 (20.2%) | 21 (5.3%) |
| $500 to $799 | 86 (22.2%) | 301 (75.8%) |
| $800 to $999 | 21 (5.4%) | 0 (0.0%) |
| $1,000 to $1,499 | 81 (20.9%) | 0 (0.0%) |
| $1,500 to $1,999 | 25 (6.5%) | 0 (0.0%) |
| $2,000 to $2,499 | 0 (0.0%) | 0 (0.0%) |
| $2,500 to $2,999 | 0 (0.0%) | 0 (0.0%) |
| $3,000 or more | 0 (0.0%) | 0 (0.0%) |
| Total | 387 (100.0%) | 397 (100.0%) |
Physical Housing Characteristics in Manchester
Housing Structures in Manchester
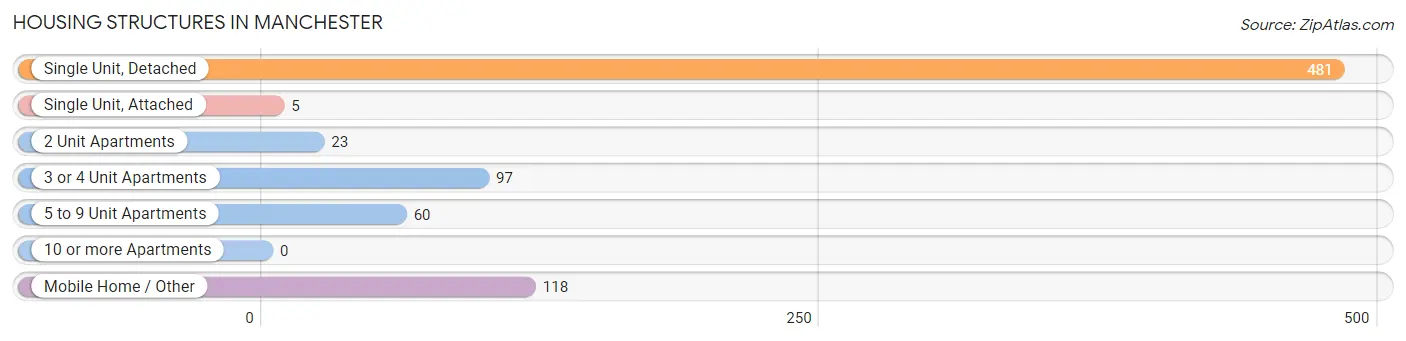
| Structure Type | # Housing Units | % Housing Units |
| Single Unit, Detached | 481 | 61.4% |
| Single Unit, Attached | 5 | 0.6% |
| 2 Unit Apartments | 23 | 2.9% |
| 3 or 4 Unit Apartments | 97 | 12.4% |
| 5 to 9 Unit Apartments | 60 | 7.6% |
| 10 or more Apartments | 0 | 0.0% |
| Mobile Home / Other | 118 | 15.0% |
| Total | 784 | 100.0% |
Housing Structures by Occupancy in Manchester
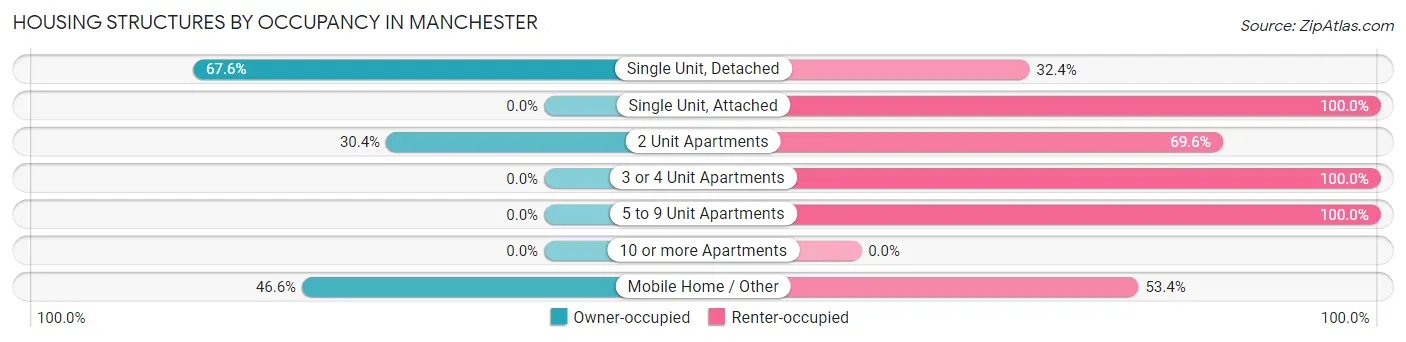
| Structure Type | Owner-occupied | Renter-occupied |
| Single Unit, Detached | 325 (67.6%) | 156 (32.4%) |
| Single Unit, Attached | 0 (0.0%) | 5 (100.0%) |
| 2 Unit Apartments | 7 (30.4%) | 16 (69.6%) |
| 3 or 4 Unit Apartments | 0 (0.0%) | 97 (100.0%) |
| 5 to 9 Unit Apartments | 0 (0.0%) | 60 (100.0%) |
| 10 or more Apartments | 0 (0.0%) | 0 (0.0%) |
| Mobile Home / Other | 55 (46.6%) | 63 (53.4%) |
| Total | 387 (49.4%) | 397 (50.6%) |
Housing Structures by Number of Rooms in Manchester
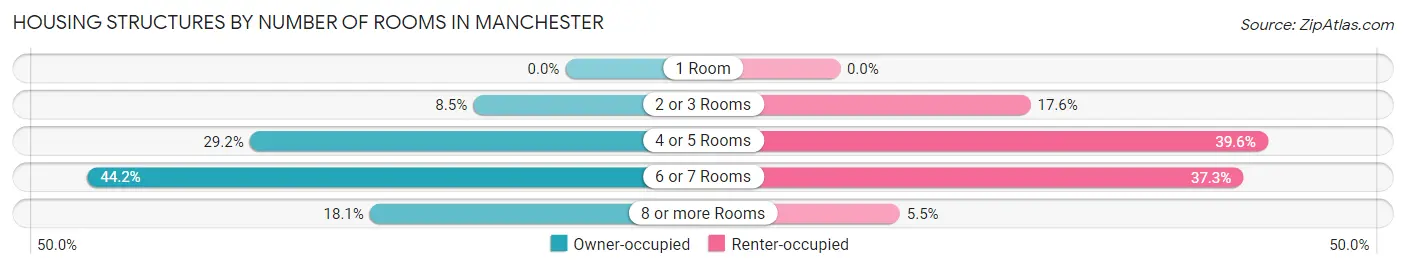
| Number of Rooms | Owner-occupied | Renter-occupied |
| 1 Room | 0 (0.0%) | 0 (0.0%) |
| 2 or 3 Rooms | 33 (8.5%) | 70 (17.6%) |
| 4 or 5 Rooms | 113 (29.2%) | 157 (39.6%) |
| 6 or 7 Rooms | 171 (44.2%) | 148 (37.3%) |
| 8 or more Rooms | 70 (18.1%) | 22 (5.5%) |
| Total | 387 (100.0%) | 397 (100.0%) |
Housing Structure by Heating Type in Manchester
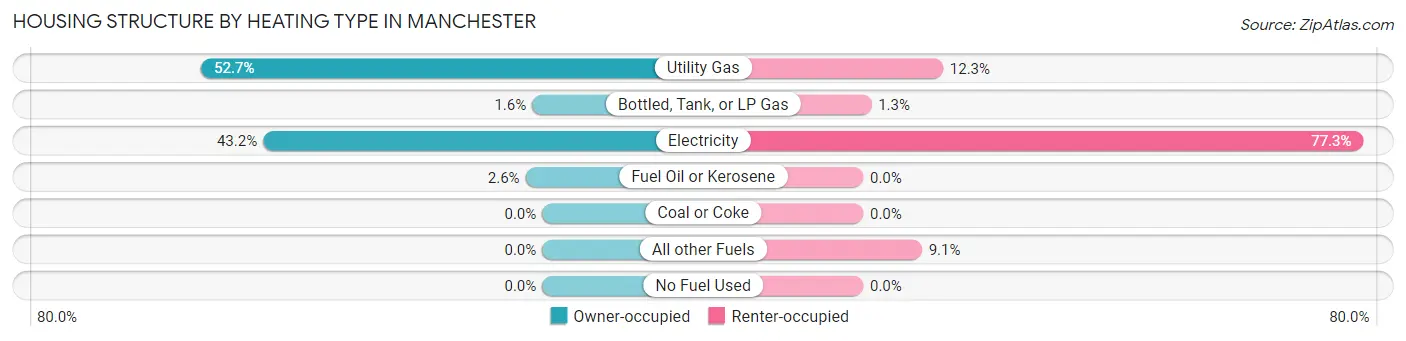
| Heating Type | Owner-occupied | Renter-occupied |
| Utility Gas | 204 (52.7%) | 49 (12.3%) |
| Bottled, Tank, or LP Gas | 6 (1.5%) | 5 (1.3%) |
| Electricity | 167 (43.1%) | 307 (77.3%) |
| Fuel Oil or Kerosene | 10 (2.6%) | 0 (0.0%) |
| Coal or Coke | 0 (0.0%) | 0 (0.0%) |
| All other Fuels | 0 (0.0%) | 36 (9.1%) |
| No Fuel Used | 0 (0.0%) | 0 (0.0%) |
| Total | 387 (100.0%) | 397 (100.0%) |
Household Vehicle Usage in Manchester
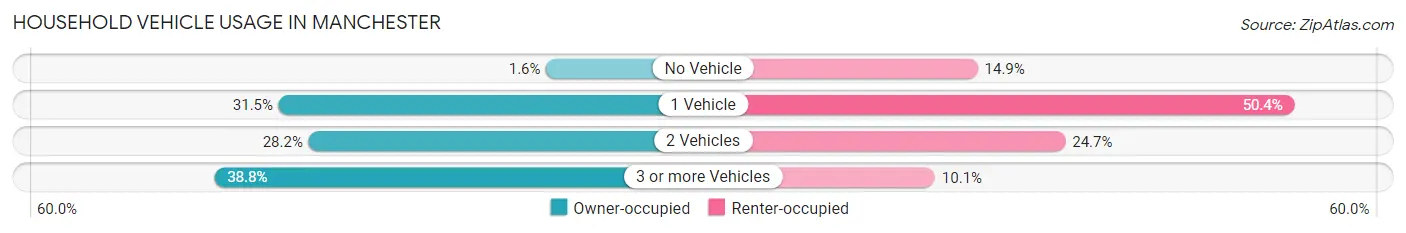
| Vehicles per Household | Owner-occupied | Renter-occupied |
| No Vehicle | 6 (1.5%) | 59 (14.9%) |
| 1 Vehicle | 122 (31.5%) | 200 (50.4%) |
| 2 Vehicles | 109 (28.2%) | 98 (24.7%) |
| 3 or more Vehicles | 150 (38.8%) | 40 (10.1%) |
| Total | 387 (100.0%) | 397 (100.0%) |
Real Estate & Mortgages in Manchester
Real Estate and Mortgage Overview in Manchester
| Characteristic | Without Mortgage | With Mortgage |
| Housing Units | 216 | 171 |
| Median Property Value | $83,300 | $0 |
| Median Household Income | $38,523 | $16 |
| Monthly Housing Costs | $326 | $0 |
| Real Estate Taxes | $600 | $0 |
Property Value by Mortgage Status in Manchester
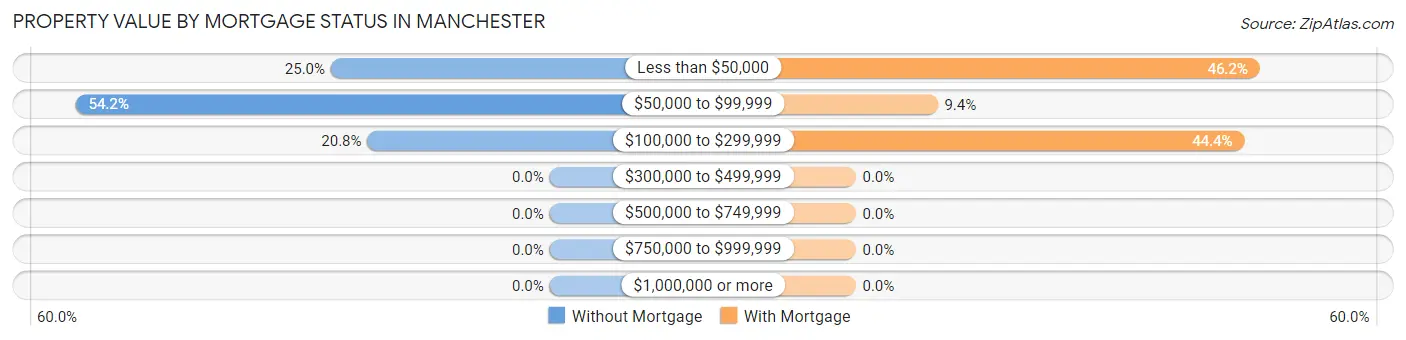
| Property Value | Without Mortgage | With Mortgage |
| Less than $50,000 | 54 (25.0%) | 79 (46.2%) |
| $50,000 to $99,999 | 117 (54.2%) | 16 (9.4%) |
| $100,000 to $299,999 | 45 (20.8%) | 76 (44.4%) |
| $300,000 to $499,999 | 0 (0.0%) | 0 (0.0%) |
| $500,000 to $749,999 | 0 (0.0%) | 0 (0.0%) |
| $750,000 to $999,999 | 0 (0.0%) | 0 (0.0%) |
| $1,000,000 or more | 0 (0.0%) | 0 (0.0%) |
| Total | 216 (100.0%) | 171 (100.0%) |
Household Income by Mortgage Status in Manchester
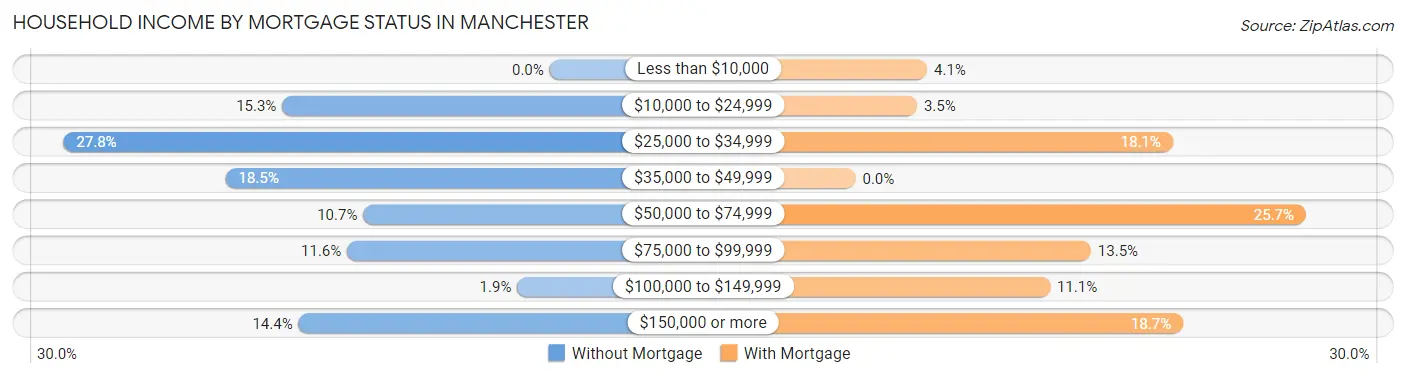
| Household Income | Without Mortgage | With Mortgage |
| Less than $10,000 | 0 (0.0%) | 7 (4.1%) |
| $10,000 to $24,999 | 33 (15.3%) | 6 (3.5%) |
| $25,000 to $34,999 | 60 (27.8%) | 31 (18.1%) |
| $35,000 to $49,999 | 40 (18.5%) | 0 (0.0%) |
| $50,000 to $74,999 | 23 (10.6%) | 44 (25.7%) |
| $75,000 to $99,999 | 25 (11.6%) | 23 (13.5%) |
| $100,000 to $149,999 | 4 (1.8%) | 19 (11.1%) |
| $150,000 or more | 31 (14.3%) | 32 (18.7%) |
| Total | 216 (100.0%) | 171 (100.0%) |
Property Value to Household Income Ratio in Manchester
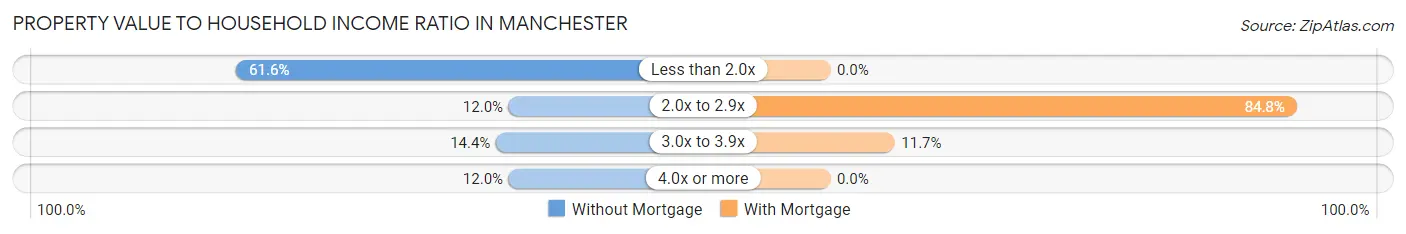
| Value-to-Income Ratio | Without Mortgage | With Mortgage |
| Less than 2.0x | 133 (61.6%) | 0 (0.0%) |
| 2.0x to 2.9x | 26 (12.0%) | 145 (84.8%) |
| 3.0x to 3.9x | 31 (14.3%) | 20 (11.7%) |
| 4.0x or more | 26 (12.0%) | 0 (0.0%) |
| Total | 216 (100.0%) | 171 (100.0%) |
Real Estate Taxes by Mortgage Status in Manchester
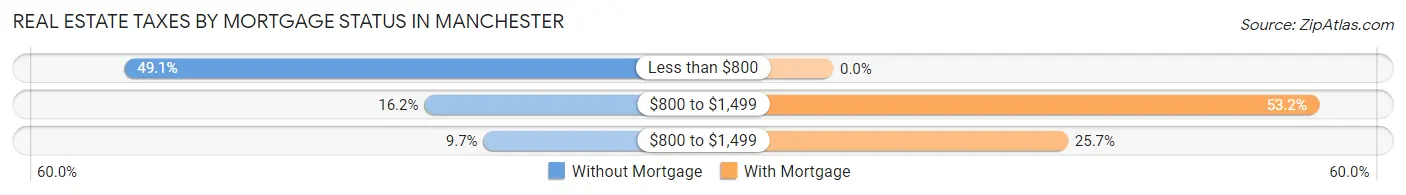
| Property Taxes | Without Mortgage | With Mortgage |
| Less than $800 | 106 (49.1%) | 0 (0.0%) |
| $800 to $1,499 | 35 (16.2%) | 91 (53.2%) |
| $800 to $1,499 | 21 (9.7%) | 44 (25.7%) |
| Total | 216 (100.0%) | 171 (100.0%) |
Health & Disability in Manchester
Health Insurance Coverage by Age in Manchester
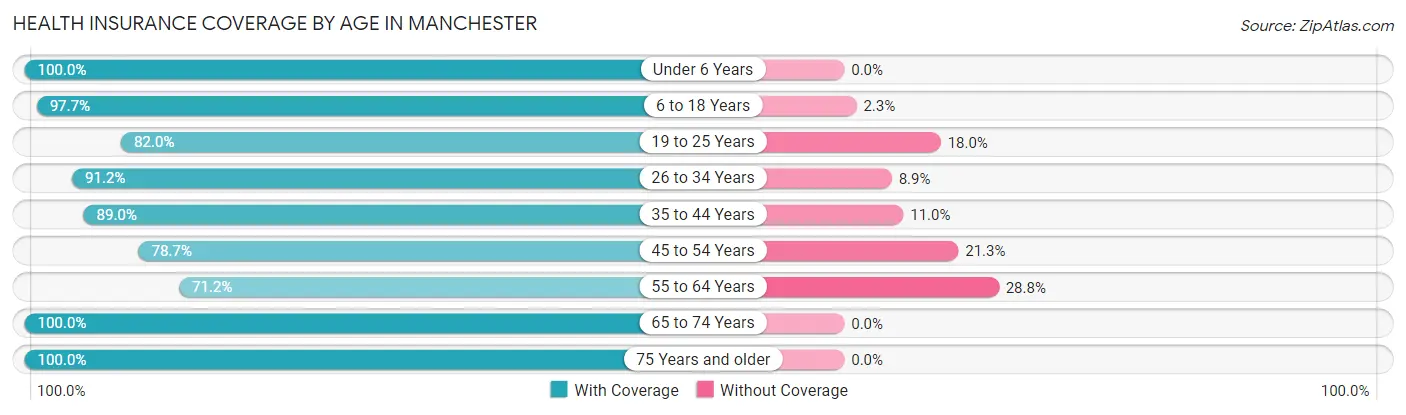
| Age Bracket | With Coverage | Without Coverage |
| Under 6 Years | 227 (100.0%) | 0 (0.0%) |
| 6 to 18 Years | 301 (97.7%) | 7 (2.3%) |
| 19 to 25 Years | 187 (82.0%) | 41 (18.0%) |
| 26 to 34 Years | 340 (91.1%) | 33 (8.8%) |
| 35 to 44 Years | 194 (89.0%) | 24 (11.0%) |
| 45 to 54 Years | 163 (78.7%) | 44 (21.3%) |
| 55 to 64 Years | 136 (71.2%) | 55 (28.8%) |
| 65 to 74 Years | 274 (100.0%) | 0 (0.0%) |
| 75 Years and older | 84 (100.0%) | 0 (0.0%) |
| Total | 1,906 (90.3%) | 204 (9.7%) |
Health Insurance Coverage by Citizenship Status in Manchester
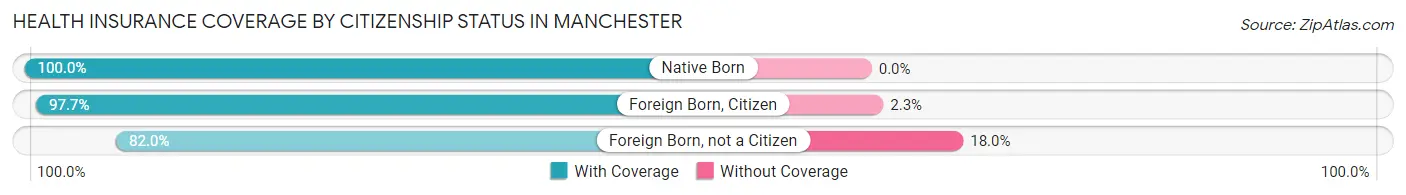
| Citizenship Status | With Coverage | Without Coverage |
| Native Born | 227 (100.0%) | 0 (0.0%) |
| Foreign Born, Citizen | 301 (97.7%) | 7 (2.3%) |
| Foreign Born, not a Citizen | 187 (82.0%) | 41 (18.0%) |
Health Insurance Coverage by Household Income in Manchester
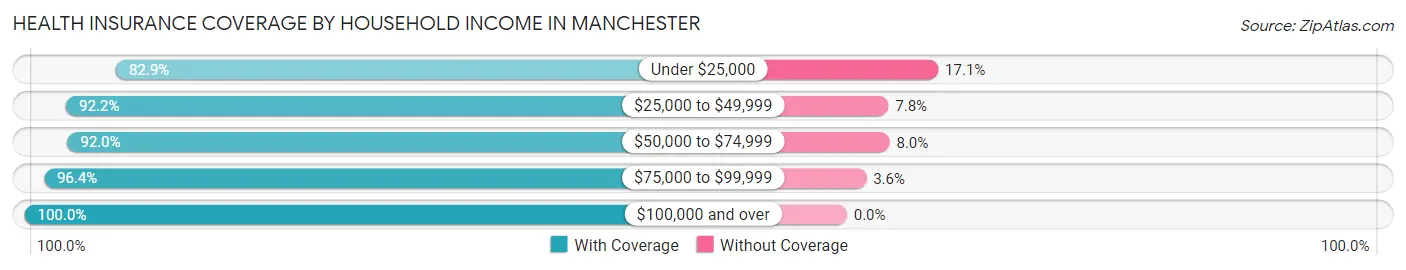
| Household Income | With Coverage | Without Coverage |
| Under $25,000 | 610 (82.9%) | 126 (17.1%) |
| $25,000 to $49,999 | 474 (92.2%) | 40 (7.8%) |
| $50,000 to $74,999 | 310 (92.0%) | 27 (8.0%) |
| $75,000 to $99,999 | 292 (96.4%) | 11 (3.6%) |
| $100,000 and over | 220 (100.0%) | 0 (0.0%) |
Public vs Private Health Insurance Coverage by Age in Manchester
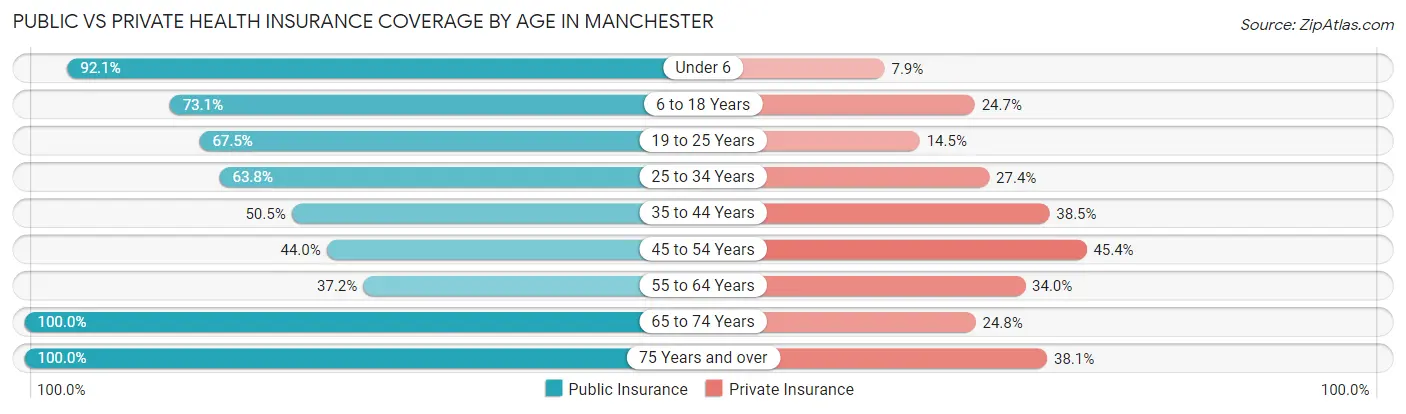
| Age Bracket | Public Insurance | Private Insurance |
| Under 6 | 209 (92.1%) | 18 (7.9%) |
| 6 to 18 Years | 225 (73.1%) | 76 (24.7%) |
| 19 to 25 Years | 154 (67.5%) | 33 (14.5%) |
| 25 to 34 Years | 238 (63.8%) | 102 (27.4%) |
| 35 to 44 Years | 110 (50.5%) | 84 (38.5%) |
| 45 to 54 Years | 91 (44.0%) | 94 (45.4%) |
| 55 to 64 Years | 71 (37.2%) | 65 (34.0%) |
| 65 to 74 Years | 274 (100.0%) | 68 (24.8%) |
| 75 Years and over | 84 (100.0%) | 32 (38.1%) |
| Total | 1,456 (69.0%) | 572 (27.1%) |
Disability Status by Sex by Age in Manchester
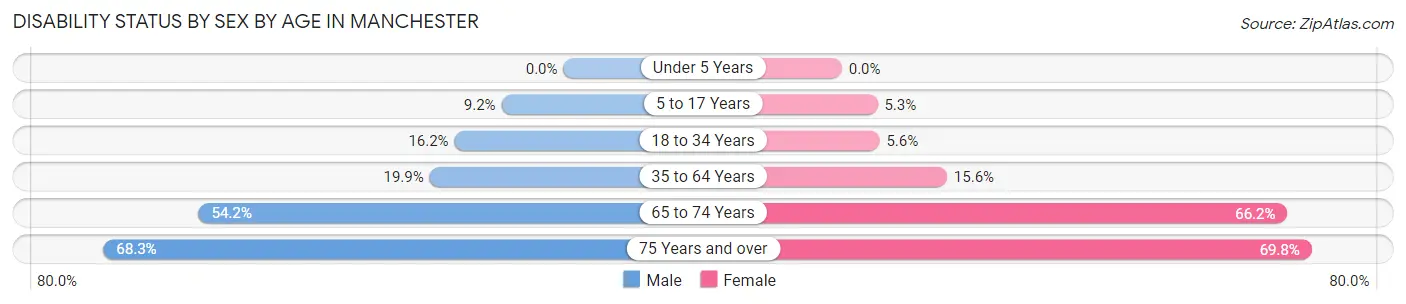
| Age Bracket | Male | Female |
| Under 5 Years | 0 (0.0%) | 0 (0.0%) |
| 5 to 17 Years | 17 (9.2%) | 7 (5.3%) |
| 18 to 34 Years | 38 (16.2%) | 21 (5.6%) |
| 35 to 64 Years | 60 (19.9%) | 49 (15.6%) |
| 65 to 74 Years | 78 (54.2%) | 86 (66.1%) |
| 75 Years and over | 28 (68.3%) | 30 (69.8%) |
Disability Class by Sex by Age in Manchester
Disability Class: Hearing Difficulty
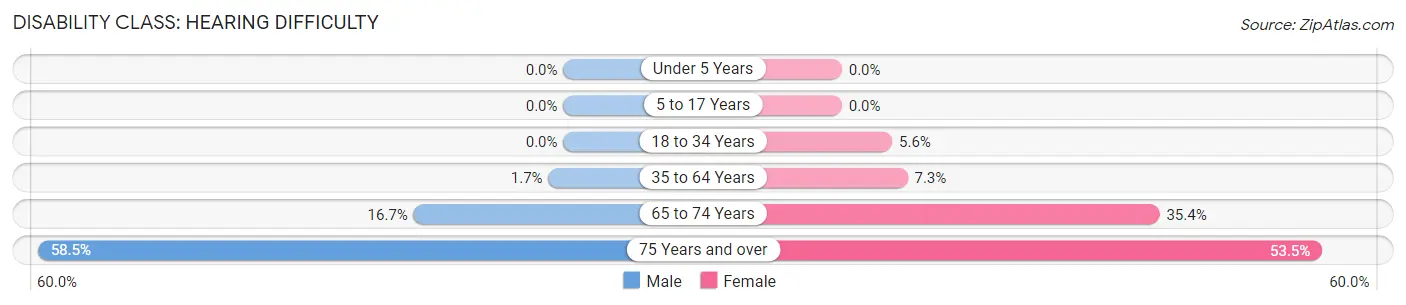
| Age Bracket | Male | Female |
| Under 5 Years | 0 (0.0%) | 0 (0.0%) |
| 5 to 17 Years | 0 (0.0%) | 0 (0.0%) |
| 18 to 34 Years | 0 (0.0%) | 21 (5.6%) |
| 35 to 64 Years | 5 (1.7%) | 23 (7.3%) |
| 65 to 74 Years | 24 (16.7%) | 46 (35.4%) |
| 75 Years and over | 24 (58.5%) | 23 (53.5%) |
Disability Class: Vision Difficulty
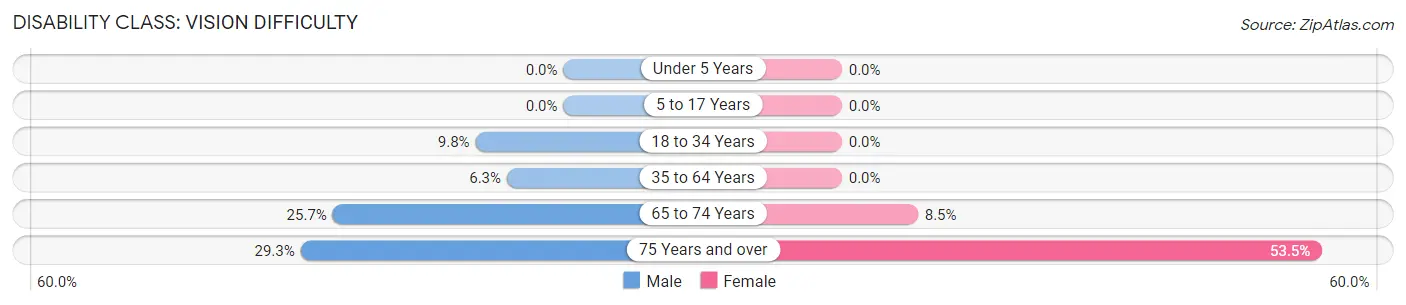
| Age Bracket | Male | Female |
| Under 5 Years | 0 (0.0%) | 0 (0.0%) |
| 5 to 17 Years | 0 (0.0%) | 0 (0.0%) |
| 18 to 34 Years | 23 (9.8%) | 0 (0.0%) |
| 35 to 64 Years | 19 (6.3%) | 0 (0.0%) |
| 65 to 74 Years | 37 (25.7%) | 11 (8.5%) |
| 75 Years and over | 12 (29.3%) | 23 (53.5%) |
Disability Class: Cognitive Difficulty
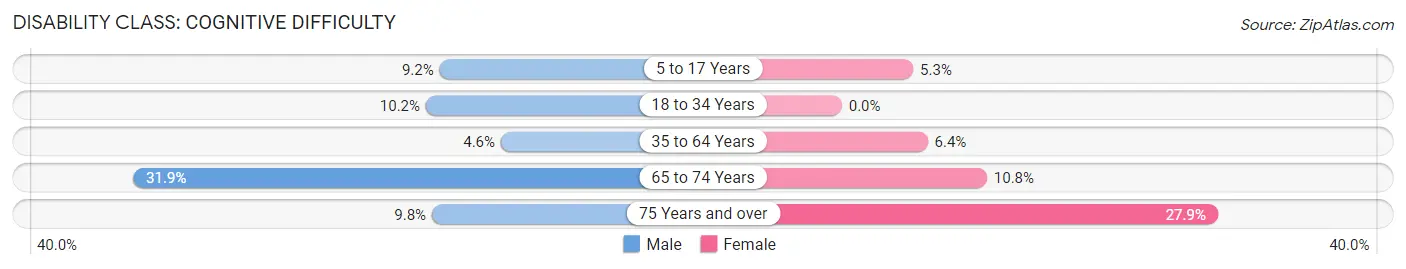
| Age Bracket | Male | Female |
| 5 to 17 Years | 17 (9.2%) | 7 (5.3%) |
| 18 to 34 Years | 24 (10.2%) | 0 (0.0%) |
| 35 to 64 Years | 14 (4.6%) | 20 (6.4%) |
| 65 to 74 Years | 46 (31.9%) | 14 (10.8%) |
| 75 Years and over | 4 (9.8%) | 12 (27.9%) |
Disability Class: Ambulatory Difficulty
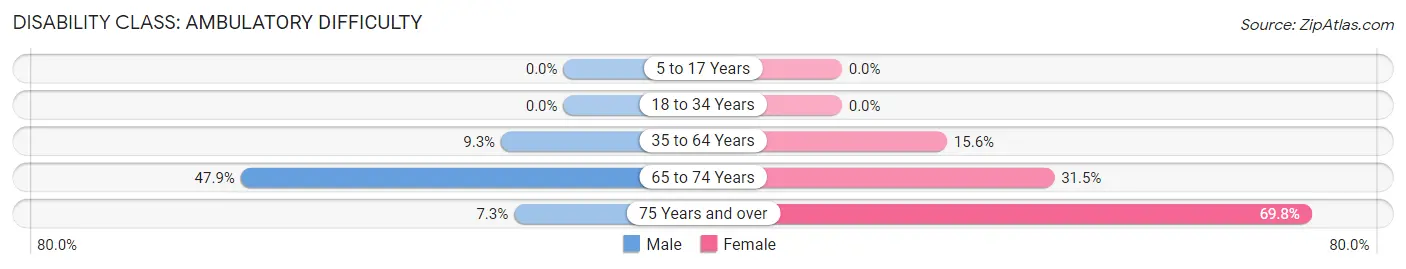
| Age Bracket | Male | Female |
| 5 to 17 Years | 0 (0.0%) | 0 (0.0%) |
| 18 to 34 Years | 0 (0.0%) | 0 (0.0%) |
| 35 to 64 Years | 28 (9.3%) | 49 (15.6%) |
| 65 to 74 Years | 69 (47.9%) | 41 (31.5%) |
| 75 Years and over | 3 (7.3%) | 30 (69.8%) |
Disability Class: Self-Care Difficulty
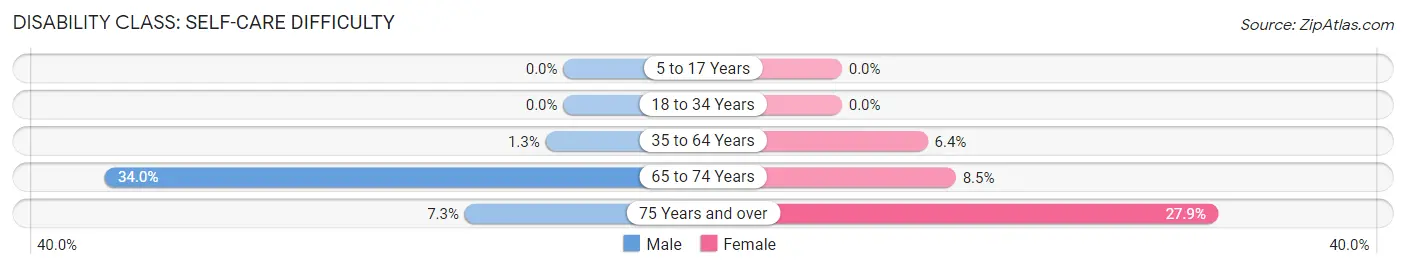
| Age Bracket | Male | Female |
| 5 to 17 Years | 0 (0.0%) | 0 (0.0%) |
| 18 to 34 Years | 0 (0.0%) | 0 (0.0%) |
| 35 to 64 Years | 4 (1.3%) | 20 (6.4%) |
| 65 to 74 Years | 49 (34.0%) | 11 (8.5%) |
| 75 Years and over | 3 (7.3%) | 12 (27.9%) |
Technology Access in Manchester
Computing Device Access in Manchester
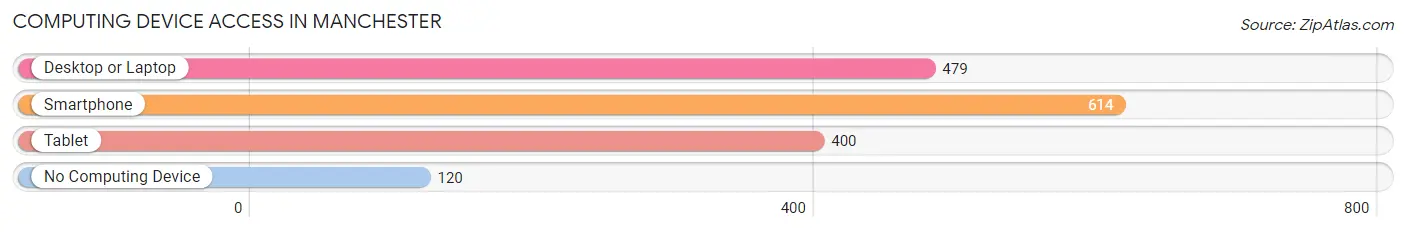
| Device Type | # Households | % Households |
| Desktop or Laptop | 479 | 61.1% |
| Smartphone | 614 | 78.3% |
| Tablet | 400 | 51.0% |
| No Computing Device | 120 | 15.3% |
| Total | 784 | 100.0% |
Internet Access in Manchester
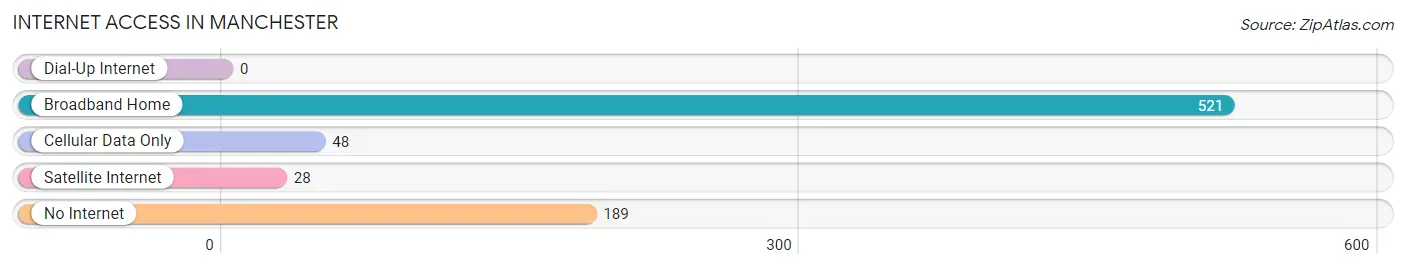
| Internet Type | # Households | % Households |
| Dial-Up Internet | 0 | 0.0% |
| Broadband Home | 521 | 66.4% |
| Cellular Data Only | 48 | 6.1% |
| Satellite Internet | 28 | 3.6% |
| No Internet | 189 | 24.1% |
| Total | 784 | 100.0% |
Manchester Summary
Manchester, Ohio is a small village located in Adams County, Ohio. It is situated on the banks of the Ohio River, approximately 30 miles east of Cincinnati. The village has a population of approximately 1,000 people and covers an area of 0.6 square miles.
History
Manchester was founded in 1817 by a group of settlers from Pennsylvania. The village was named after Manchester, England, and was originally known as Manchester Station. The village was incorporated in 1845 and was the first village in Adams County to be incorporated.
The village was an important stop on the Underground Railroad, with many of the local residents helping to hide and transport escaped slaves. The village was also home to a number of prominent abolitionists, including William Lloyd Garrison and John Rankin.
Geography
Manchester is located in the southwestern corner of Adams County, Ohio. It is situated on the banks of the Ohio River, approximately 30 miles east of Cincinnati. The village is located in a rural area, with the nearest major city being Cincinnati.
The village is located in a hilly region, with the highest point being the Manchester Hill, which is located at an elevation of 845 feet. The village is located in a humid continental climate zone, with hot summers and cold winters.
Economy
The economy of Manchester is largely based on agriculture and tourism. The village is home to a number of small businesses, including a grocery store, a hardware store, and a few restaurants. The village is also home to a number of small farms, which produce a variety of crops, including corn, soybeans, and wheat.
The village is also home to a number of tourist attractions, including the Manchester Historical Museum, the Manchester Covered Bridge, and the Manchester State Park. The village is also home to a number of festivals, including the Manchester Music Festival and the Manchester Harvest Festival.
Demographics
As of the 2010 census, the population of Manchester was 1,000 people. The racial makeup of the village was 97.2% White, 0.7% African American, 0.3% Native American, 0.2% Asian, and 1.6% from other races. The median household income was $37,500, and the median family income was $45,000.
The village is home to a number of churches, including the Manchester United Methodist Church, the Manchester Presbyterian Church, and the Manchester Baptist Church. The village is also home to a number of schools, including the Manchester Elementary School, the Manchester Middle School, and the Manchester High School.
Common Questions
What is Per Capita Income in Manchester?
Per Capita income in Manchester is $22,824.
What is the Median Family Income in Manchester?
Median Family Income in Manchester is $29,615.
What is the Median Household income in Manchester?
Median Household Income in Manchester is $30,313.
What is Income or Wage Gap in Manchester?
Income or Wage Gap in Manchester is 23.2%.
Women in Manchester earn 76.8 cents for every dollar earned by a man.
What is Family Income Deficit in Manchester?
Family Income Deficit in Manchester is $12,371.
Families that are below poverty line in Manchester earn $12,371 less on average than the poverty threshold level.
What is Inequality or Gini Index in Manchester?
Inequality or Gini Index in Manchester is 0.57.
What is the Total Population of Manchester?
Total Population of Manchester is 2,110.
What is the Total Male Population of Manchester?
Total Male Population of Manchester is 1,007.
What is the Total Female Population of Manchester?
Total Female Population of Manchester is 1,103.
What is the Ratio of Males per 100 Females in Manchester?
There are 91.30 Males per 100 Females in Manchester.
What is the Ratio of Females per 100 Males in Manchester?
There are 109.53 Females per 100 Males in Manchester.
What is the Median Population Age in Manchester?
Median Population Age in Manchester is 32.6 Years.
What is the Average Family Size in Manchester
Average Family Size in Manchester is 3.0 People.
What is the Average Household Size in Manchester
Average Household Size in Manchester is 2.7 People.
How Large is the Labor Force in Manchester?
There are 863 People in the Labor Forcein in Manchester.
What is the Percentage of People in the Labor Force in Manchester?
52.8% of People are in the Labor Force in Manchester.
What is the Unemployment Rate in Manchester?
Unemployment Rate in Manchester is 10.8%.