Zip Codes with the Highest Percentage of Families with Income Below $10,000 in Cincinnati, OH
RELATED REPORTS & OPTIONS
Family Income | $0-10k
Cincinnati
Compare Zip Codes
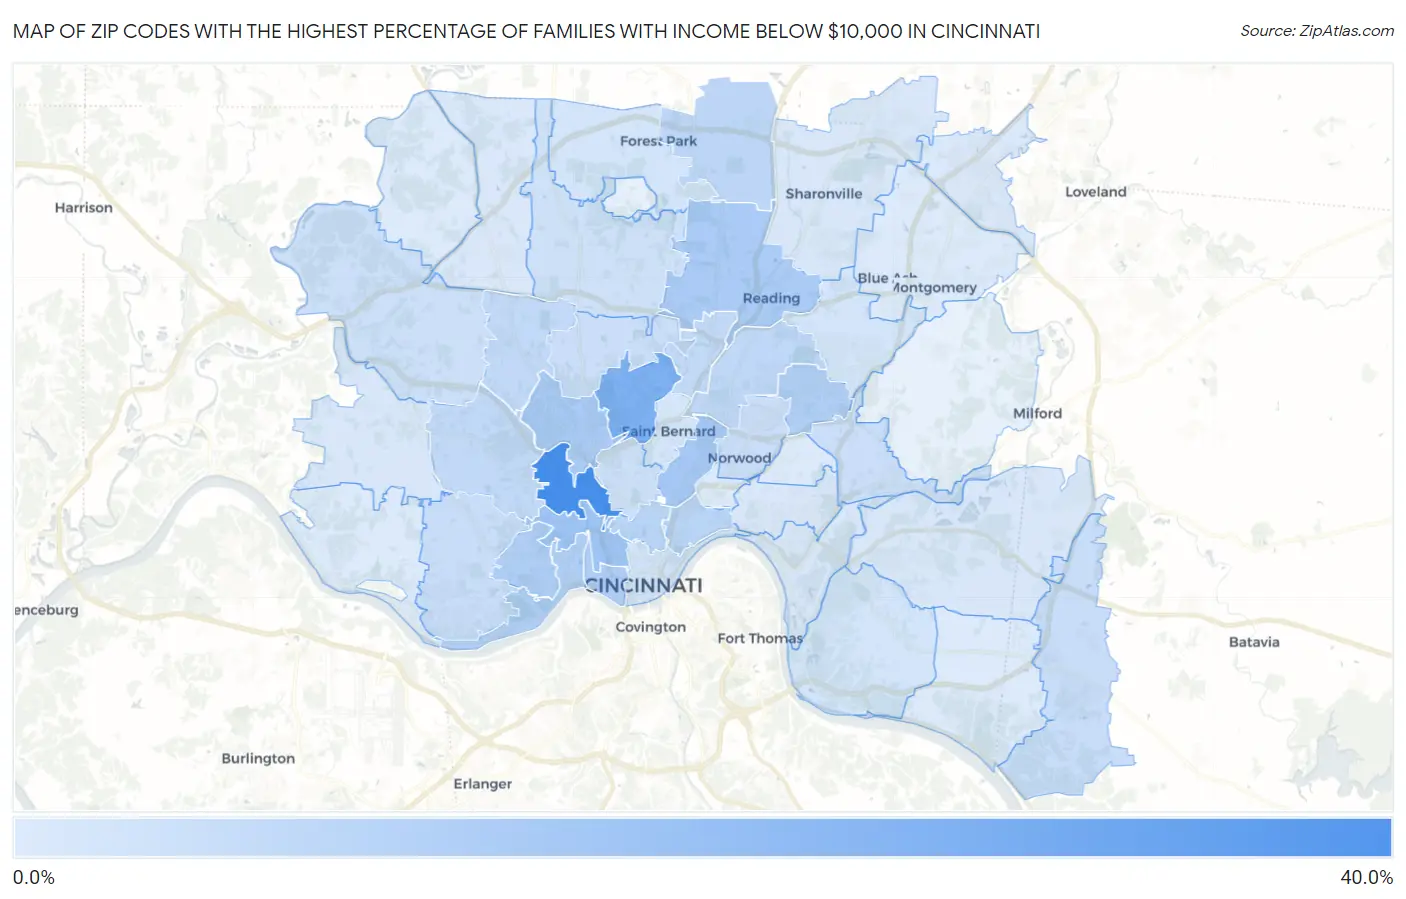
Map of Zip Codes with the Highest Percentage of Families with Income Below $10,000 in Cincinnati
0.40%
31.3%
Zip Codes with the Highest Percentage of Families with Income Below $10,000 in Cincinnati, OH
| Zip Code | Families with Income < $10k | vs State | vs National | |
| 1. | 45225 | 31.3% | 3.3%(+28.0)#5 | 3.1%(+28.2)#176 |
| 2. | 45232 | 19.1% | 3.3%(+15.8)#16 | 3.1%(+16.0)#522 |
| 3. | 45214 | 12.1% | 3.3%(+8.80)#41 | 3.1%(+9.00)#1,300 |
| 4. | 45229 | 10.8% | 3.3%(+7.50)#60 | 3.1%(+7.70)#1,650 |
| 5. | 45215 | 10.1% | 3.3%(+6.80)#70 | 3.1%(+7.00)#1,866 |
| 6. | 45223 | 10.0% | 3.3%(+6.70)#72 | 3.1%(+6.90)#1,909 |
| 7. | 45203 | 9.2% | 3.3%(+5.90)#87 | 3.1%(+6.10)#2,272 |
| 8. | 45205 | 8.9% | 3.3%(+5.60)#99 | 3.1%(+5.80)#2,404 |
| 9. | 45213 | 8.6% | 3.3%(+5.30)#106 | 3.1%(+5.50)#2,571 |
| 10. | 45204 | 8.4% | 3.3%(+5.10)#113 | 3.1%(+5.30)#2,728 |
| 11. | 45206 | 7.0% | 3.3%(+3.70)#154 | 3.1%(+3.90)#3,646 |
| 12. | 45219 | 6.6% | 3.3%(+3.30)#167 | 3.1%(+3.50)#4,003 |
| 13. | 45246 | 6.5% | 3.3%(+3.20)#171 | 3.1%(+3.40)#4,124 |
| 14. | 45237 | 5.8% | 3.3%(+2.50)#194 | 3.1%(+2.70)#4,914 |
| 15. | 45211 | 5.6% | 3.3%(+2.30)#204 | 3.1%(+2.50)#5,150 |
| 16. | 45216 | 5.5% | 3.3%(+2.20)#210 | 3.1%(+2.40)#5,350 |
| 17. | 45239 | 5.3% | 3.3%(+2.00)#221 | 3.1%(+2.20)#5,611 |
| 18. | 45245 | 4.1% | 3.3%(+0.800)#306 | 3.1%(+1.000)#7,922 |
| 19. | 45238 | 4.0% | 3.3%(+0.700)#314 | 3.1%(+0.900)#8,119 |
| 20. | 45227 | 3.8% | 3.3%(+0.500)#328 | 3.1%(+0.700)#8,704 |
| 21. | 45224 | 3.7% | 3.3%(+0.400)#341 | 3.1%(+0.600)#9,000 |
| 22. | 45212 | 3.6% | 3.3%(+0.300)#350 | 3.1%(+0.500)#9,272 |
| 23. | 45247 | 3.3% | 3.3%(=0.000)#383 | 3.1%(+0.200)#10,163 |
| 24. | 45220 | 3.2% | 3.3%(-0.100)#399 | 3.1%(+0.100)#10,528 |
| 25. | 45231 | 3.1% | 3.3%(-0.200)#412 | 3.1%(=0.000)#10,771 |
| 26. | 45202 | 2.7% | 3.3%(-0.600)#463 | 3.1%(-0.400)#12,353 |
| 27. | 45240 | 2.2% | 3.3%(-1.10)#542 | 3.1%(-0.900)#14,387 |
| 28. | 45230 | 1.9% | 3.3%(-1.40)#599 | 3.1%(-1.20)#15,816 |
| 29. | 45236 | 1.9% | 3.3%(-1.40)#600 | 3.1%(-1.20)#15,831 |
| 30. | 45217 | 1.8% | 3.3%(-1.50)#622 | 3.1%(-1.30)#16,478 |
| 31. | 45226 | 1.4% | 3.3%(-1.90)#698 | 3.1%(-1.70)#18,432 |
| 32. | 45244 | 1.2% | 3.3%(-2.10)#731 | 3.1%(-1.90)#19,274 |
| 33. | 45248 | 1.2% | 3.3%(-2.10)#732 | 3.1%(-1.90)#19,310 |
| 34. | 45241 | 1.2% | 3.3%(-2.10)#733 | 3.1%(-1.90)#19,314 |
| 35. | 45208 | 0.90% | 3.3%(-2.40)#779 | 3.1%(-2.20)#20,826 |
| 36. | 45251 | 0.80% | 3.3%(-2.50)#794 | 3.1%(-2.30)#21,285 |
| 37. | 45249 | 0.70% | 3.3%(-2.60)#814 | 3.1%(-2.40)#21,782 |
| 38. | 45255 | 0.60% | 3.3%(-2.70)#837 | 3.1%(-2.50)#22,211 |
| 39. | 45242 | 0.60% | 3.3%(-2.70)#838 | 3.1%(-2.50)#22,212 |
| 40. | 45252 | 0.50% | 3.3%(-2.80)#857 | 3.1%(-2.60)#22,815 |
| 41. | 45233 | 0.40% | 3.3%(-2.90)#873 | 3.1%(-2.70)#23,074 |
| 42. | 45209 | 0.40% | 3.3%(-2.90)#877 | 3.1%(-2.70)#23,117 |
| 43. | 45207 | 0.40% | 3.3%(-2.90)#881 | 3.1%(-2.70)#23,167 |
1
Common Questions
What are the Top 10 Zip Codes with the Highest Percentage of Families with Income Below $10,000 in Cincinnati, OH?
Top 10 Zip Codes with the Highest Percentage of Families with Income Below $10,000 in Cincinnati, OH are:
What zip code has the Highest Percentage of Families with Income Below $10,000 in Cincinnati, OH?
45225 has the Highest Percentage of Families with Income Below $10,000 in Cincinnati, OH with 31.3%.
What is the Percentage of Families with Income Below $10,000 in Cincinnati, OH?
Percentage of Families with Income Below $10,000 in Cincinnati is 7.6%.
What is the Percentage of Families with Income Below $10,000 in Ohio?
Percentage of Families with Income Below $10,000 in Ohio is 3.3%.
What is the Percentage of Families with Income Below $10,000 in the United States?
Percentage of Families with Income Below $10,000 in the United States is 3.1%.