Zip Codes with the Highest Percentage of Families with Income Below $10,000 in Steubenville, OH
RELATED REPORTS & OPTIONS
Family Income | $0-10k
Steubenville
Compare Zip Codes
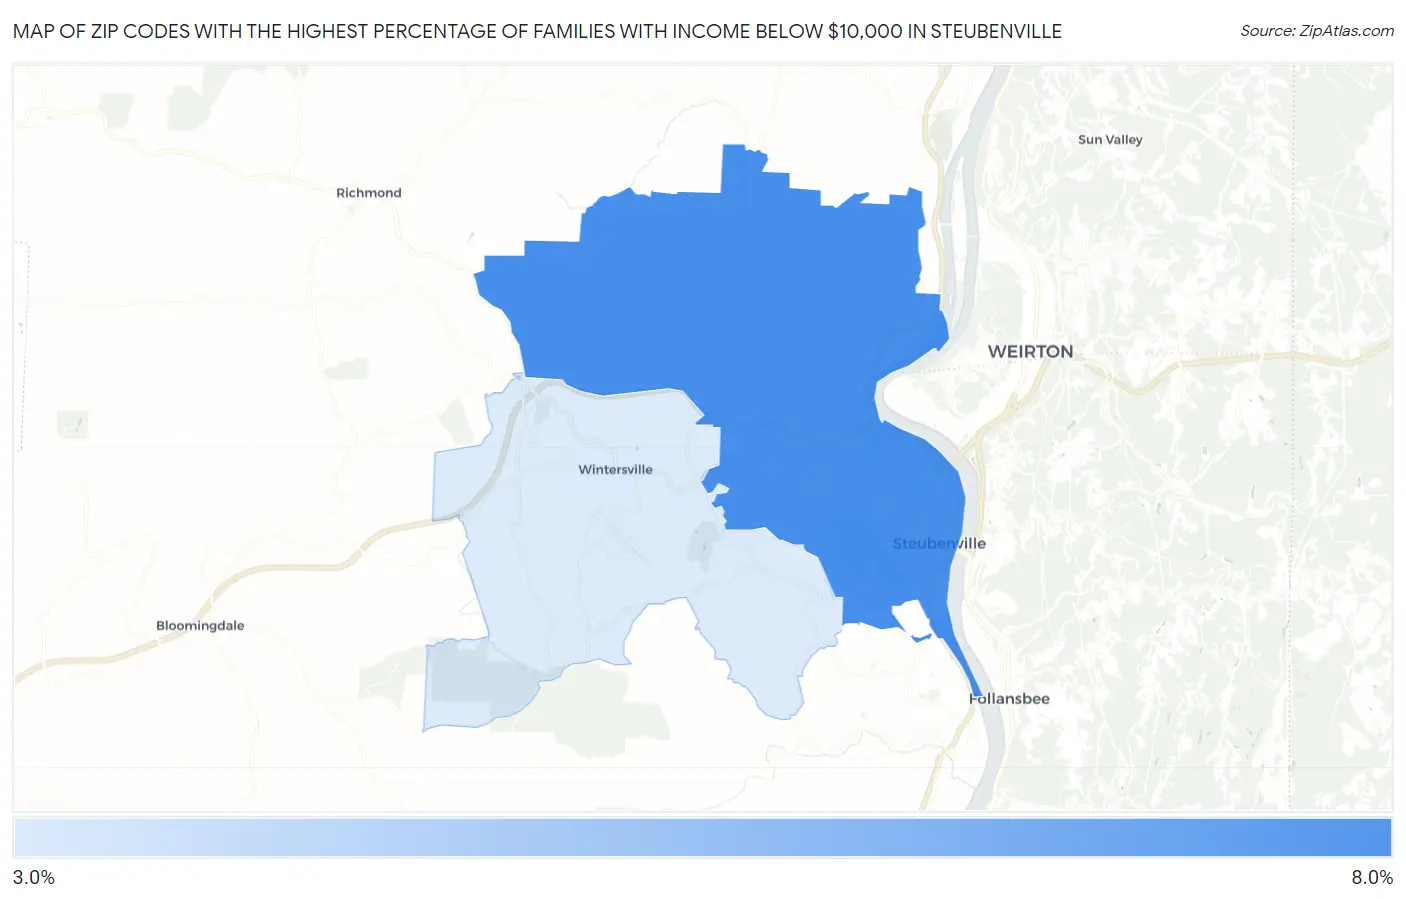
Map of Zip Codes with the Highest Percentage of Families with Income Below $10,000 in Steubenville
3.3%
7.1%
Zip Codes with the Highest Percentage of Families with Income Below $10,000 in Steubenville, OH
| Zip Code | Families with Income < $10k | vs State | vs National | |
| 1. | 43952 | 7.1% | 3.3%(+3.80)#150 | 3.1%(+4.00)#3,556 |
| 2. | 43953 | 3.3% | 3.3%(=0.000)#388 | 3.1%(+0.200)#10,221 |
1
Common Questions
What are the Top Zip Codes with the Highest Percentage of Families with Income Below $10,000 in Steubenville, OH?
Top Zip Codes with the Highest Percentage of Families with Income Below $10,000 in Steubenville, OH are:
What zip code has the Highest Percentage of Families with Income Below $10,000 in Steubenville, OH?
43952 has the Highest Percentage of Families with Income Below $10,000 in Steubenville, OH with 7.1%.
What is the Percentage of Families with Income Below $10,000 in Steubenville, OH?
Percentage of Families with Income Below $10,000 in Steubenville is 7.8%.
What is the Percentage of Families with Income Below $10,000 in Ohio?
Percentage of Families with Income Below $10,000 in Ohio is 3.3%.
What is the Percentage of Families with Income Below $10,000 in the United States?
Percentage of Families with Income Below $10,000 in the United States is 3.1%.