Radnor, OH Map & Demographics
Radnor Map
Radnor Overview
$38,967
PER CAPITA INCOME
$56,111
AVG FAMILY INCOME
$67,778
AVG HOUSEHOLD INCOME
0.23
INEQUALITY / GINI INDEX
167
TOTAL POPULATION
100
MALE POPULATION
67
FEMALE POPULATION
149.25
MALES / 100 FEMALES
67.00
FEMALES / 100 MALES
53.1
MEDIAN AGE
2.0
AVG FAMILY SIZE
1.5
AVG HOUSEHOLD SIZE
117
LABOR FORCE [ PEOPLE ]
78.0%
PERCENT IN LABOR FORCE
Radnor Zip Codes
Income in Radnor
Income Overview in Radnor
Per Capita Income in Radnor is $38,967, while median incomes of families and households are $56,111 and $67,778 respectively.
| Characteristic | Number | Measure |
| Per Capita Income | 167 | $38,967 |
| Median Family Income | 54 | $56,111 |
| Mean Family Income | 54 | $58,524 |
| Median Household Income | 114 | $67,778 |
| Mean Household Income | 114 | $56,600 |
| Income Deficit | 54 | $0 |
| Wage / Income Gap (%) | 167 | 0.00% |
| Wage / Income Gap ($) | 167 | 100.00¢ per $1 |
| Gini / Inequality Index | 167 | 0.23 |
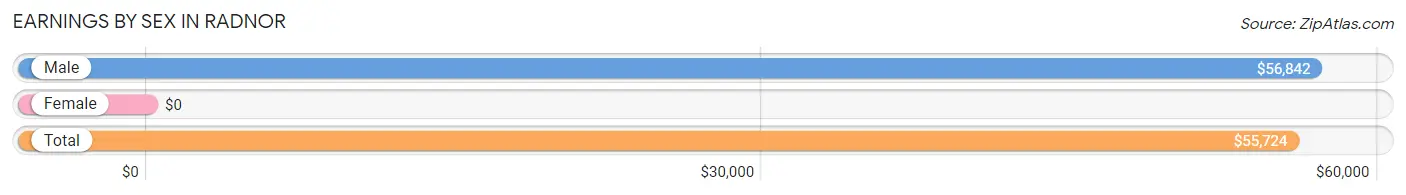
Earnings by Sex in Radnor
| Sex | Number | Average Earnings |
| Male | 100 (85.5%) | $56,842 |
| Female | 17 (14.5%) | $0 |
| Total | 117 (100.0%) | $55,724 |
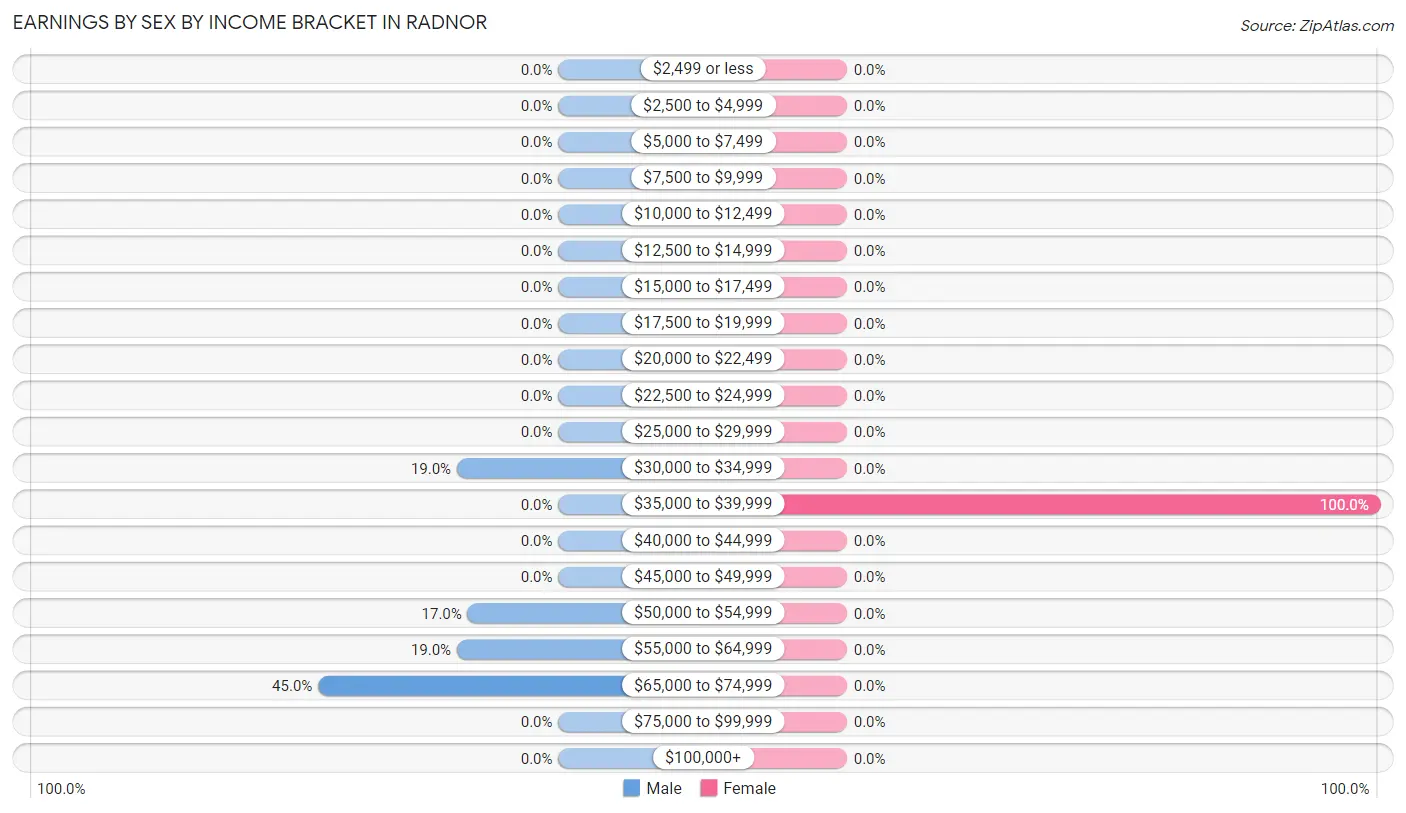
Earnings by Sex by Income Bracket in Radnor
The most common earnings brackets in Radnor are $65,000 to $74,999 for men (45 | 45.0%) and $35,000 to $39,999 for women (17 | 100.0%).
| Income | Male | Female |
| $2,499 or less | 0 (0.0%) | 0 (0.0%) |
| $2,500 to $4,999 | 0 (0.0%) | 0 (0.0%) |
| $5,000 to $7,499 | 0 (0.0%) | 0 (0.0%) |
| $7,500 to $9,999 | 0 (0.0%) | 0 (0.0%) |
| $10,000 to $12,499 | 0 (0.0%) | 0 (0.0%) |
| $12,500 to $14,999 | 0 (0.0%) | 0 (0.0%) |
| $15,000 to $17,499 | 0 (0.0%) | 0 (0.0%) |
| $17,500 to $19,999 | 0 (0.0%) | 0 (0.0%) |
| $20,000 to $22,499 | 0 (0.0%) | 0 (0.0%) |
| $22,500 to $24,999 | 0 (0.0%) | 0 (0.0%) |
| $25,000 to $29,999 | 0 (0.0%) | 0 (0.0%) |
| $30,000 to $34,999 | 19 (19.0%) | 0 (0.0%) |
| $35,000 to $39,999 | 0 (0.0%) | 17 (100.0%) |
| $40,000 to $44,999 | 0 (0.0%) | 0 (0.0%) |
| $45,000 to $49,999 | 0 (0.0%) | 0 (0.0%) |
| $50,000 to $54,999 | 17 (17.0%) | 0 (0.0%) |
| $55,000 to $64,999 | 19 (19.0%) | 0 (0.0%) |
| $65,000 to $74,999 | 45 (45.0%) | 0 (0.0%) |
| $75,000 to $99,999 | 0 (0.0%) | 0 (0.0%) |
| $100,000+ | 0 (0.0%) | 0 (0.0%) |
| Total | 100 (100.0%) | 17 (100.0%) |
Earnings by Sex by Educational Attainment in Radnor
| Educational Attainment | Male Income | Female Income |
| Less than High School | - | - |
| High School Diploma | - | - |
| College or Associate's Degree | - | - |
| Bachelor's Degree | - | - |
| Graduate Degree | - | - |
| Total | $56,842 | $0 |
Family Income in Radnor
Family Income Brackets in Radnor
According to the Radnor family income data, there are 19 families falling into the $25,000 to $34,999 income range, which is the most common income bracket and makes up 35.2% of all families.
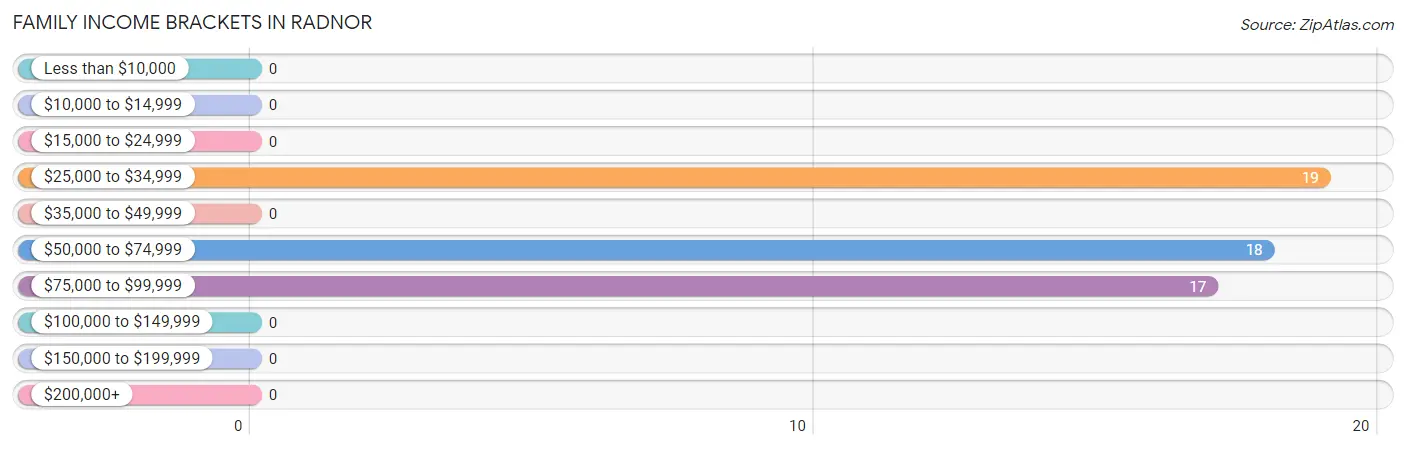
| Income Bracket | # Families | % Families |
| Less than $10,000 | 0 | 0.0% |
| $10,000 to $14,999 | 0 | 0.0% |
| $15,000 to $24,999 | 0 | 0.0% |
| $25,000 to $34,999 | 19 | 35.2% |
| $35,000 to $49,999 | 0 | 0.0% |
| $50,000 to $74,999 | 18 | 33.3% |
| $75,000 to $99,999 | 17 | 31.5% |
| $100,000 to $149,999 | 0 | 0.0% |
| $150,000 to $199,999 | 0 | 0.0% |
| $200,000+ | 0 | 0.0% |
Family Income by Famaliy Size in Radnor
2-person families (54 | 100.0%) account for the highest median family income in Radnor with $56,111 per family, while 2-person families (54 | 100.0%) have the highest median income of $28,056 per family member.
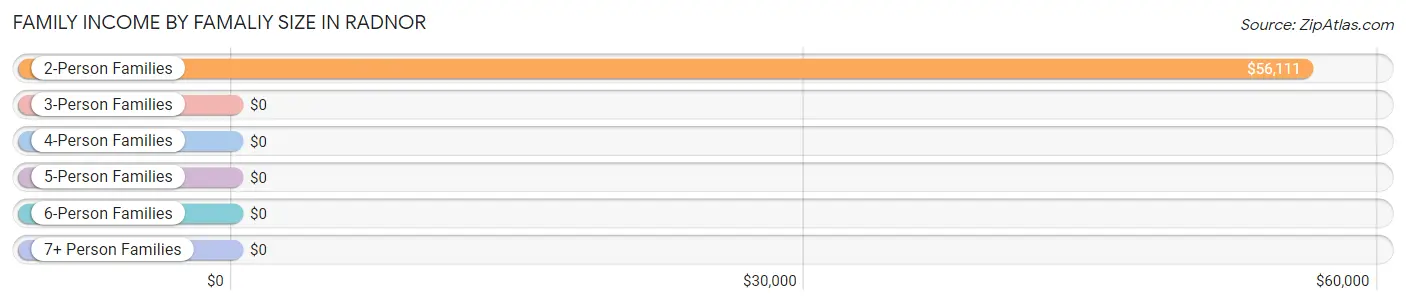
| Income Bracket | # Families | Median Income |
| 2-Person Families | 54 (100.0%) | $56,111 |
| 3-Person Families | 0 (0.0%) | $0 |
| 4-Person Families | 0 (0.0%) | $0 |
| 5-Person Families | 0 (0.0%) | $0 |
| 6-Person Families | 0 (0.0%) | $0 |
| 7+ Person Families | 0 (0.0%) | $0 |
| Total | 54 (100.0%) | $56,111 |
Family Income by Number of Earners in Radnor
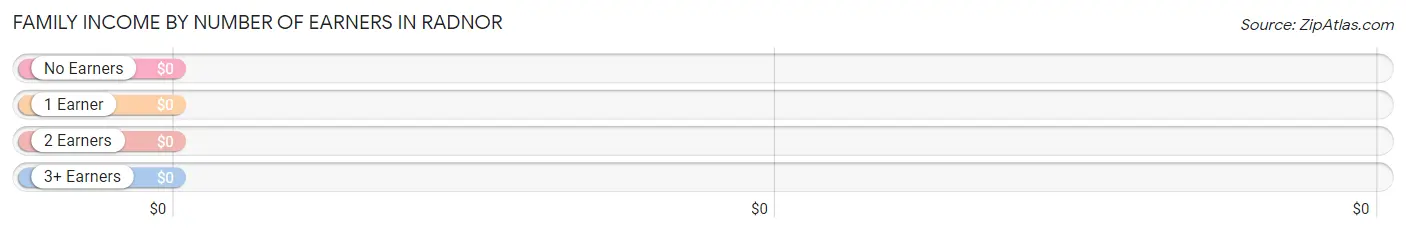
| Number of Earners | # Families | Median Income |
| No Earners | 0 (0.0%) | $0 |
| 1 Earner | 37 (68.5%) | $0 |
| 2 Earners | 17 (31.5%) | $0 |
| 3+ Earners | 0 (0.0%) | $0 |
| Total | 54 (100.0%) | $56,111 |
Household Income in Radnor
Household Income Brackets in Radnor
With 63 households falling in the category, the $50,000 to $74,999 income range is the most frequent in Radnor, accounting for 55.3% of all households.
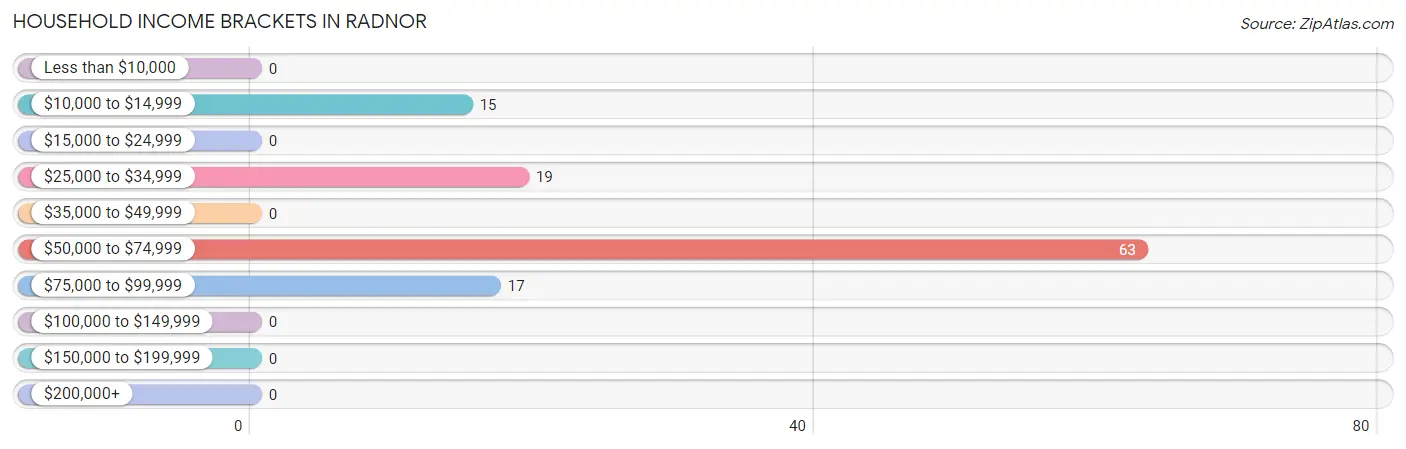
| Income Bracket | # Households | % Households |
| Less than $10,000 | 0 | 0.0% |
| $10,000 to $14,999 | 15 | 13.2% |
| $15,000 to $24,999 | 0 | 0.0% |
| $25,000 to $34,999 | 19 | 16.7% |
| $35,000 to $49,999 | 0 | 0.0% |
| $50,000 to $74,999 | 63 | 55.3% |
| $75,000 to $99,999 | 17 | 14.9% |
| $100,000 to $149,999 | 0 | 0.0% |
| $150,000 to $199,999 | 0 | 0.0% |
| $200,000+ | 0 | 0.0% |
Household Income by Householder Age in Radnor
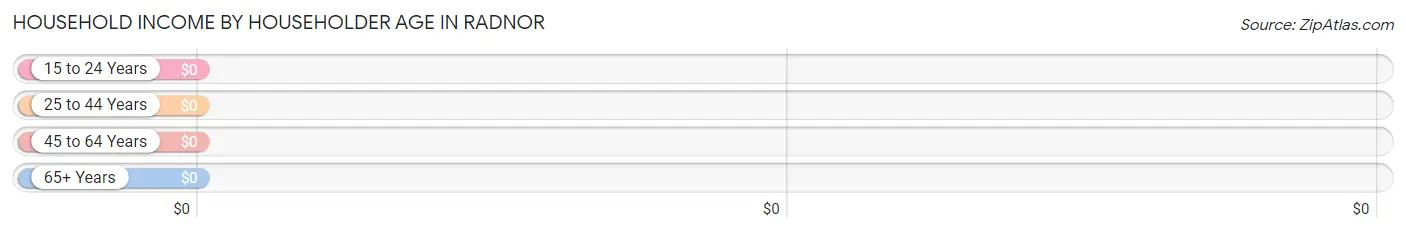
| Income Bracket | # Households | Median Income |
| 15 to 24 Years | 0 (0.0%) | $0 |
| 25 to 44 Years | 64 (56.1%) | $0 |
| 45 to 64 Years | 17 (14.9%) | $0 |
| 65+ Years | 33 (28.9%) | $0 |
| Total | 114 (100.0%) | $67,778 |
Poverty in Radnor
Income Below Poverty by Sex and Age in Radnor
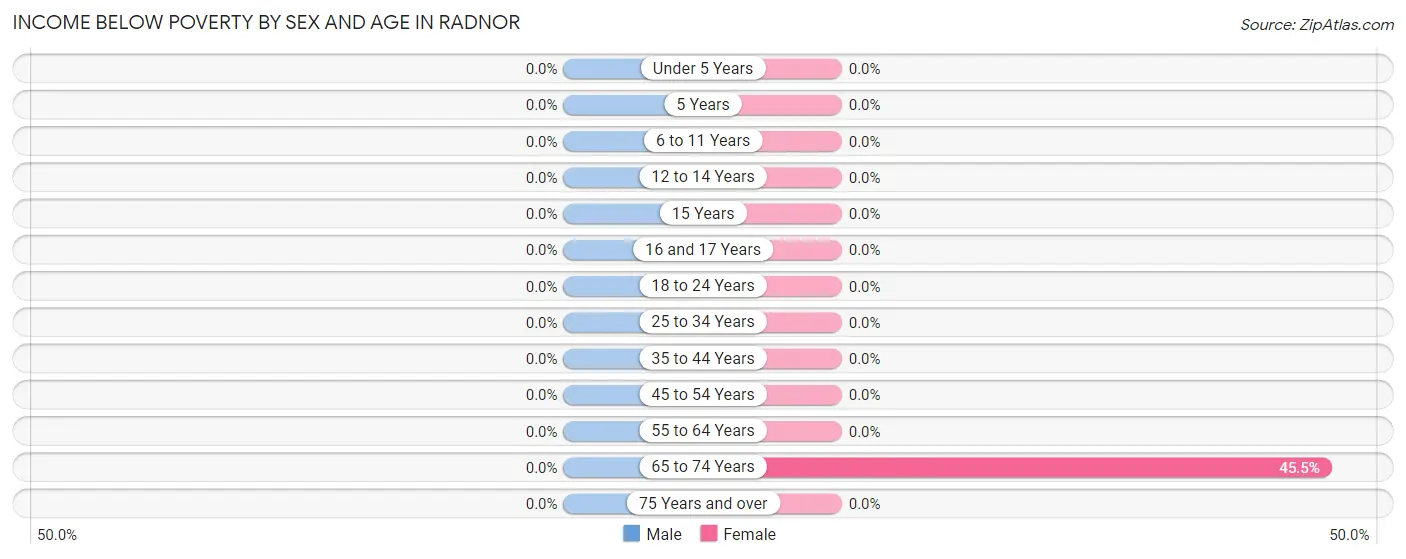
| Age Bracket | Male | Female |
| Under 5 Years | 0 (0.0%) | 0 (0.0%) |
| 5 Years | 0 (0.0%) | 0 (0.0%) |
| 6 to 11 Years | 0 (0.0%) | 0 (0.0%) |
| 12 to 14 Years | 0 (0.0%) | 0 (0.0%) |
| 15 Years | 0 (0.0%) | 0 (0.0%) |
| 16 and 17 Years | 0 (0.0%) | 0 (0.0%) |
| 18 to 24 Years | 0 (0.0%) | 0 (0.0%) |
| 25 to 34 Years | 0 (0.0%) | 0 (0.0%) |
| 35 to 44 Years | 0 (0.0%) | 0 (0.0%) |
| 45 to 54 Years | 0 (0.0%) | 0 (0.0%) |
| 55 to 64 Years | 0 (0.0%) | 0 (0.0%) |
| 65 to 74 Years | 0 (0.0%) | 15 (45.5%) |
| 75 Years and over | 0 (0.0%) | 0 (0.0%) |
| Total | 0 (0.0%) | 15 (22.4%) |
Income Above Poverty by Sex and Age in Radnor
According to the poverty statistics in Radnor, males aged 25 to 34 years and females aged 5 years are the age groups that are most secure financially, with 100.0% of males and 100.0% of females in these age groups living above the poverty line.
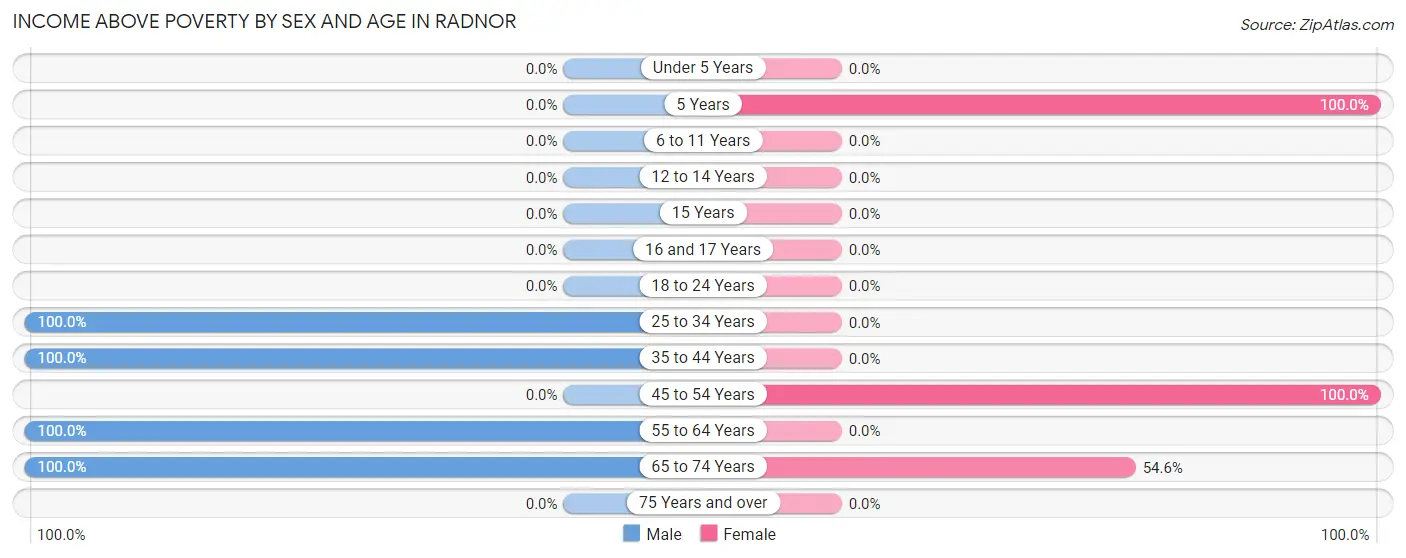
| Age Bracket | Male | Female |
| Under 5 Years | 0 (0.0%) | 0 (0.0%) |
| 5 Years | 0 (0.0%) | 17 (100.0%) |
| 6 to 11 Years | 0 (0.0%) | 0 (0.0%) |
| 12 to 14 Years | 0 (0.0%) | 0 (0.0%) |
| 15 Years | 0 (0.0%) | 0 (0.0%) |
| 16 and 17 Years | 0 (0.0%) | 0 (0.0%) |
| 18 to 24 Years | 0 (0.0%) | 0 (0.0%) |
| 25 to 34 Years | 19 (100.0%) | 0 (0.0%) |
| 35 to 44 Years | 45 (100.0%) | 0 (0.0%) |
| 45 to 54 Years | 0 (0.0%) | 17 (100.0%) |
| 55 to 64 Years | 17 (100.0%) | 0 (0.0%) |
| 65 to 74 Years | 19 (100.0%) | 18 (54.5%) |
| 75 Years and over | 0 (0.0%) | 0 (0.0%) |
| Total | 100 (100.0%) | 52 (77.6%) |
Income Below Poverty Among Married-Couple Families in Radnor
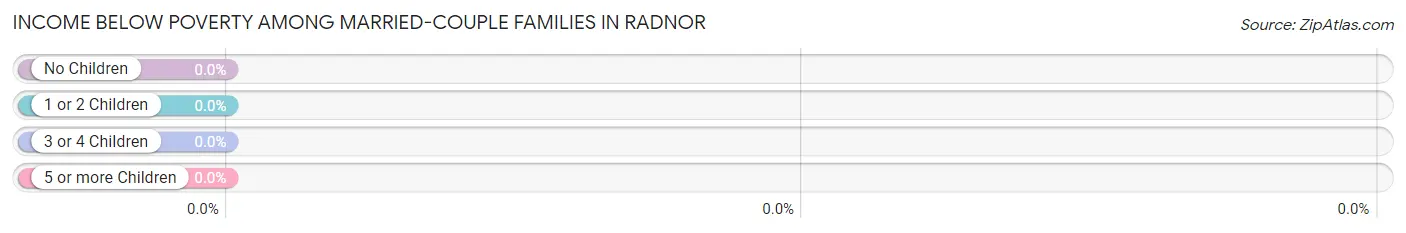
| Children | Above Poverty | Below Poverty |
| No Children | 35 (100.0%) | 0 (0.0%) |
| 1 or 2 Children | 0 (0.0%) | 0 (0.0%) |
| 3 or 4 Children | 0 (0.0%) | 0 (0.0%) |
| 5 or more Children | 0 (0.0%) | 0 (0.0%) |
| Total | 35 (100.0%) | 0 (0.0%) |
Income Below Poverty Among Single-Parent Households in Radnor
| Children | Single Father | Single Mother |
| No Children | 0 (0.0%) | 0 (0.0%) |
| 1 or 2 Children | 0 (0.0%) | 0 (0.0%) |
| 3 or 4 Children | 0 (0.0%) | 0 (0.0%) |
| 5 or more Children | 0 (0.0%) | 0 (0.0%) |
| Total | 0 (0.0%) | 0 (0.0%) |
Income Below Poverty Among Married-Couple vs Single-Parent Households in Radnor
| Children | Married-Couple Families | Single-Parent Households |
| No Children | 0 (0.0%) | 0 (0.0%) |
| 1 or 2 Children | 0 (0.0%) | 0 (0.0%) |
| 3 or 4 Children | 0 (0.0%) | 0 (0.0%) |
| 5 or more Children | 0 (0.0%) | 0 (0.0%) |
| Total | 0 (0.0%) | 0 (0.0%) |
Race in Radnor
The most populous races in Radnor are , and White / Caucasian (167 | 100.0%).
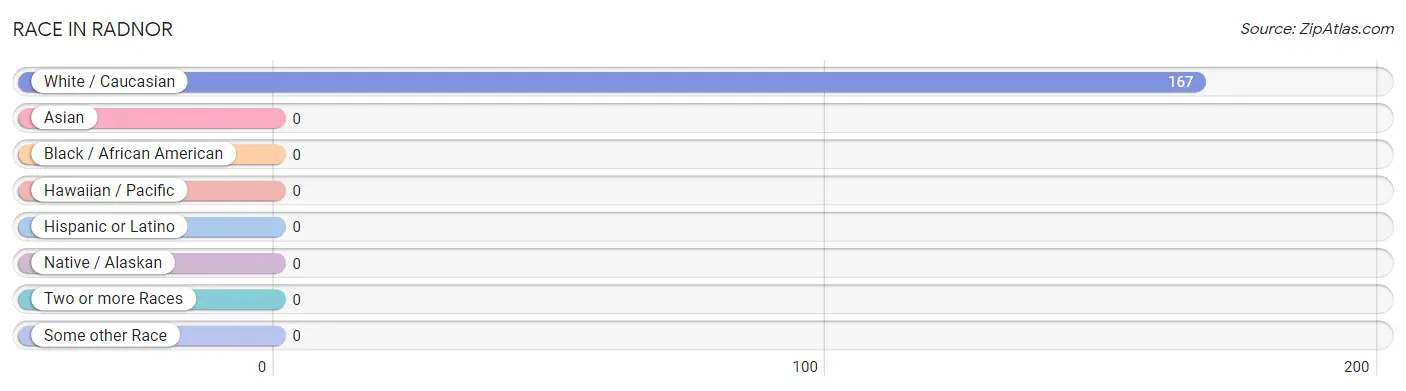
| Race | # Population | % Population |
| Asian | 0 | 0.0% |
| Black / African American | 0 | 0.0% |
| Hawaiian / Pacific | 0 | 0.0% |
| Hispanic or Latino | 0 | 0.0% |
| Native / Alaskan | 0 | 0.0% |
| White / Caucasian | 167 | 100.0% |
| Two or more Races | 0 | 0.0% |
| Some other Race | 0 | 0.0% |
| Total | 167 | 100.0% |
Ancestry in Radnor
The most populous ancestries reported in Radnor are Welsh (45 | 27.0%), Irish (37 | 22.2%), German (36 | 21.6%), Scotch-Irish (36 | 21.6%), and American (34 | 20.4%), together accounting for 112.6% of all Radnor residents.
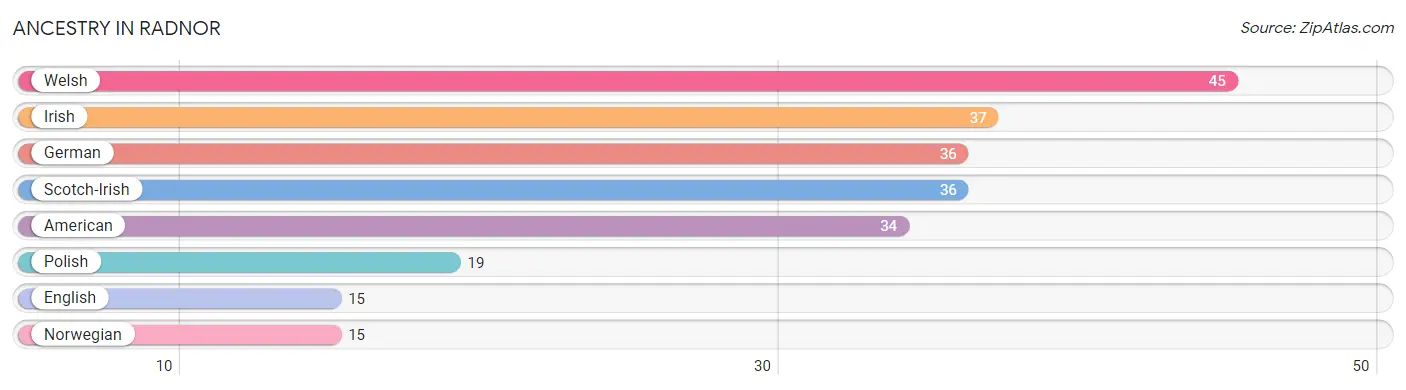
| Ancestry | # Population | % Population |
| American | 34 | 20.4% |
| English | 15 | 9.0% |
| German | 36 | 21.6% |
| Irish | 37 | 22.2% |
| Norwegian | 15 | 9.0% |
| Polish | 19 | 11.4% |
| Scotch-Irish | 36 | 21.6% |
| Welsh | 45 | 27.0% | View All 8 Rows |
Immigrants in Radnor

| Immigration Origin | # Population | % Population | View All 0 Rows |
Sex and Age in Radnor
Sex and Age in Radnor
The most populous age groups in Radnor are 40 to 44 Years (45 | 45.0%) for men and 65 to 69 Years (33 | 49.2%) for women.
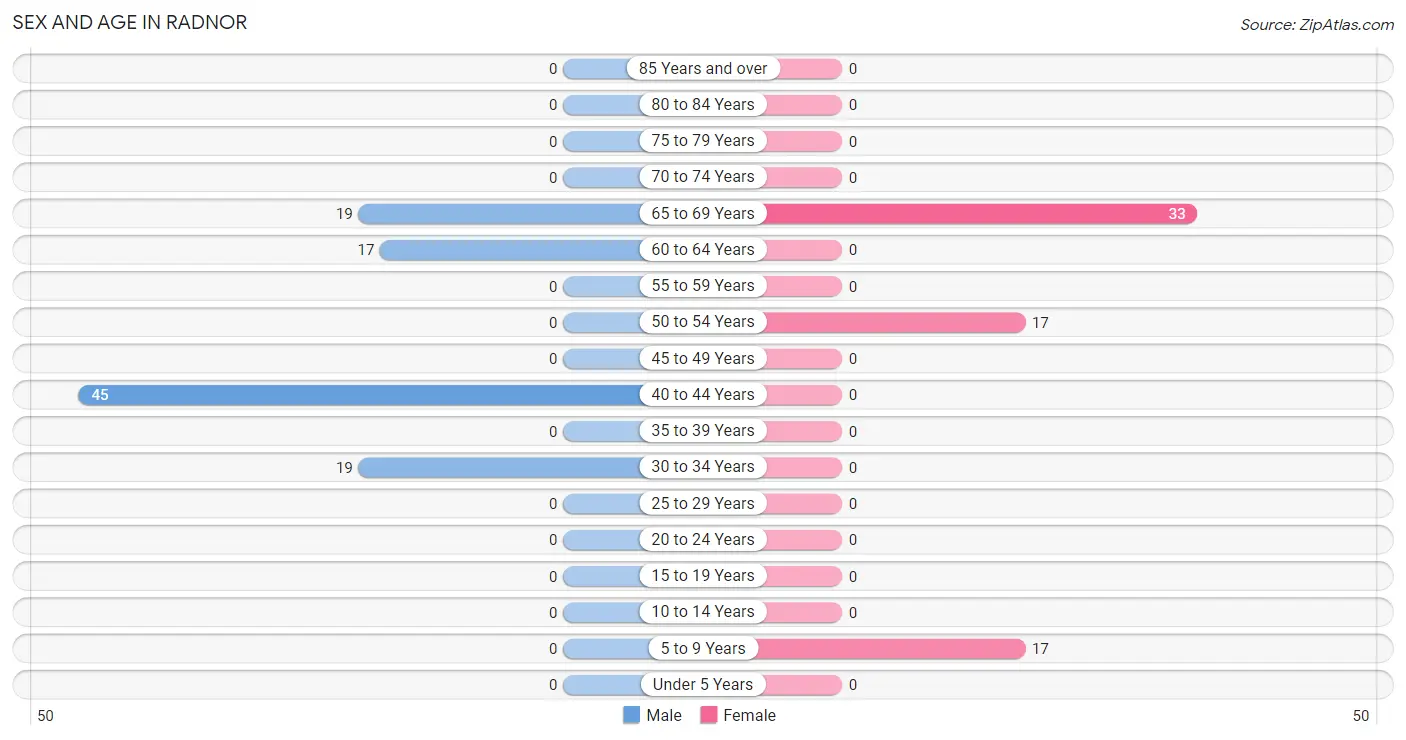
| Age Bracket | Male | Female |
| Under 5 Years | 0 (0.0%) | 0 (0.0%) |
| 5 to 9 Years | 0 (0.0%) | 17 (25.4%) |
| 10 to 14 Years | 0 (0.0%) | 0 (0.0%) |
| 15 to 19 Years | 0 (0.0%) | 0 (0.0%) |
| 20 to 24 Years | 0 (0.0%) | 0 (0.0%) |
| 25 to 29 Years | 0 (0.0%) | 0 (0.0%) |
| 30 to 34 Years | 19 (19.0%) | 0 (0.0%) |
| 35 to 39 Years | 0 (0.0%) | 0 (0.0%) |
| 40 to 44 Years | 45 (45.0%) | 0 (0.0%) |
| 45 to 49 Years | 0 (0.0%) | 0 (0.0%) |
| 50 to 54 Years | 0 (0.0%) | 17 (25.4%) |
| 55 to 59 Years | 0 (0.0%) | 0 (0.0%) |
| 60 to 64 Years | 17 (17.0%) | 0 (0.0%) |
| 65 to 69 Years | 19 (19.0%) | 33 (49.2%) |
| 70 to 74 Years | 0 (0.0%) | 0 (0.0%) |
| 75 to 79 Years | 0 (0.0%) | 0 (0.0%) |
| 80 to 84 Years | 0 (0.0%) | 0 (0.0%) |
| 85 Years and over | 0 (0.0%) | 0 (0.0%) |
| Total | 100 (100.0%) | 67 (100.0%) |
Families and Households in Radnor
Median Family Size in Radnor
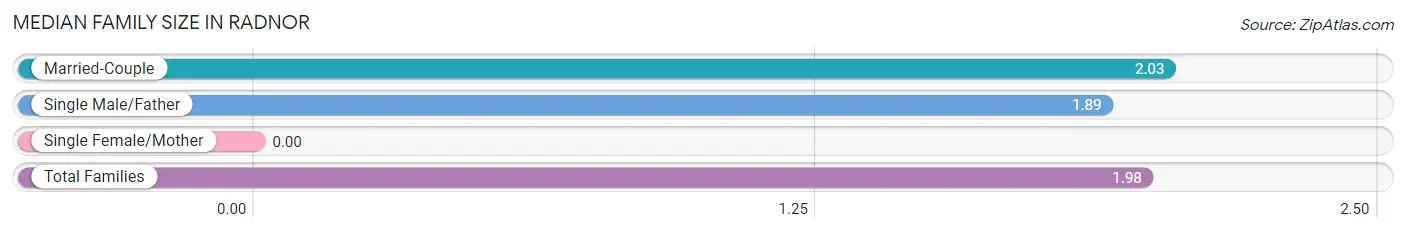
| Family Type | # Families | Family Size |
| Married-Couple | 35 (64.8%) | 2.03 |
| Single Male/Father | 19 (35.2%) | 1.89 |
| Single Female/Mother | 0 (0.0%) | - |
| Total Families | 54 (100.0%) | 1.98 |
Median Household Size in Radnor
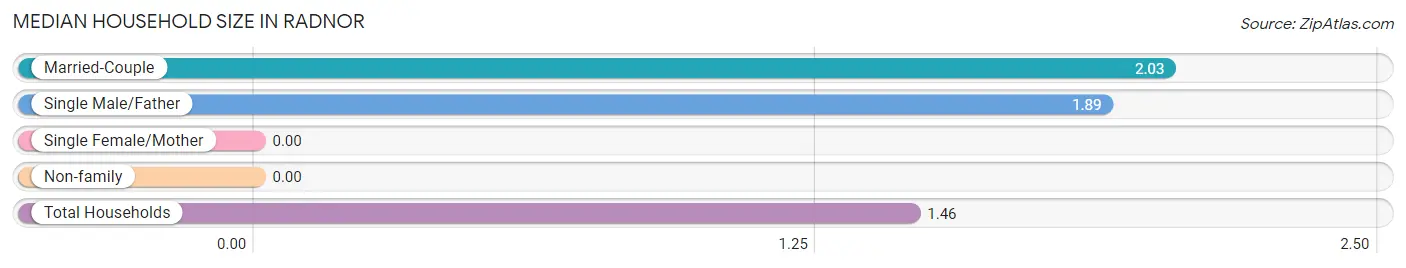
| Household Type | # Households | Household Size |
| Married-Couple | 35 (30.7%) | 2.03 |
| Single Male/Father | 19 (16.7%) | 1.89 |
| Single Female/Mother | 0 (0.0%) | - |
| Non-family | 60 (52.6%) | - |
| Total Households | 114 (100.0%) | 1.46 |
Household Size by Marriage Status in Radnor
Out of a total of 114 households in Radnor, 54 (47.4%) are family households, while 60 (52.6%) are nonfamily households. The most numerous type of family households are 2-person households, comprising 54, and the most common type of nonfamily households are 1-person households, comprising 60.
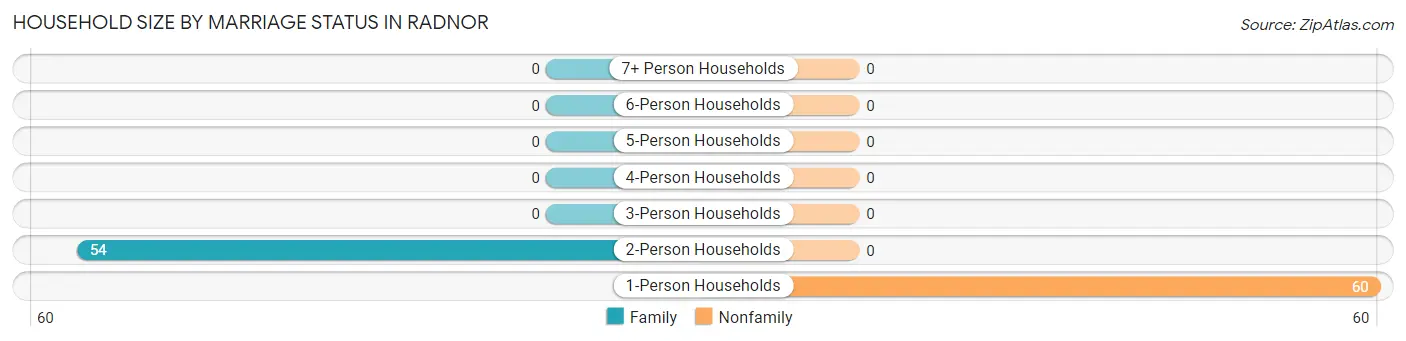
| Household Size | Family Households | Nonfamily Households |
| 1-Person Households | - | 60 (52.6%) |
| 2-Person Households | 54 (47.4%) | 0 (0.0%) |
| 3-Person Households | 0 (0.0%) | 0 (0.0%) |
| 4-Person Households | 0 (0.0%) | 0 (0.0%) |
| 5-Person Households | 0 (0.0%) | 0 (0.0%) |
| 6-Person Households | 0 (0.0%) | 0 (0.0%) |
| 7+ Person Households | 0 (0.0%) | 0 (0.0%) |
| Total | 54 (47.4%) | 60 (52.6%) |
Female Fertility in Radnor
Fertility by Age in Radnor
| Age Bracket | Women with Births | Births / 1,000 Women |
| 15 to 19 years | 0 (0.0%) | 0.0 |
| 20 to 34 years | 0 (0.0%) | 0.0 |
| 35 to 50 years | 0 (0.0%) | 0.0 |
| Total | 0 (0.0%) | 0.0 |
Fertility by Age by Marriage Status in Radnor
| Age Bracket | Married | Unmarried |
| 15 to 19 years | 0 (0.0%) | 0 (0.0%) |
| 20 to 34 years | 0 (0.0%) | 0 (0.0%) |
| 35 to 50 years | 0 (0.0%) | 0 (0.0%) |
| Total | 0 (0.0%) | 0 (0.0%) |
Fertility by Education in Radnor
| Educational Attainment | Women with Births | Births / 1,000 Women |
| Less than High School | 0 (0.0%) | 0.0 |
| High School Diploma | 0 (0.0%) | 0.0 |
| College or Associate's Degree | 0 (0.0%) | 0.0 |
| Bachelor's Degree | 0 (0.0%) | 0.0 |
| Graduate Degree | 0 (0.0%) | 0.0 |
| Total | 0 (0.0%) | 0.0 |
Fertility by Education by Marriage Status in Radnor
| Educational Attainment | Married | Unmarried |
| Less than High School | 0 (0.0%) | 0 (0.0%) |
| High School Diploma | 0 (0.0%) | 0 (0.0%) |
| College or Associate's Degree | 0 (0.0%) | 0 (0.0%) |
| Bachelor's Degree | 0 (0.0%) | 0 (0.0%) |
| Graduate Degree | 0 (0.0%) | 0 (0.0%) |
| Total | 0 (0.0%) | 0 (0.0%) |
Employment Characteristics in Radnor
Employment by Class of Employer in Radnor
Among the 117 employed individuals in Radnor, private company employees (53 | 45.3%), local government employees (45 | 38.5%), and not-for-profit organizations (19 | 16.2%) make up the most common classes of employment.
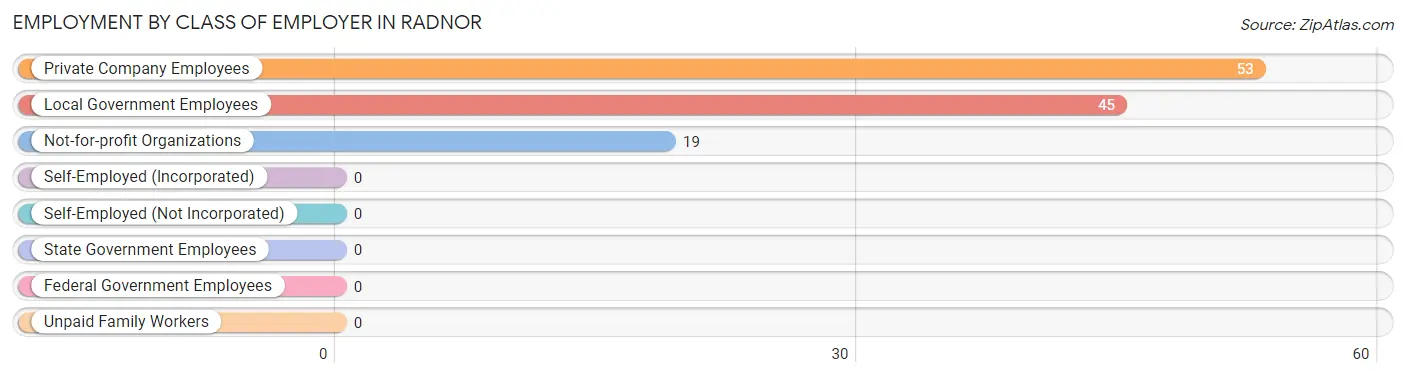
| Employer Class | # Employees | % Employees |
| Private Company Employees | 53 | 45.3% |
| Self-Employed (Incorporated) | 0 | 0.0% |
| Self-Employed (Not Incorporated) | 0 | 0.0% |
| Not-for-profit Organizations | 19 | 16.2% |
| Local Government Employees | 45 | 38.5% |
| State Government Employees | 0 | 0.0% |
| Federal Government Employees | 0 | 0.0% |
| Unpaid Family Workers | 0 | 0.0% |
| Total | 117 | 100.0% |
Employment Status by Age in Radnor
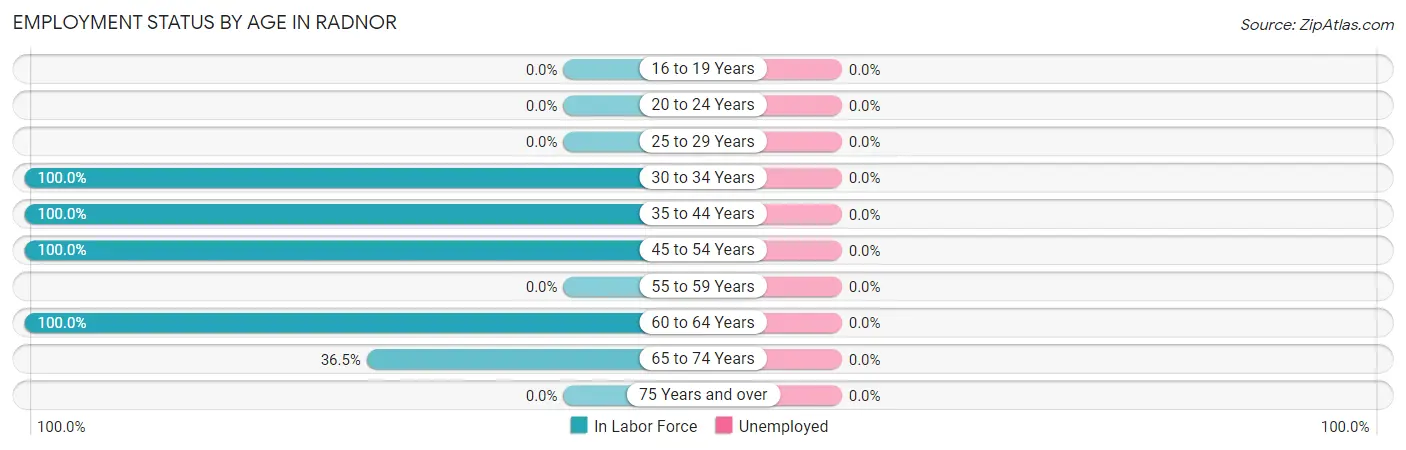
| Age Bracket | In Labor Force | Unemployed |
| 16 to 19 Years | 0 (0.0%) | 0 (0.0%) |
| 20 to 24 Years | 0 (0.0%) | 0 (0.0%) |
| 25 to 29 Years | 0 (0.0%) | 0 (0.0%) |
| 30 to 34 Years | 19 (100.0%) | 0 (0.0%) |
| 35 to 44 Years | 45 (100.0%) | 0 (0.0%) |
| 45 to 54 Years | 17 (100.0%) | 0 (0.0%) |
| 55 to 59 Years | 0 (0.0%) | 0 (0.0%) |
| 60 to 64 Years | 17 (100.0%) | 0 (0.0%) |
| 65 to 74 Years | 19 (36.5%) | 0 (0.0%) |
| 75 Years and over | 0 (0.0%) | 0 (0.0%) |
| Total | 117 (78.0%) | 0 (0.0%) |
Employment Status by Educational Attainment in Radnor
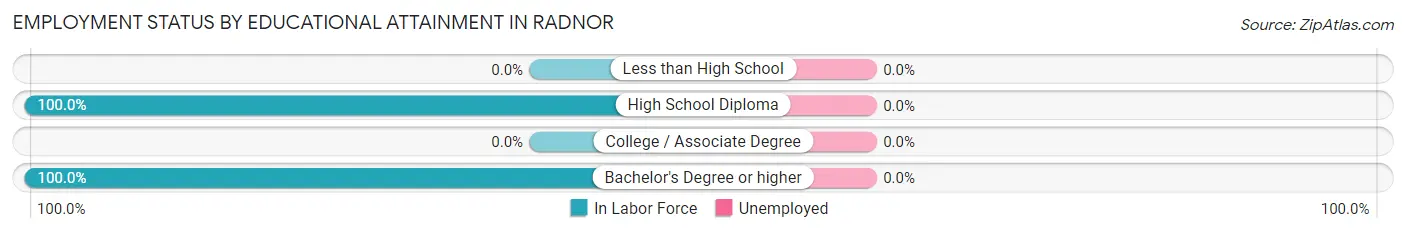
| Educational Attainment | In Labor Force | Unemployed |
| Less than High School | 0 (0.0%) | 0 (0.0%) |
| High School Diploma | 62 (100.0%) | 0 (0.0%) |
| College / Associate Degree | 0 (0.0%) | 0 (0.0%) |
| Bachelor's Degree or higher | 36 (100.0%) | 0 (0.0%) |
| Total | 98 (100.0%) | 0 (0.0%) |
Employment Occupations by Sex in Radnor
Management, Business, Science and Arts Occupations
The most common Management, Business, Science and Arts occupations in Radnor are , and Management (17 | 14.5%).
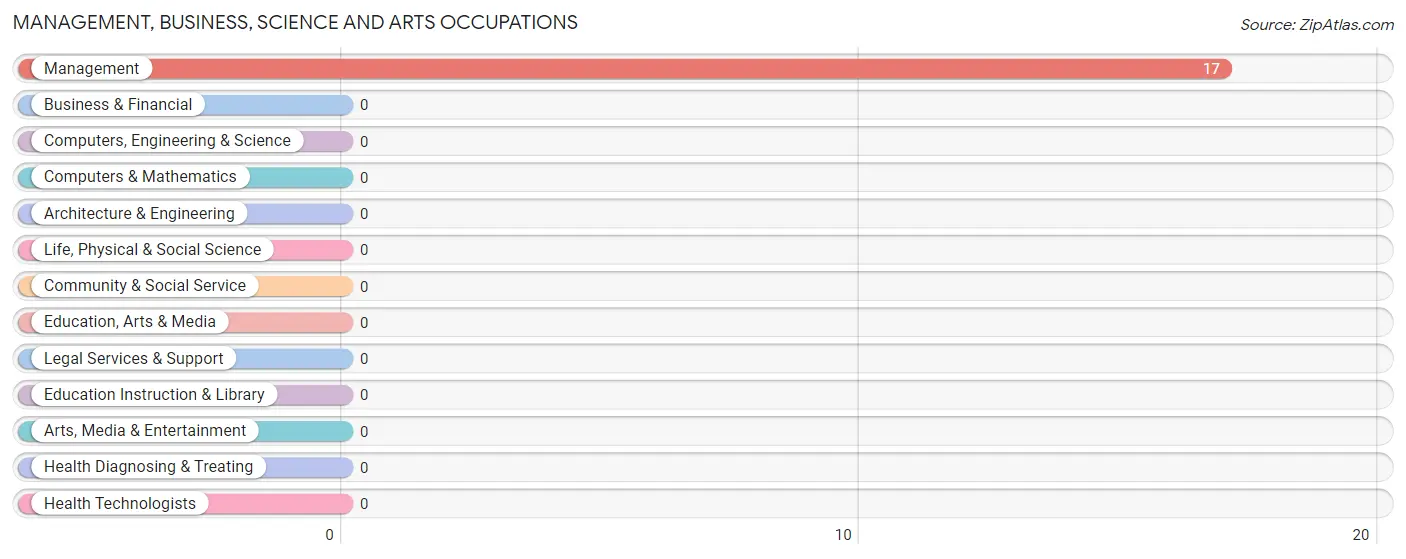
Management, Business, Science and Arts Occupations by Sex
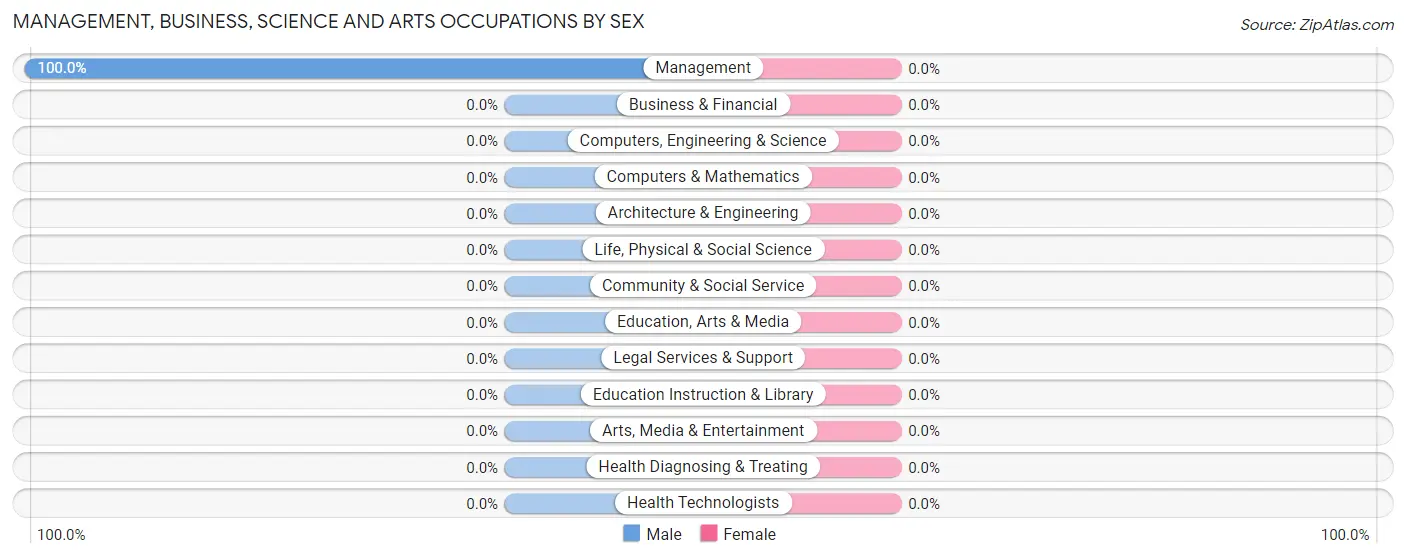
| Occupation | Male | Female |
| Management | 17 (100.0%) | 0 (0.0%) |
| Business & Financial | 0 (0.0%) | 0 (0.0%) |
| Computers, Engineering & Science | 0 (0.0%) | 0 (0.0%) |
| Computers & Mathematics | 0 (0.0%) | 0 (0.0%) |
| Architecture & Engineering | 0 (0.0%) | 0 (0.0%) |
| Life, Physical & Social Science | 0 (0.0%) | 0 (0.0%) |
| Community & Social Service | 0 (0.0%) | 0 (0.0%) |
| Education, Arts & Media | 0 (0.0%) | 0 (0.0%) |
| Legal Services & Support | 0 (0.0%) | 0 (0.0%) |
| Education Instruction & Library | 0 (0.0%) | 0 (0.0%) |
| Arts, Media & Entertainment | 0 (0.0%) | 0 (0.0%) |
| Health Diagnosing & Treating | 0 (0.0%) | 0 (0.0%) |
| Health Technologists | 0 (0.0%) | 0 (0.0%) |
| Total (Category) | 17 (100.0%) | 0 (0.0%) |
| Total (Overall) | 100 (85.5%) | 17 (14.5%) |
Services Occupations
The most common Services occupations in Radnor are , and Cleaning & Maintenance (64 | 54.7%).
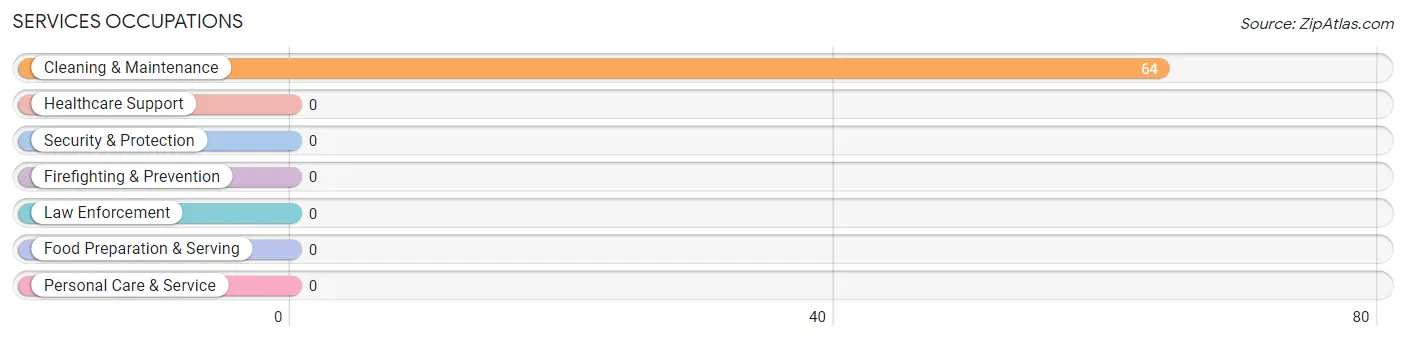
Services Occupations by Sex
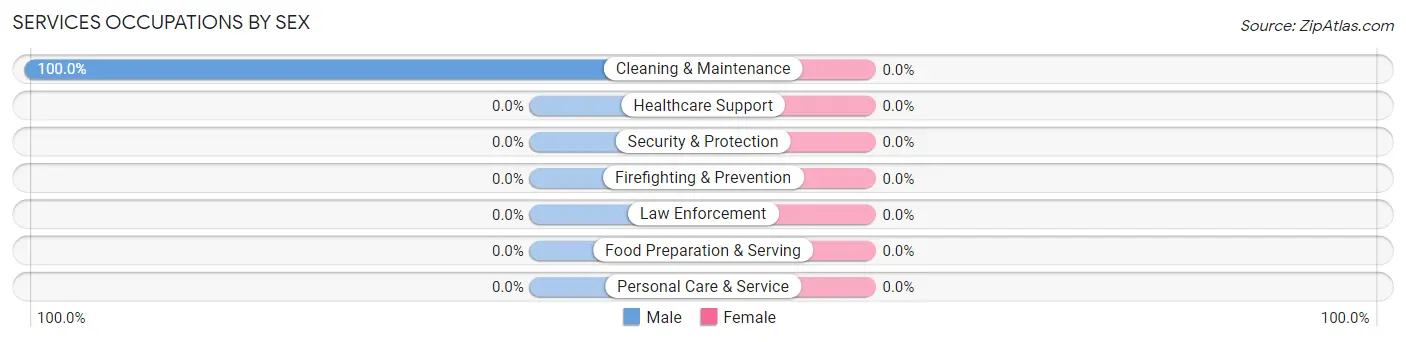
| Occupation | Male | Female |
| Healthcare Support | 0 (0.0%) | 0 (0.0%) |
| Security & Protection | 0 (0.0%) | 0 (0.0%) |
| Firefighting & Prevention | 0 (0.0%) | 0 (0.0%) |
| Law Enforcement | 0 (0.0%) | 0 (0.0%) |
| Food Preparation & Serving | 0 (0.0%) | 0 (0.0%) |
| Cleaning & Maintenance | 64 (100.0%) | 0 (0.0%) |
| Personal Care & Service | 0 (0.0%) | 0 (0.0%) |
| Total (Category) | 64 (100.0%) | 0 (0.0%) |
| Total (Overall) | 100 (85.5%) | 17 (14.5%) |
Sales and Office Occupations
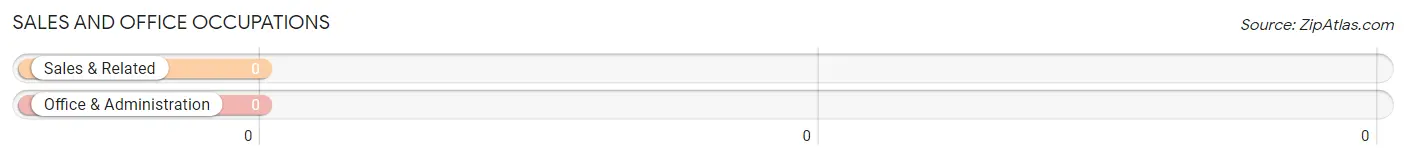
Sales and Office Occupations by Sex
| Occupation | Male | Female |
| Sales & Related | 0 (0.0%) | 0 (0.0%) |
| Office & Administration | 0 (0.0%) | 0 (0.0%) |
| Total (Category) | 0 (0.0%) | 0 (0.0%) |
| Total (Overall) | 100 (85.5%) | 17 (14.5%) |
Natural Resources, Construction and Maintenance Occupations
Natural Resources, Construction and Maintenance Occupations by Sex
| Occupation | Male | Female |
| Farming, Fishing & Forestry | 0 (0.0%) | 0 (0.0%) |
| Construction & Extraction | 0 (0.0%) | 0 (0.0%) |
| Installation, Maintenance & Repair | 0 (0.0%) | 0 (0.0%) |
| Total (Category) | 0 (0.0%) | 0 (0.0%) |
| Total (Overall) | 100 (85.5%) | 17 (14.5%) |
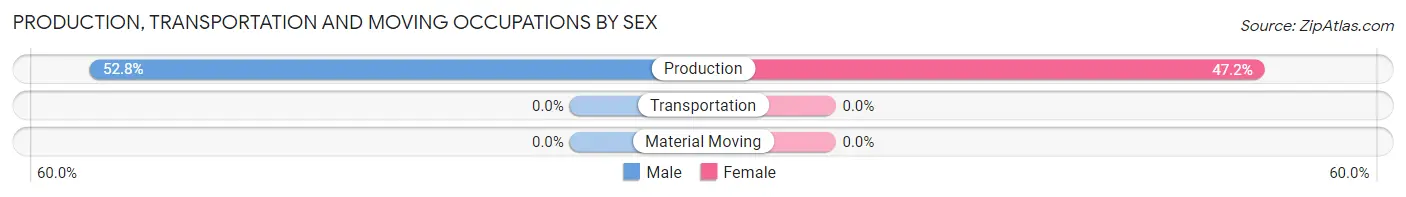
Production, Transportation and Moving Occupations
The most common Production, Transportation and Moving occupations in Radnor are , and Production (36 | 30.8%).
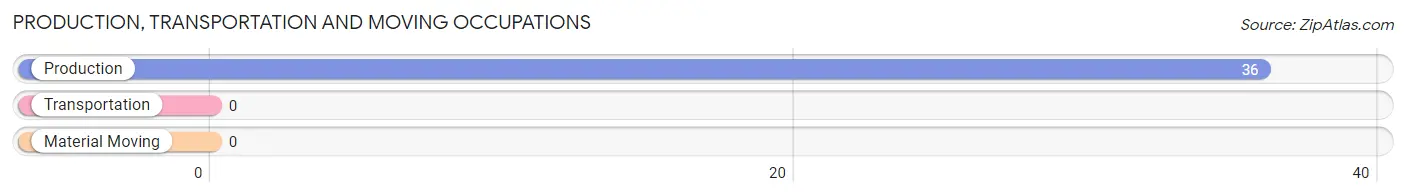
Production, Transportation and Moving Occupations by Sex
| Occupation | Male | Female |
| Production | 19 (52.8%) | 17 (47.2%) |
| Transportation | 0 (0.0%) | 0 (0.0%) |
| Material Moving | 0 (0.0%) | 0 (0.0%) |
| Total (Category) | 19 (52.8%) | 17 (47.2%) |
| Total (Overall) | 100 (85.5%) | 17 (14.5%) |
Employment Industries by Sex in Radnor
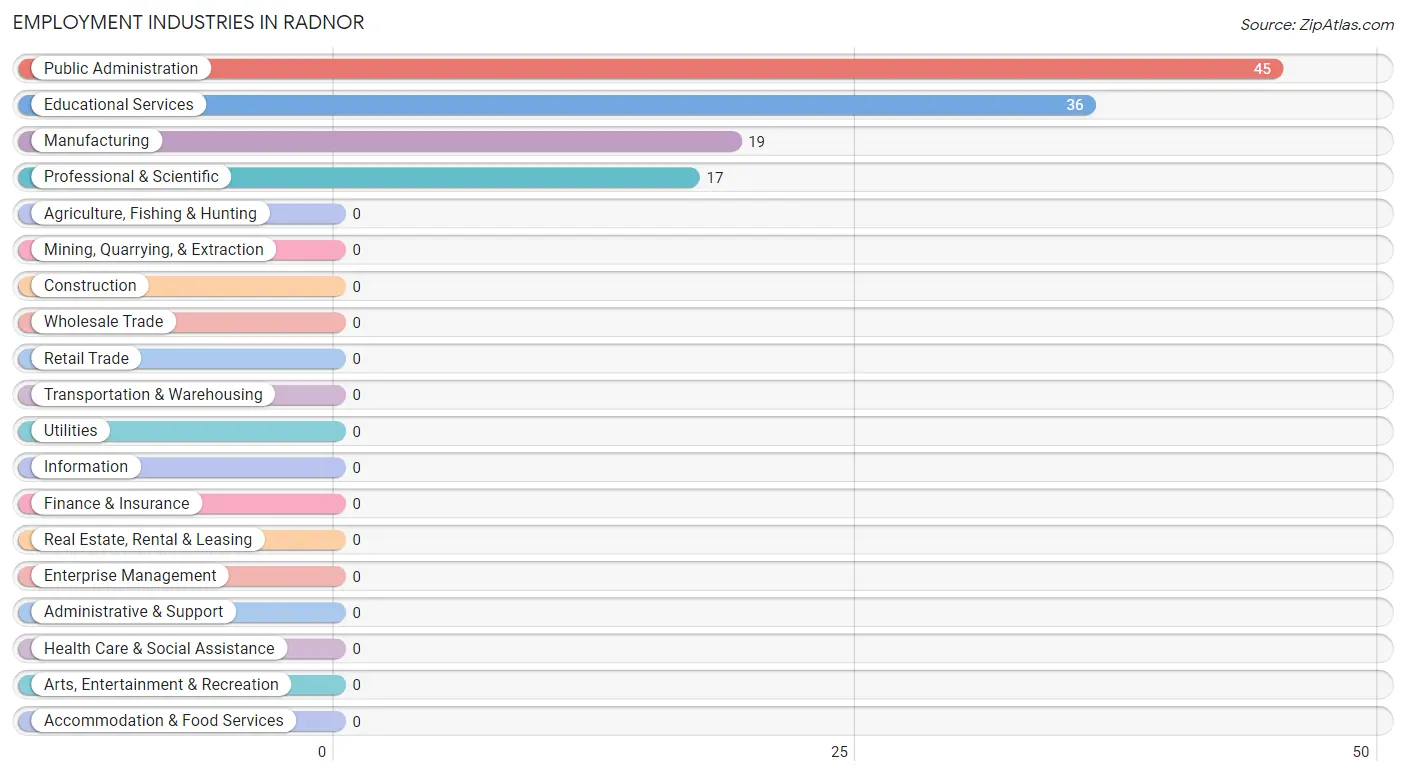
Employment Industries in Radnor
The major employment industries in Radnor include Public Administration (45 | 38.5%), Educational Services (36 | 30.8%), Manufacturing (19 | 16.2%), and Professional & Scientific (17 | 14.5%).
Employment Industries by Sex in Radnor
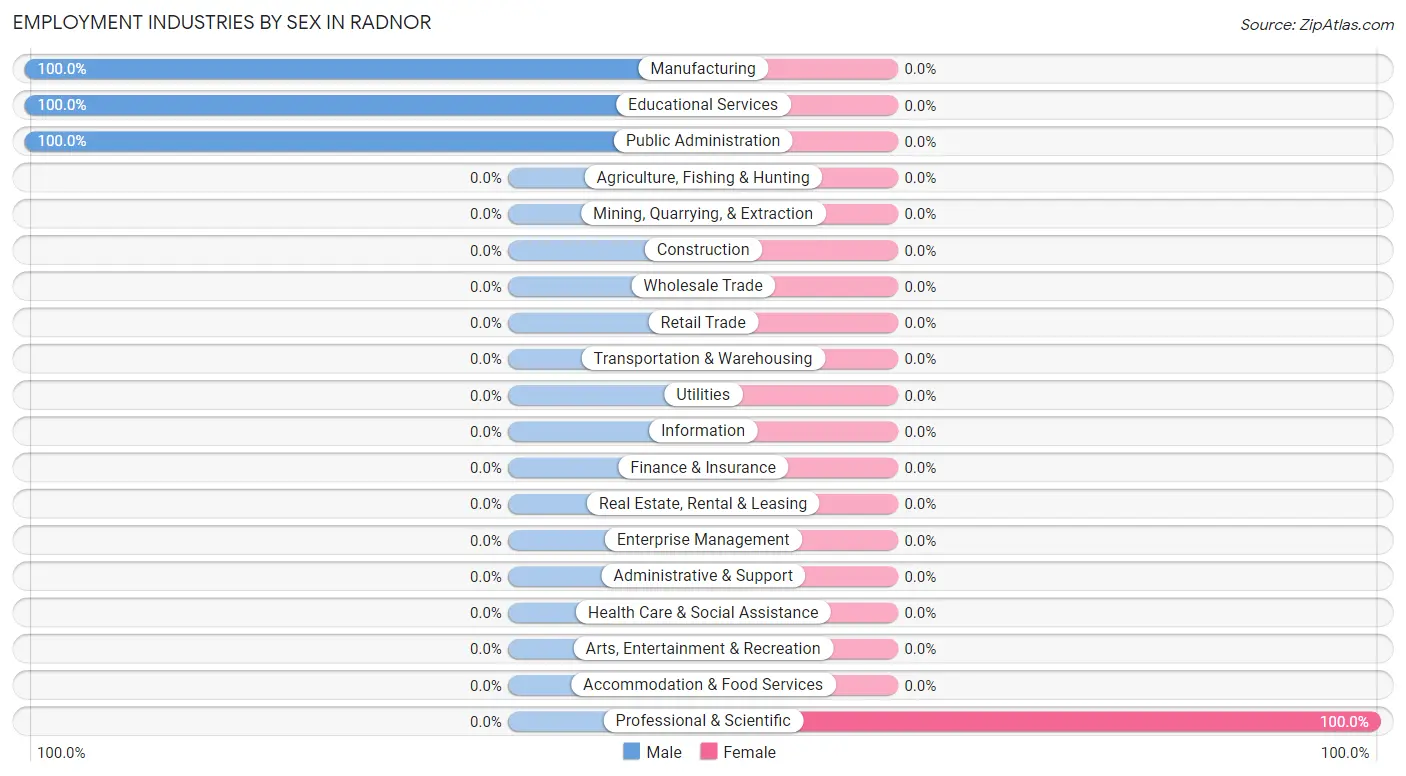
| Industry | Male | Female |
| Agriculture, Fishing & Hunting | 0 (0.0%) | 0 (0.0%) |
| Mining, Quarrying, & Extraction | 0 (0.0%) | 0 (0.0%) |
| Construction | 0 (0.0%) | 0 (0.0%) |
| Manufacturing | 19 (100.0%) | 0 (0.0%) |
| Wholesale Trade | 0 (0.0%) | 0 (0.0%) |
| Retail Trade | 0 (0.0%) | 0 (0.0%) |
| Transportation & Warehousing | 0 (0.0%) | 0 (0.0%) |
| Utilities | 0 (0.0%) | 0 (0.0%) |
| Information | 0 (0.0%) | 0 (0.0%) |
| Finance & Insurance | 0 (0.0%) | 0 (0.0%) |
| Real Estate, Rental & Leasing | 0 (0.0%) | 0 (0.0%) |
| Professional & Scientific | 0 (0.0%) | 17 (100.0%) |
| Enterprise Management | 0 (0.0%) | 0 (0.0%) |
| Administrative & Support | 0 (0.0%) | 0 (0.0%) |
| Educational Services | 36 (100.0%) | 0 (0.0%) |
| Health Care & Social Assistance | 0 (0.0%) | 0 (0.0%) |
| Arts, Entertainment & Recreation | 0 (0.0%) | 0 (0.0%) |
| Accommodation & Food Services | 0 (0.0%) | 0 (0.0%) |
| Public Administration | 45 (100.0%) | 0 (0.0%) |
| Total | 100 (85.5%) | 17 (14.5%) |
Education in Radnor
School Enrollment in Radnor
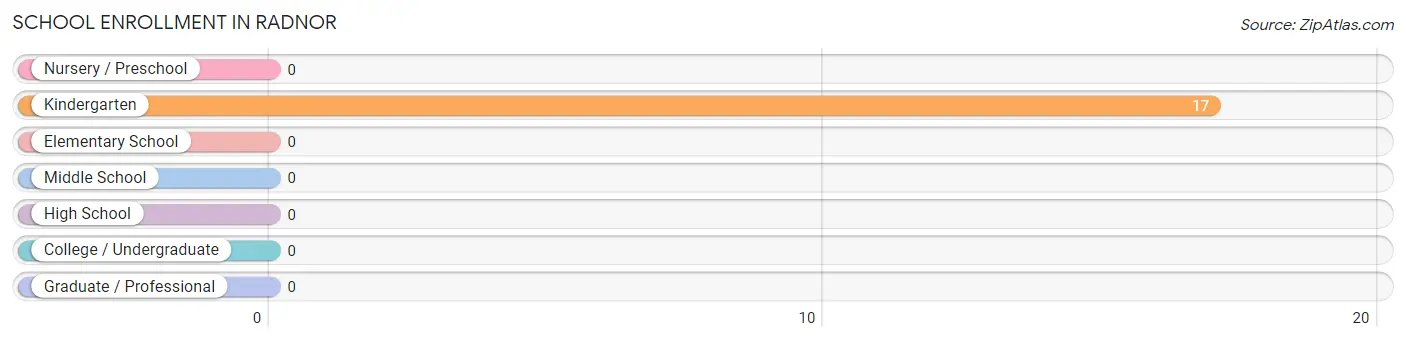
| School Level | # Students | % Students |
| Nursery / Preschool | 0 | 0.0% |
| Kindergarten | 17 | 100.0% |
| Elementary School | 0 | 0.0% |
| Middle School | 0 | 0.0% |
| High School | 0 | 0.0% |
| College / Undergraduate | 0 | 0.0% |
| Graduate / Professional | 0 | 0.0% |
| Total | 17 | 100.0% |
School Enrollment by Age by Funding Source in Radnor
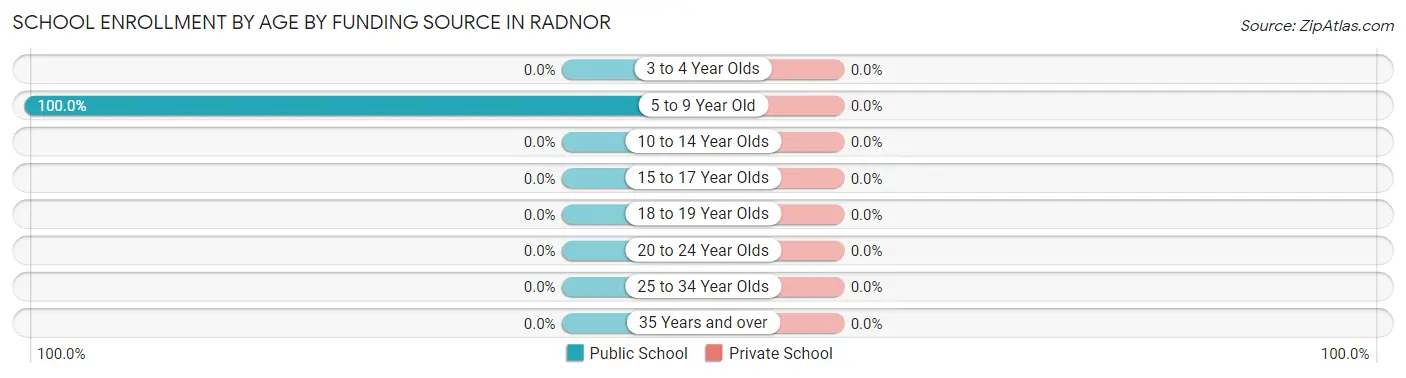
| Age Bracket | Public School | Private School |
| 3 to 4 Year Olds | 0 (0.0%) | 0 (0.0%) |
| 5 to 9 Year Old | 17 (100.0%) | 0 (0.0%) |
| 10 to 14 Year Olds | 0 (0.0%) | 0 (0.0%) |
| 15 to 17 Year Olds | 0 (0.0%) | 0 (0.0%) |
| 18 to 19 Year Olds | 0 (0.0%) | 0 (0.0%) |
| 20 to 24 Year Olds | 0 (0.0%) | 0 (0.0%) |
| 25 to 34 Year Olds | 0 (0.0%) | 0 (0.0%) |
| 35 Years and over | 0 (0.0%) | 0 (0.0%) |
| Total | 17 (100.0%) | 0 (0.0%) |
Educational Attainment by Field of Study in Radnor
Visual & performing arts (19 | 37.2%), bio, nature & agricultural (17 | 33.3%), and literature & languages (15 | 29.4%) are the most common fields of study among 51 individuals in Radnor who have obtained a bachelor's degree or higher.
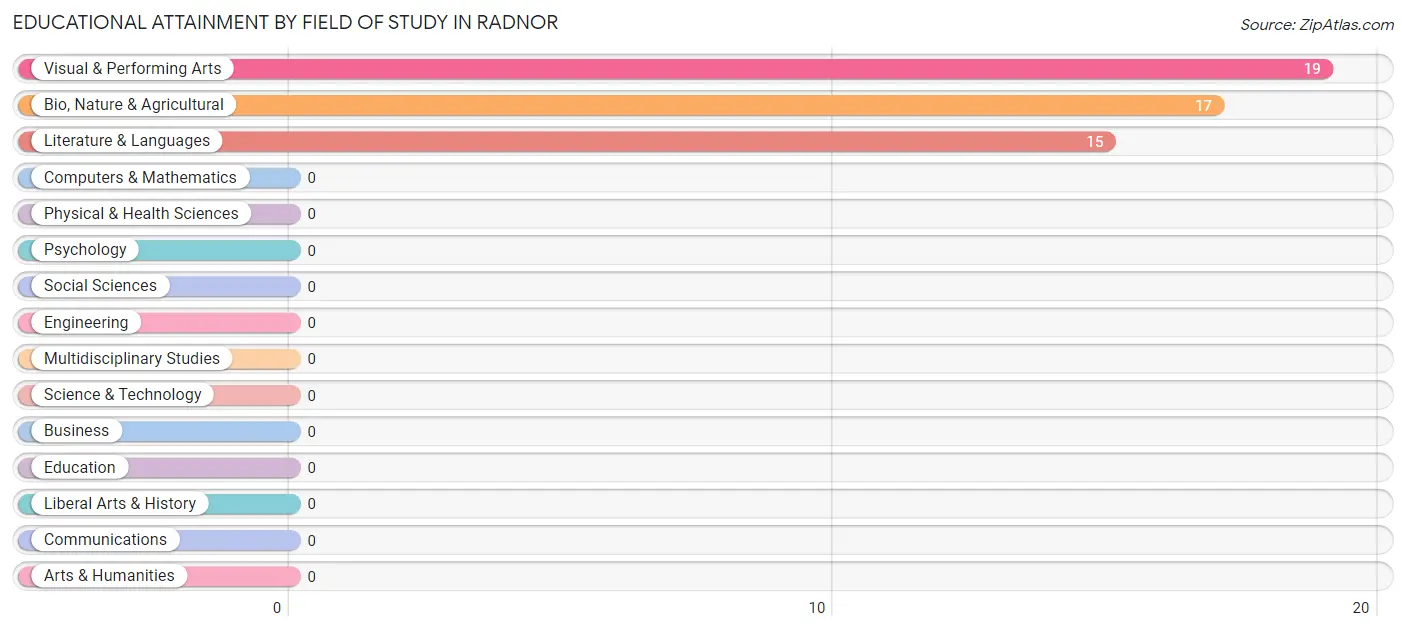
| Field of Study | # Graduates | % Graduates |
| Computers & Mathematics | 0 | 0.0% |
| Bio, Nature & Agricultural | 17 | 33.3% |
| Physical & Health Sciences | 0 | 0.0% |
| Psychology | 0 | 0.0% |
| Social Sciences | 0 | 0.0% |
| Engineering | 0 | 0.0% |
| Multidisciplinary Studies | 0 | 0.0% |
| Science & Technology | 0 | 0.0% |
| Business | 0 | 0.0% |
| Education | 0 | 0.0% |
| Literature & Languages | 15 | 29.4% |
| Liberal Arts & History | 0 | 0.0% |
| Visual & Performing Arts | 19 | 37.2% |
| Communications | 0 | 0.0% |
| Arts & Humanities | 0 | 0.0% |
| Total | 51 | 100.0% |
Transportation & Commute in Radnor
Vehicle Availability by Sex in Radnor
The most prevalent vehicle ownership categories in Radnor are males with 1 vehicle (64, accounting for 64.0%) and females with 1 vehicle (0, making up 376.5%).
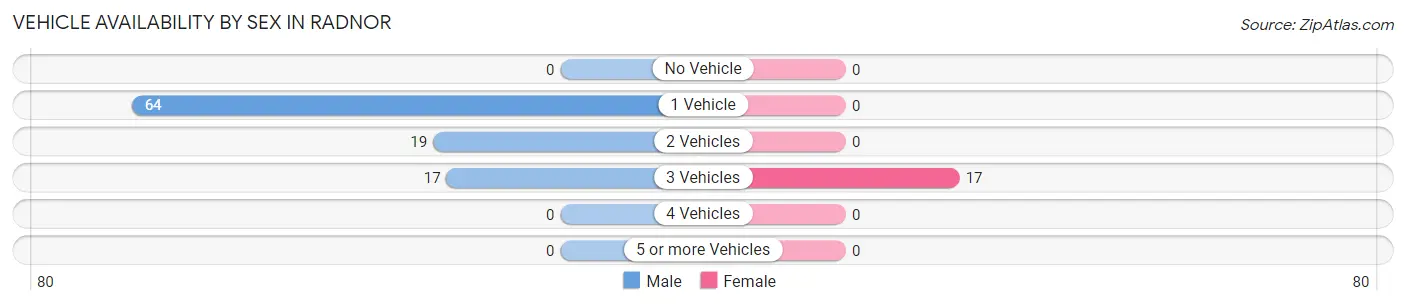
| Vehicles Available | Male | Female |
| No Vehicle | 0 (0.0%) | 0 (0.0%) |
| 1 Vehicle | 64 (64.0%) | 0 (0.0%) |
| 2 Vehicles | 19 (19.0%) | 0 (0.0%) |
| 3 Vehicles | 17 (17.0%) | 17 (100.0%) |
| 4 Vehicles | 0 (0.0%) | 0 (0.0%) |
| 5 or more Vehicles | 0 (0.0%) | 0 (0.0%) |
| Total | 100 (100.0%) | 17 (100.0%) |
Commute Time in Radnor
The most frequently occuring commute durations in Radnor are less than 5 minutes (45 commuters, 38.5%), 45 to 59 minutes (38 commuters, 32.5%), and 30 to 34 minutes (17 commuters, 14.5%).
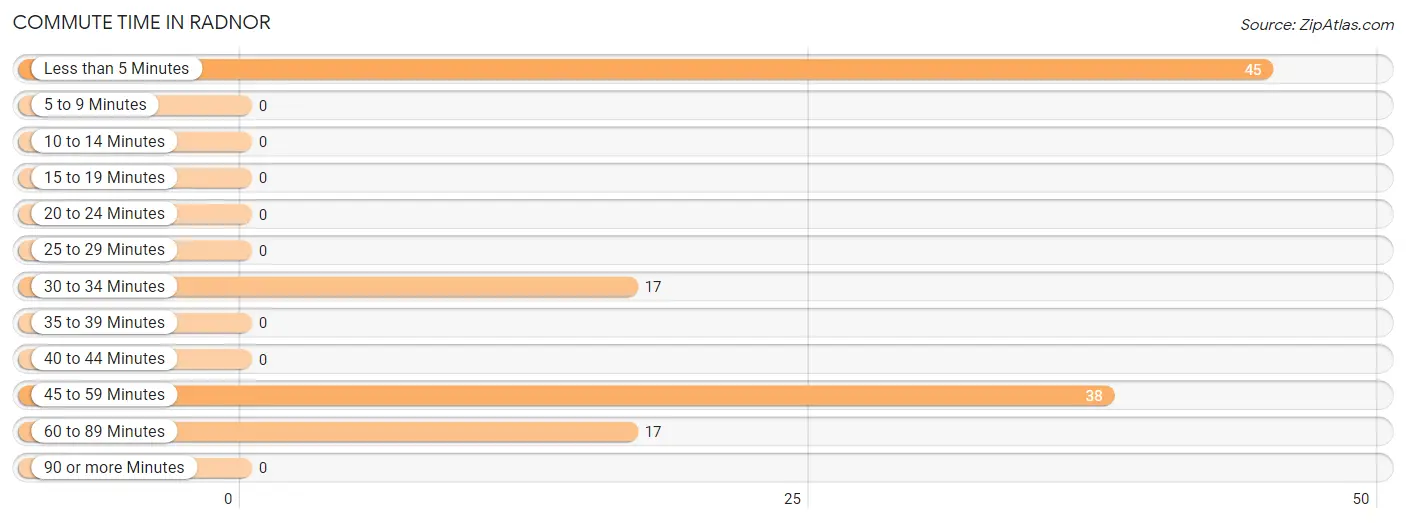
| Commute Time | # Commuters | % Commuters |
| Less than 5 Minutes | 45 | 38.5% |
| 5 to 9 Minutes | 0 | 0.0% |
| 10 to 14 Minutes | 0 | 0.0% |
| 15 to 19 Minutes | 0 | 0.0% |
| 20 to 24 Minutes | 0 | 0.0% |
| 25 to 29 Minutes | 0 | 0.0% |
| 30 to 34 Minutes | 17 | 14.5% |
| 35 to 39 Minutes | 0 | 0.0% |
| 40 to 44 Minutes | 0 | 0.0% |
| 45 to 59 Minutes | 38 | 32.5% |
| 60 to 89 Minutes | 17 | 14.5% |
| 90 or more Minutes | 0 | 0.0% |
Commute Time by Sex in Radnor
The most common commute times in Radnor are less than 5 minutes (45 commuters, 45.0%) for males and 60 to 89 minutes (17 commuters, 100.0%) for females.
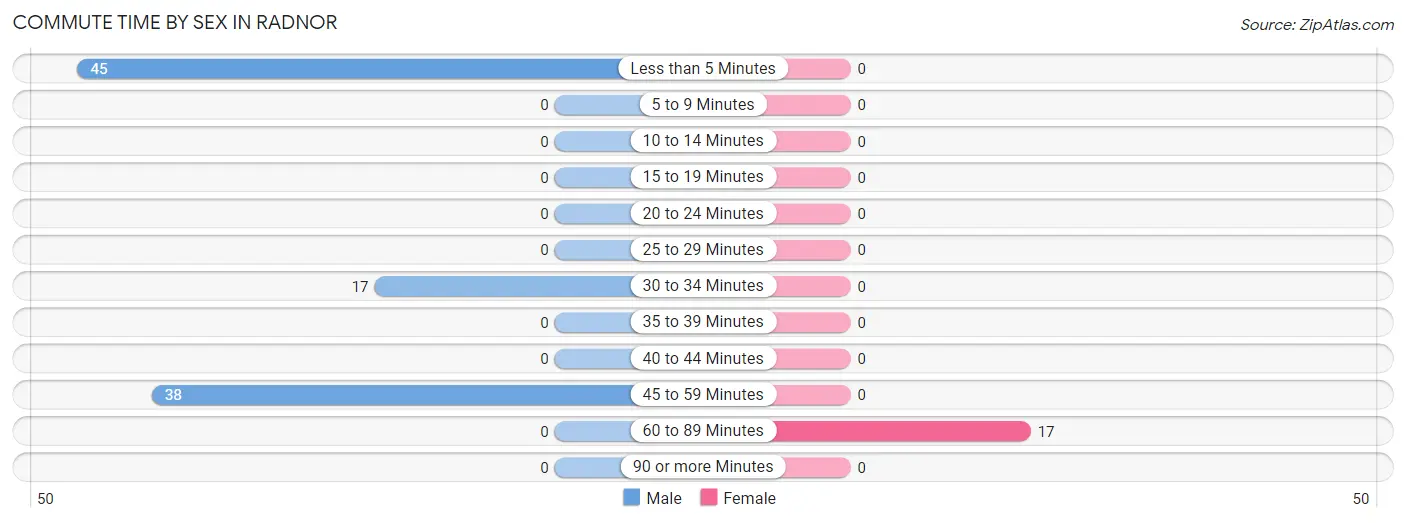
| Commute Time | Male | Female |
| Less than 5 Minutes | 45 (45.0%) | 0 (0.0%) |
| 5 to 9 Minutes | 0 (0.0%) | 0 (0.0%) |
| 10 to 14 Minutes | 0 (0.0%) | 0 (0.0%) |
| 15 to 19 Minutes | 0 (0.0%) | 0 (0.0%) |
| 20 to 24 Minutes | 0 (0.0%) | 0 (0.0%) |
| 25 to 29 Minutes | 0 (0.0%) | 0 (0.0%) |
| 30 to 34 Minutes | 17 (17.0%) | 0 (0.0%) |
| 35 to 39 Minutes | 0 (0.0%) | 0 (0.0%) |
| 40 to 44 Minutes | 0 (0.0%) | 0 (0.0%) |
| 45 to 59 Minutes | 38 (38.0%) | 0 (0.0%) |
| 60 to 89 Minutes | 0 (0.0%) | 17 (100.0%) |
| 90 or more Minutes | 0 (0.0%) | 0 (0.0%) |
Time of Departure to Work by Sex in Radnor
The most frequent times of departure to work in Radnor are 7:00 AM to 7:29 AM (45, 45.0%) for males and 7:00 AM to 7:29 AM (17, 100.0%) for females.
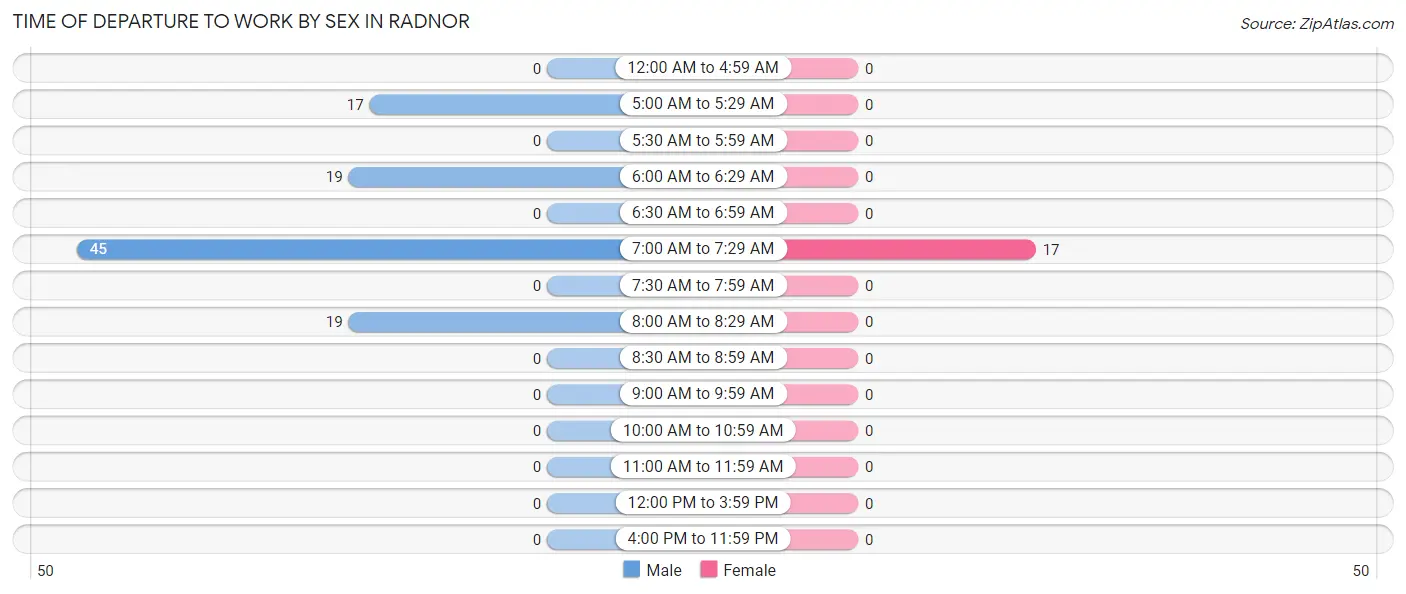
| Time of Departure | Male | Female |
| 12:00 AM to 4:59 AM | 0 (0.0%) | 0 (0.0%) |
| 5:00 AM to 5:29 AM | 17 (17.0%) | 0 (0.0%) |
| 5:30 AM to 5:59 AM | 0 (0.0%) | 0 (0.0%) |
| 6:00 AM to 6:29 AM | 19 (19.0%) | 0 (0.0%) |
| 6:30 AM to 6:59 AM | 0 (0.0%) | 0 (0.0%) |
| 7:00 AM to 7:29 AM | 45 (45.0%) | 17 (100.0%) |
| 7:30 AM to 7:59 AM | 0 (0.0%) | 0 (0.0%) |
| 8:00 AM to 8:29 AM | 19 (19.0%) | 0 (0.0%) |
| 8:30 AM to 8:59 AM | 0 (0.0%) | 0 (0.0%) |
| 9:00 AM to 9:59 AM | 0 (0.0%) | 0 (0.0%) |
| 10:00 AM to 10:59 AM | 0 (0.0%) | 0 (0.0%) |
| 11:00 AM to 11:59 AM | 0 (0.0%) | 0 (0.0%) |
| 12:00 PM to 3:59 PM | 0 (0.0%) | 0 (0.0%) |
| 4:00 PM to 11:59 PM | 0 (0.0%) | 0 (0.0%) |
| Total | 100 (100.0%) | 17 (100.0%) |
Housing Occupancy in Radnor
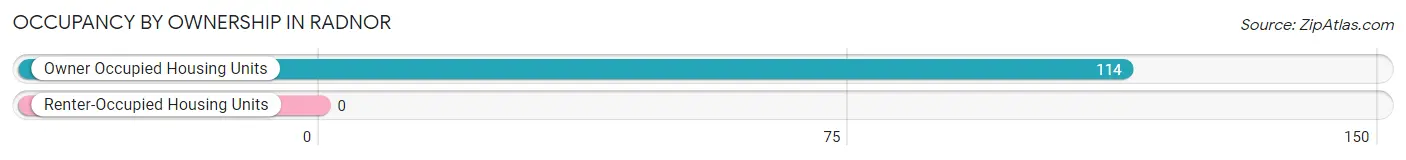
Occupancy by Ownership in Radnor
Of the total 114 dwellings in Radnor, owner-occupied units account for 114 (100.0%), while renter-occupied units make up 0 (0.0%).
| Occupancy | # Housing Units | % Housing Units |
| Owner Occupied Housing Units | 114 | 100.0% |
| Renter-Occupied Housing Units | 0 | 0.0% |
| Total Occupied Housing Units | 114 | 100.0% |
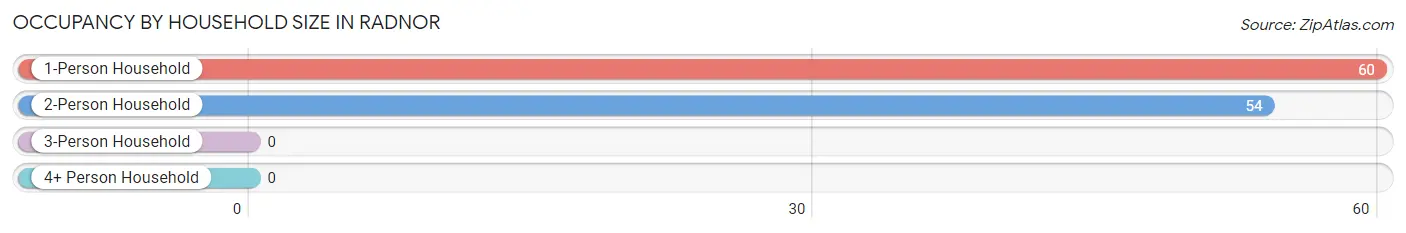
Occupancy by Household Size in Radnor
| Household Size | # Housing Units | % Housing Units |
| 1-Person Household | 60 | 52.6% |
| 2-Person Household | 54 | 47.4% |
| 3-Person Household | 0 | 0.0% |
| 4+ Person Household | 0 | 0.0% |
| Total Housing Units | 114 | 100.0% |
Occupancy by Ownership by Household Size in Radnor
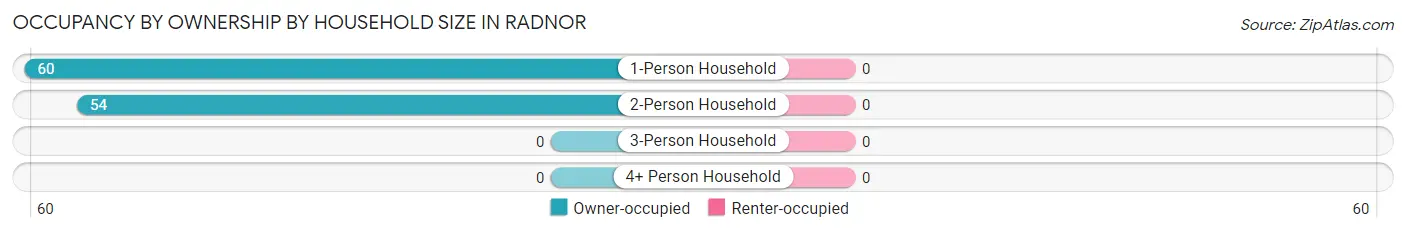
| Household Size | Owner-occupied | Renter-occupied |
| 1-Person Household | 60 (100.0%) | 0 (0.0%) |
| 2-Person Household | 54 (100.0%) | 0 (0.0%) |
| 3-Person Household | 0 (0.0%) | 0 (0.0%) |
| 4+ Person Household | 0 (0.0%) | 0 (0.0%) |
| Total Housing Units | 114 (100.0%) | 0 (0.0%) |
Occupancy by Educational Attainment in Radnor
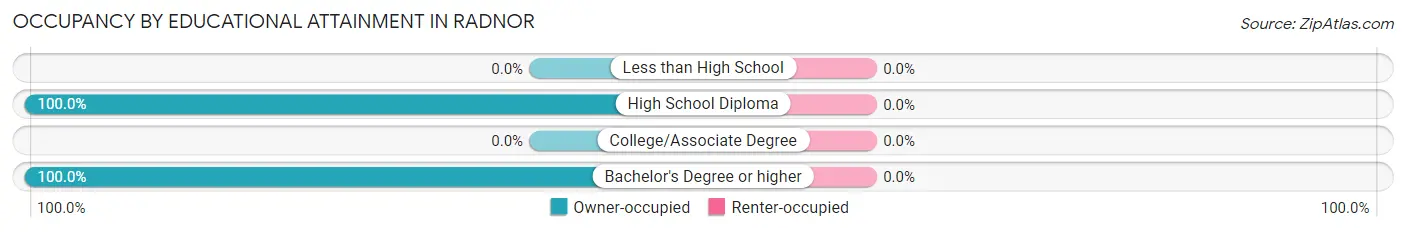
| Household Size | Owner-occupied | Renter-occupied |
| Less than High School | 0 (0.0%) | 0 (0.0%) |
| High School Diploma | 80 (100.0%) | 0 (0.0%) |
| College/Associate Degree | 0 (0.0%) | 0 (0.0%) |
| Bachelor's Degree or higher | 34 (100.0%) | 0 (0.0%) |
Occupancy by Age of Householder in Radnor
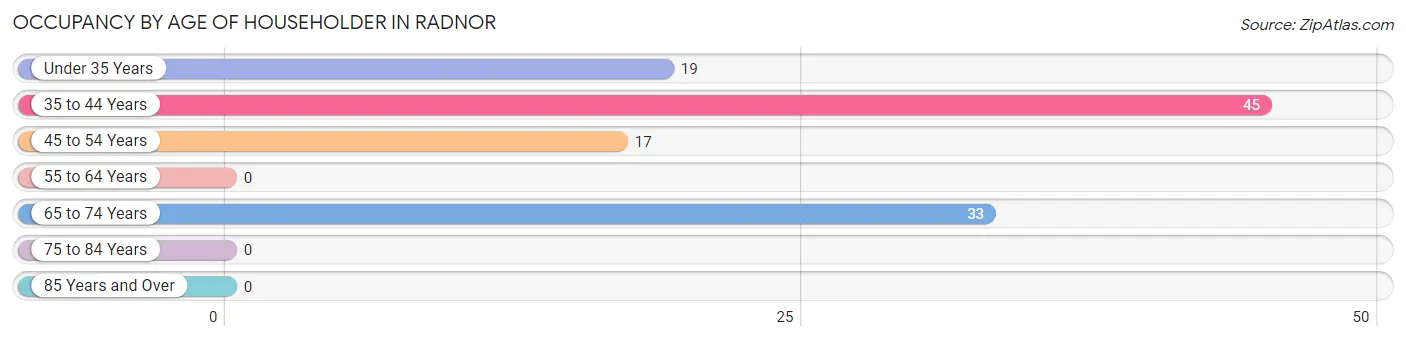
| Age Bracket | # Households | % Households |
| Under 35 Years | 19 | 16.7% |
| 35 to 44 Years | 45 | 39.5% |
| 45 to 54 Years | 17 | 14.9% |
| 55 to 64 Years | 0 | 0.0% |
| 65 to 74 Years | 33 | 28.9% |
| 75 to 84 Years | 0 | 0.0% |
| 85 Years and Over | 0 | 0.0% |
| Total | 114 | 100.0% |
Housing Finances in Radnor
Median Income by Occupancy in Radnor
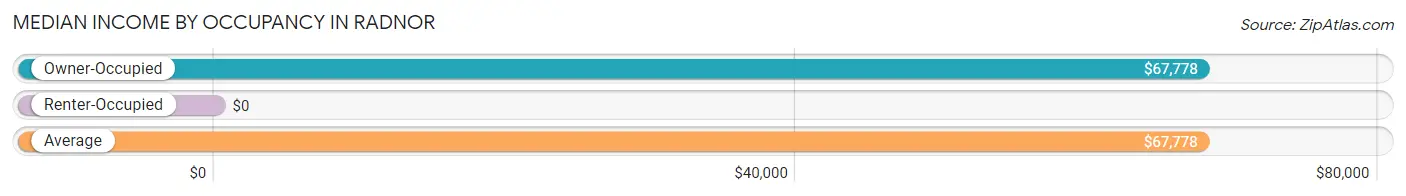
| Occupancy Type | # Households | Median Income |
| Owner-Occupied | 114 (100.0%) | $67,778 |
| Renter-Occupied | 0 (0.0%) | $0 |
| Average | 114 (100.0%) | $67,778 |
Occupancy by Householder Income Bracket in Radnor
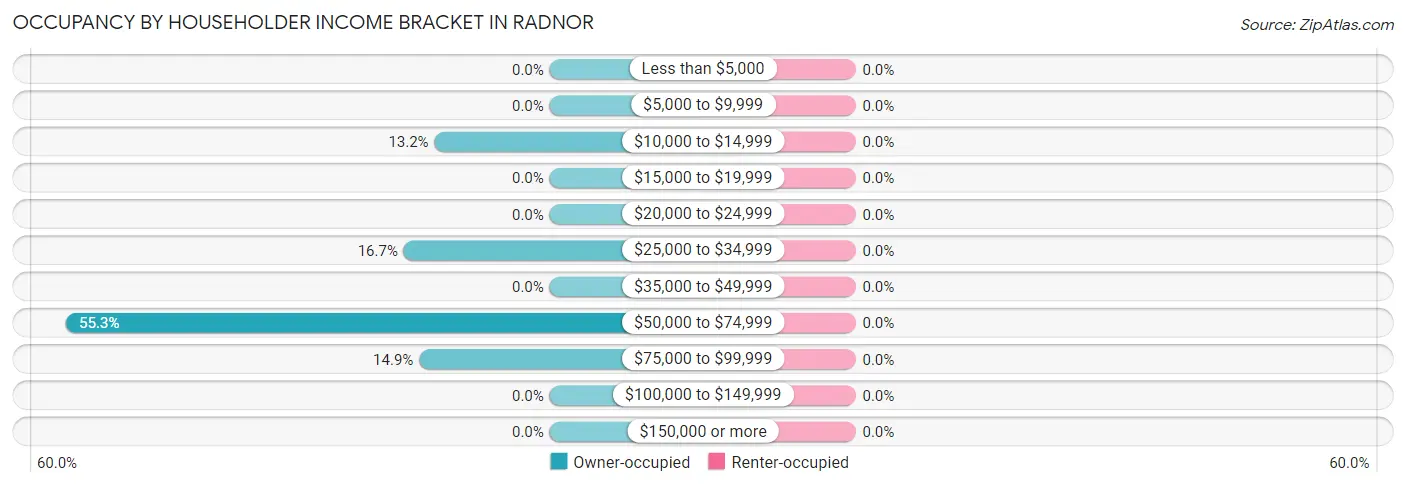
| Income Bracket | Owner-occupied | Renter-occupied |
| Less than $5,000 | 0 (0.0%) | 0 (0.0%) |
| $5,000 to $9,999 | 0 (0.0%) | 0 (0.0%) |
| $10,000 to $14,999 | 15 (13.2%) | 0 (0.0%) |
| $15,000 to $19,999 | 0 (0.0%) | 0 (0.0%) |
| $20,000 to $24,999 | 0 (0.0%) | 0 (0.0%) |
| $25,000 to $34,999 | 19 (16.7%) | 0 (0.0%) |
| $35,000 to $49,999 | 0 (0.0%) | 0 (0.0%) |
| $50,000 to $74,999 | 63 (55.3%) | 0 (0.0%) |
| $75,000 to $99,999 | 17 (14.9%) | 0 (0.0%) |
| $100,000 to $149,999 | 0 (0.0%) | 0 (0.0%) |
| $150,000 or more | 0 (0.0%) | 0 (0.0%) |
| Total | 114 (100.0%) | 0 (0.0%) |
Monthly Housing Cost Tiers in Radnor
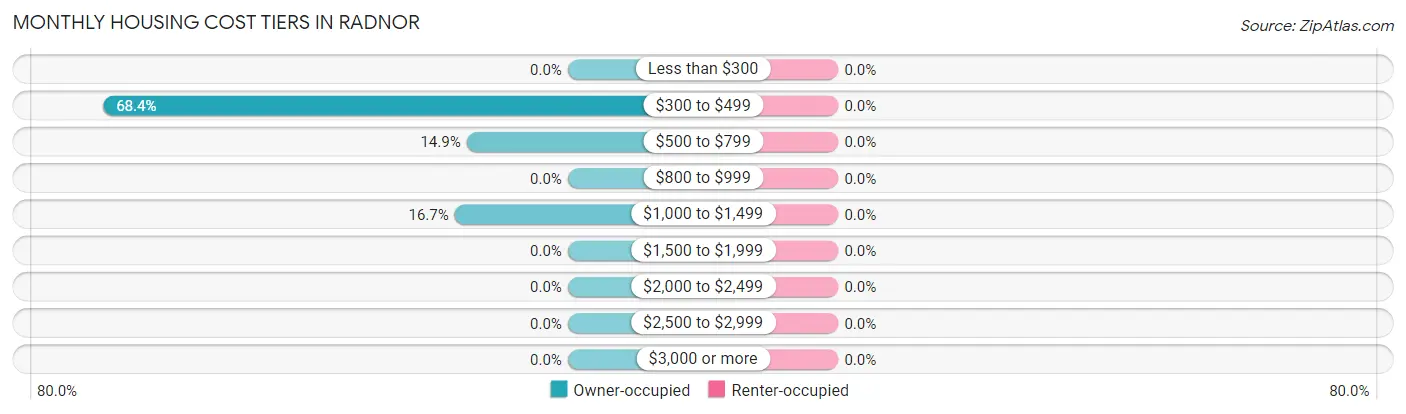
| Monthly Cost | Owner-occupied | Renter-occupied |
| Less than $300 | 0 (0.0%) | 0 (0.0%) |
| $300 to $499 | 78 (68.4%) | 0 (0.0%) |
| $500 to $799 | 17 (14.9%) | 0 (0.0%) |
| $800 to $999 | 0 (0.0%) | 0 (0.0%) |
| $1,000 to $1,499 | 19 (16.7%) | 0 (0.0%) |
| $1,500 to $1,999 | 0 (0.0%) | 0 (0.0%) |
| $2,000 to $2,499 | 0 (0.0%) | 0 (0.0%) |
| $2,500 to $2,999 | 0 (0.0%) | 0 (0.0%) |
| $3,000 or more | 0 (0.0%) | 0 (0.0%) |
| Total | 114 (100.0%) | 0 (0.0%) |
Physical Housing Characteristics in Radnor
Housing Structures in Radnor
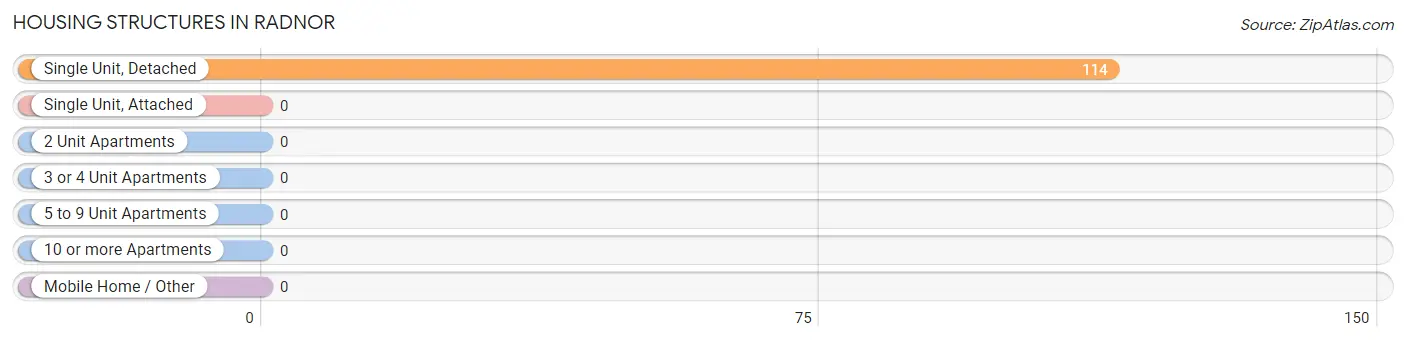
| Structure Type | # Housing Units | % Housing Units |
| Single Unit, Detached | 114 | 100.0% |
| Single Unit, Attached | 0 | 0.0% |
| 2 Unit Apartments | 0 | 0.0% |
| 3 or 4 Unit Apartments | 0 | 0.0% |
| 5 to 9 Unit Apartments | 0 | 0.0% |
| 10 or more Apartments | 0 | 0.0% |
| Mobile Home / Other | 0 | 0.0% |
| Total | 114 | 100.0% |
Housing Structures by Occupancy in Radnor
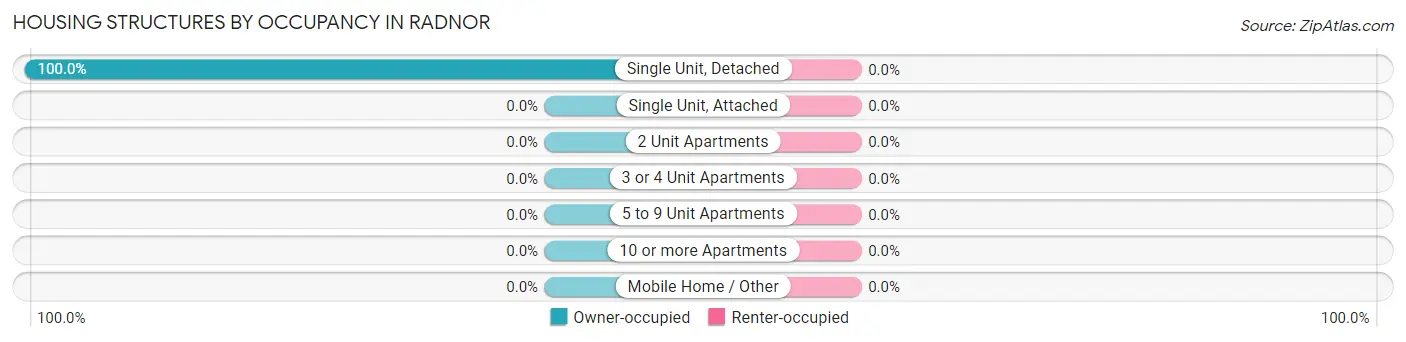
| Structure Type | Owner-occupied | Renter-occupied |
| Single Unit, Detached | 114 (100.0%) | 0 (0.0%) |
| Single Unit, Attached | 0 (0.0%) | 0 (0.0%) |
| 2 Unit Apartments | 0 (0.0%) | 0 (0.0%) |
| 3 or 4 Unit Apartments | 0 (0.0%) | 0 (0.0%) |
| 5 to 9 Unit Apartments | 0 (0.0%) | 0 (0.0%) |
| 10 or more Apartments | 0 (0.0%) | 0 (0.0%) |
| Mobile Home / Other | 0 (0.0%) | 0 (0.0%) |
| Total | 114 (100.0%) | 0 (0.0%) |
Housing Structures by Number of Rooms in Radnor
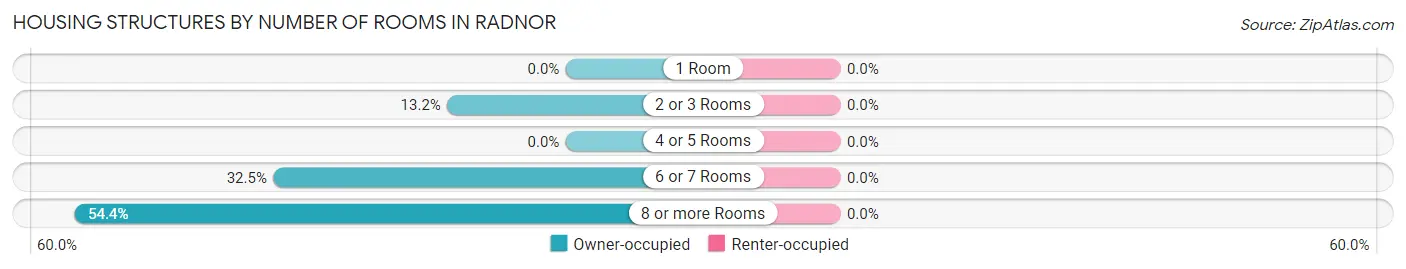
| Number of Rooms | Owner-occupied | Renter-occupied |
| 1 Room | 0 (0.0%) | 0 (0.0%) |
| 2 or 3 Rooms | 15 (13.2%) | 0 (0.0%) |
| 4 or 5 Rooms | 0 (0.0%) | 0 (0.0%) |
| 6 or 7 Rooms | 37 (32.5%) | 0 (0.0%) |
| 8 or more Rooms | 62 (54.4%) | 0 (0.0%) |
| Total | 114 (100.0%) | 0 (0.0%) |
Housing Structure by Heating Type in Radnor
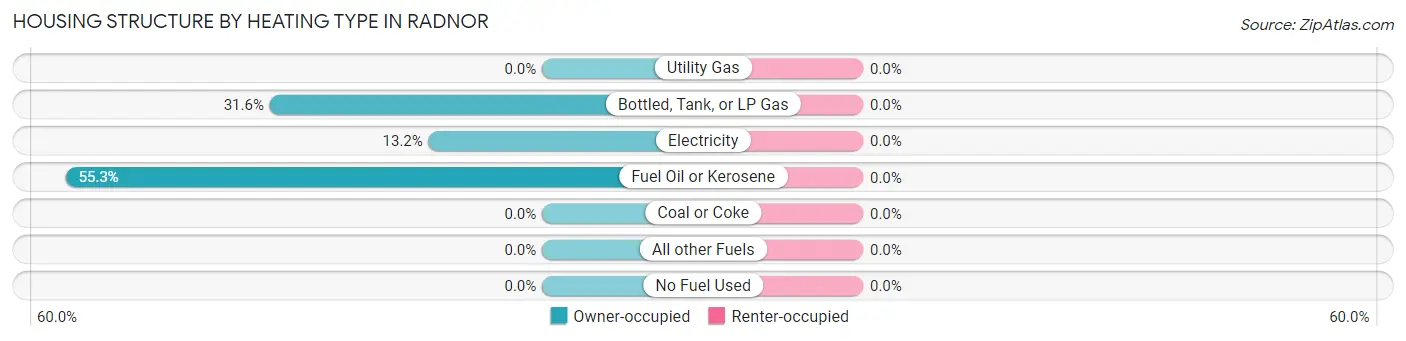
| Heating Type | Owner-occupied | Renter-occupied |
| Utility Gas | 0 (0.0%) | 0 (0.0%) |
| Bottled, Tank, or LP Gas | 36 (31.6%) | 0 (0.0%) |
| Electricity | 15 (13.2%) | 0 (0.0%) |
| Fuel Oil or Kerosene | 63 (55.3%) | 0 (0.0%) |
| Coal or Coke | 0 (0.0%) | 0 (0.0%) |
| All other Fuels | 0 (0.0%) | 0 (0.0%) |
| No Fuel Used | 0 (0.0%) | 0 (0.0%) |
| Total | 114 (100.0%) | 0 (0.0%) |
Household Vehicle Usage in Radnor
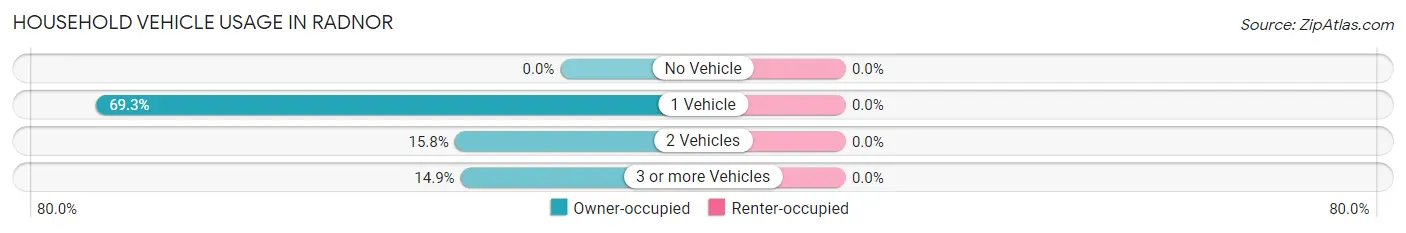
| Vehicles per Household | Owner-occupied | Renter-occupied |
| No Vehicle | 0 (0.0%) | 0 (0.0%) |
| 1 Vehicle | 79 (69.3%) | 0 (0.0%) |
| 2 Vehicles | 18 (15.8%) | 0 (0.0%) |
| 3 or more Vehicles | 17 (14.9%) | 0 (0.0%) |
| Total | 114 (100.0%) | 0 (0.0%) |
Real Estate & Mortgages in Radnor
Real Estate and Mortgage Overview in Radnor
| Characteristic | Without Mortgage | With Mortgage |
| Housing Units | 95 | 19 |
| Median Property Value | $196,300 | $0 |
| Median Household Income | $68,306 | $0 |
| Monthly Housing Costs | $432 | $0 |
| Real Estate Taxes | - | - |
Property Value by Mortgage Status in Radnor
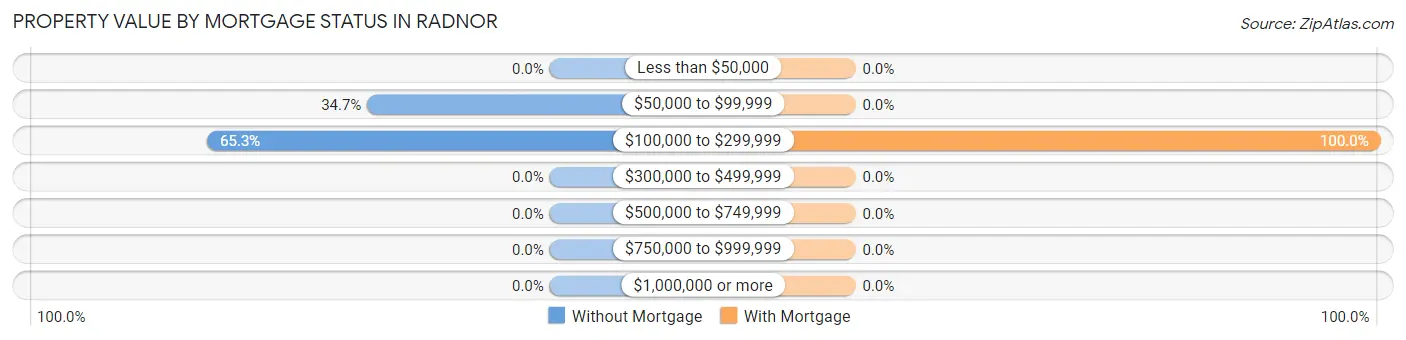
| Property Value | Without Mortgage | With Mortgage |
| Less than $50,000 | 0 (0.0%) | 0 (0.0%) |
| $50,000 to $99,999 | 33 (34.7%) | 0 (0.0%) |
| $100,000 to $299,999 | 62 (65.3%) | 19 (100.0%) |
| $300,000 to $499,999 | 0 (0.0%) | 0 (0.0%) |
| $500,000 to $749,999 | 0 (0.0%) | 0 (0.0%) |
| $750,000 to $999,999 | 0 (0.0%) | 0 (0.0%) |
| $1,000,000 or more | 0 (0.0%) | 0 (0.0%) |
| Total | 95 (100.0%) | 19 (100.0%) |
Household Income by Mortgage Status in Radnor
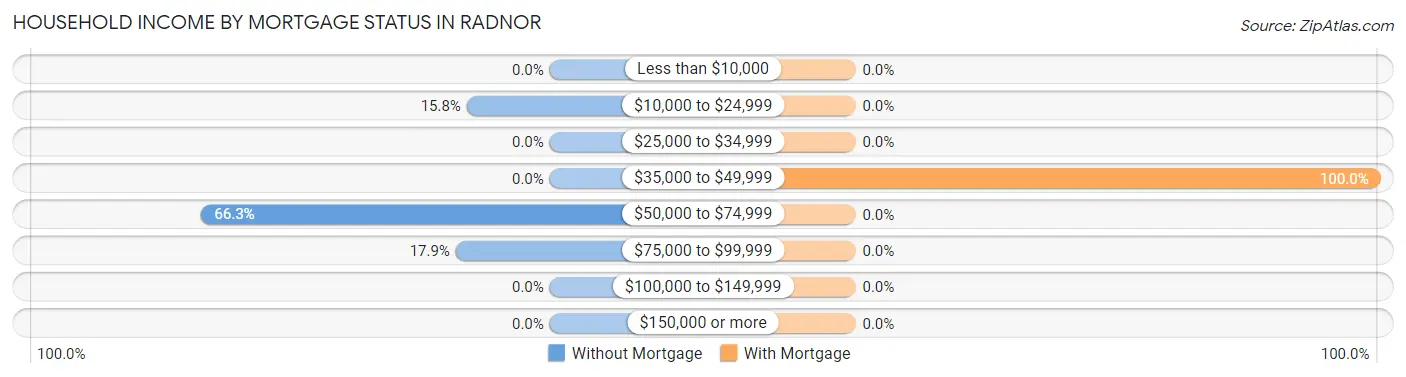
| Household Income | Without Mortgage | With Mortgage |
| Less than $10,000 | 0 (0.0%) | 0 (0.0%) |
| $10,000 to $24,999 | 15 (15.8%) | 0 (0.0%) |
| $25,000 to $34,999 | 0 (0.0%) | 0 (0.0%) |
| $35,000 to $49,999 | 0 (0.0%) | 19 (100.0%) |
| $50,000 to $74,999 | 63 (66.3%) | 0 (0.0%) |
| $75,000 to $99,999 | 17 (17.9%) | 0 (0.0%) |
| $100,000 to $149,999 | 0 (0.0%) | 0 (0.0%) |
| $150,000 or more | 0 (0.0%) | 0 (0.0%) |
| Total | 95 (100.0%) | 19 (100.0%) |
Property Value to Household Income Ratio in Radnor
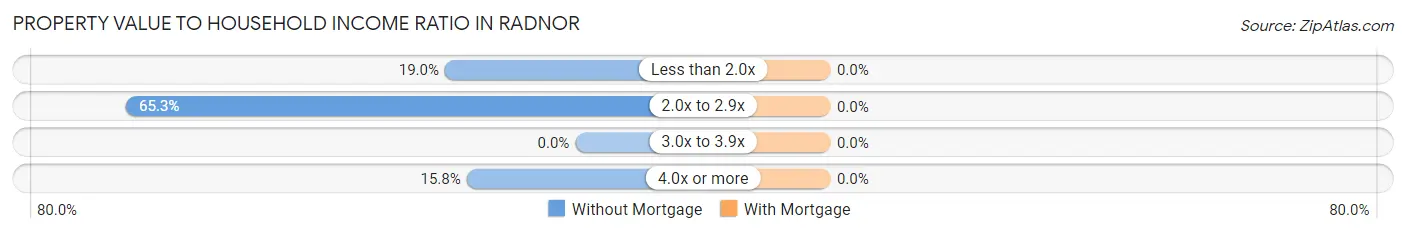
| Value-to-Income Ratio | Without Mortgage | With Mortgage |
| Less than 2.0x | 18 (19.0%) | 0 (0.0%) |
| 2.0x to 2.9x | 62 (65.3%) | 0 (0.0%) |
| 3.0x to 3.9x | 0 (0.0%) | 0 (0.0%) |
| 4.0x or more | 15 (15.8%) | 0 (0.0%) |
| Total | 95 (100.0%) | 19 (100.0%) |
Real Estate Taxes by Mortgage Status in Radnor
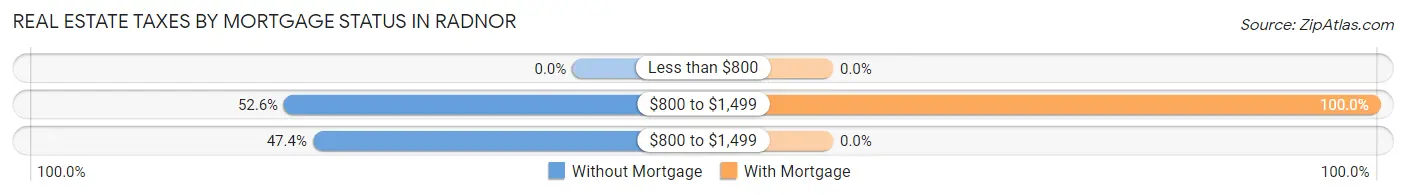
| Property Taxes | Without Mortgage | With Mortgage |
| Less than $800 | 0 (0.0%) | 0 (0.0%) |
| $800 to $1,499 | 50 (52.6%) | 19 (100.0%) |
| $800 to $1,499 | 45 (47.4%) | 0 (0.0%) |
| Total | 95 (100.0%) | 19 (100.0%) |
Health & Disability in Radnor
Health Insurance Coverage by Age in Radnor
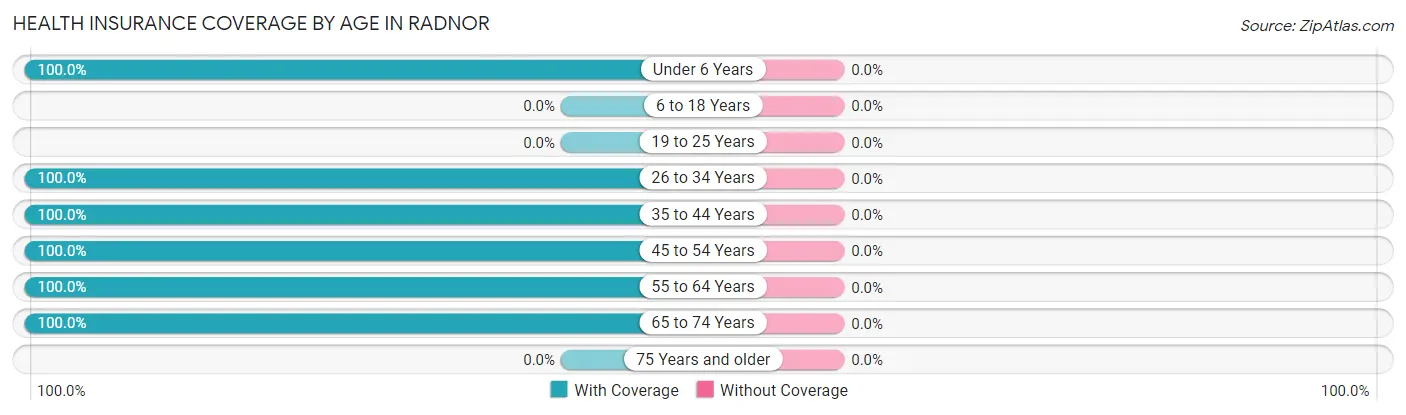
| Age Bracket | With Coverage | Without Coverage |
| Under 6 Years | 17 (100.0%) | 0 (0.0%) |
| 6 to 18 Years | 0 (0.0%) | 0 (0.0%) |
| 19 to 25 Years | 0 (0.0%) | 0 (0.0%) |
| 26 to 34 Years | 19 (100.0%) | 0 (0.0%) |
| 35 to 44 Years | 45 (100.0%) | 0 (0.0%) |
| 45 to 54 Years | 17 (100.0%) | 0 (0.0%) |
| 55 to 64 Years | 17 (100.0%) | 0 (0.0%) |
| 65 to 74 Years | 52 (100.0%) | 0 (0.0%) |
| 75 Years and older | 0 (0.0%) | 0 (0.0%) |
| Total | 167 (100.0%) | 0 (0.0%) |
Health Insurance Coverage by Citizenship Status in Radnor
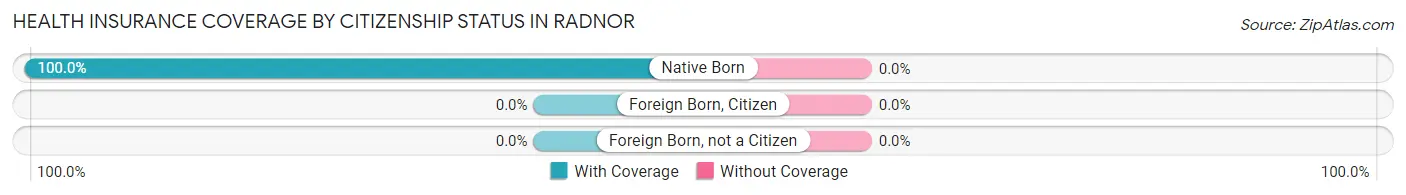
| Citizenship Status | With Coverage | Without Coverage |
| Native Born | 17 (100.0%) | 0 (0.0%) |
| Foreign Born, Citizen | 0 (0.0%) | 0 (0.0%) |
| Foreign Born, not a Citizen | 0 (0.0%) | 0 (0.0%) |
Health Insurance Coverage by Household Income in Radnor
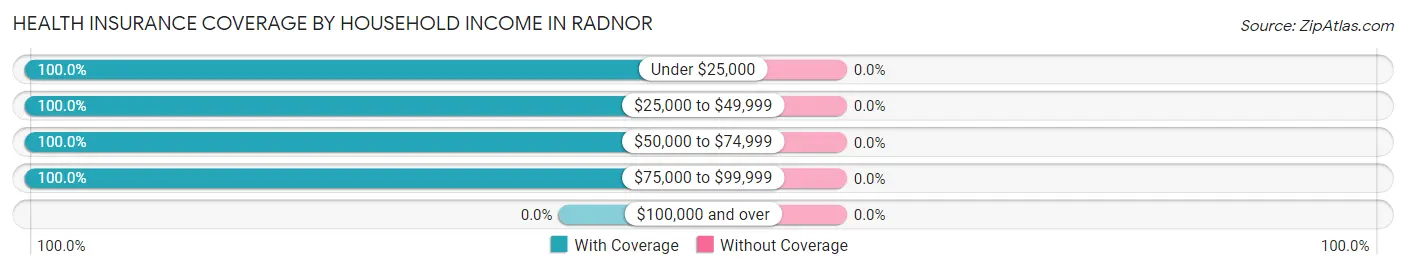
| Household Income | With Coverage | Without Coverage |
| Under $25,000 | 15 (100.0%) | 0 (0.0%) |
| $25,000 to $49,999 | 36 (100.0%) | 0 (0.0%) |
| $50,000 to $74,999 | 82 (100.0%) | 0 (0.0%) |
| $75,000 to $99,999 | 34 (100.0%) | 0 (0.0%) |
| $100,000 and over | 0 (0.0%) | 0 (0.0%) |
Public vs Private Health Insurance Coverage by Age in Radnor
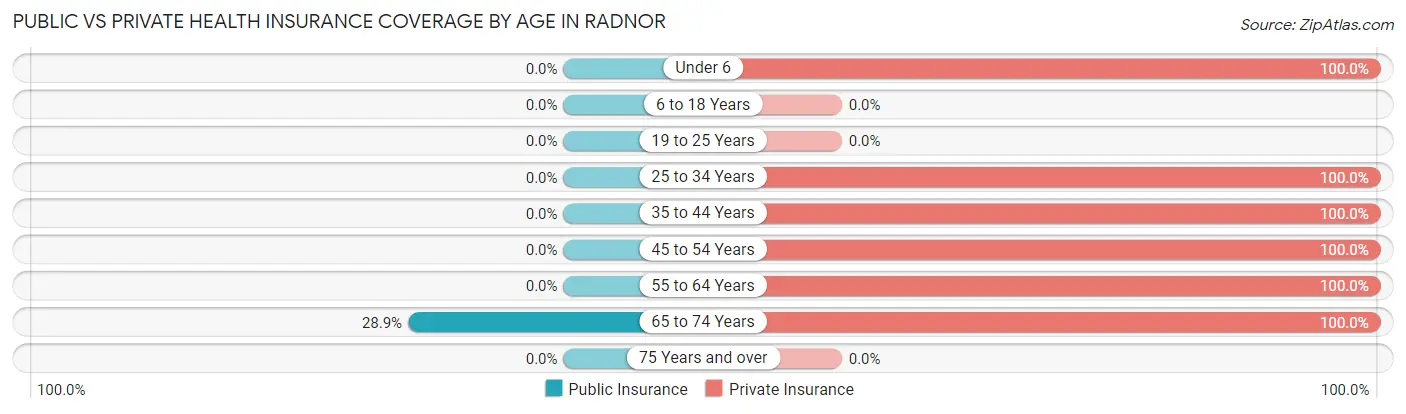
| Age Bracket | Public Insurance | Private Insurance |
| Under 6 | 0 (0.0%) | 17 (100.0%) |
| 6 to 18 Years | 0 (0.0%) | 0 (0.0%) |
| 19 to 25 Years | 0 (0.0%) | 0 (0.0%) |
| 25 to 34 Years | 0 (0.0%) | 19 (100.0%) |
| 35 to 44 Years | 0 (0.0%) | 45 (100.0%) |
| 45 to 54 Years | 0 (0.0%) | 17 (100.0%) |
| 55 to 64 Years | 0 (0.0%) | 17 (100.0%) |
| 65 to 74 Years | 15 (28.8%) | 52 (100.0%) |
| 75 Years and over | 0 (0.0%) | 0 (0.0%) |
| Total | 15 (9.0%) | 167 (100.0%) |
Disability Status by Sex by Age in Radnor
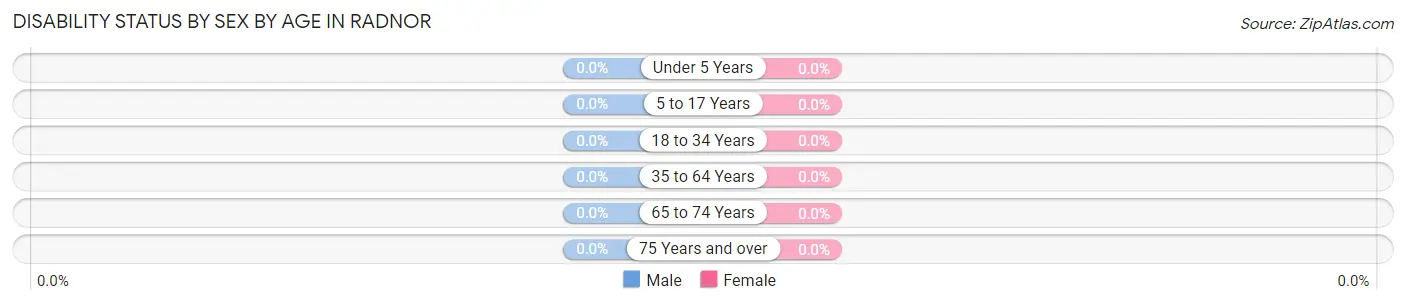
| Age Bracket | Male | Female |
| Under 5 Years | 0 (0.0%) | 0 (0.0%) |
| 5 to 17 Years | 0 (0.0%) | 0 (0.0%) |
| 18 to 34 Years | 0 (0.0%) | 0 (0.0%) |
| 35 to 64 Years | 0 (0.0%) | 0 (0.0%) |
| 65 to 74 Years | 0 (0.0%) | 0 (0.0%) |
| 75 Years and over | 0 (0.0%) | 0 (0.0%) |
Disability Class by Sex by Age in Radnor
Disability Class: Hearing Difficulty
| Age Bracket | Male | Female |
| Under 5 Years | 0 (0.0%) | 0 (0.0%) |
| 5 to 17 Years | 0 (0.0%) | 0 (0.0%) |
| 18 to 34 Years | 0 (0.0%) | 0 (0.0%) |
| 35 to 64 Years | 0 (0.0%) | 0 (0.0%) |
| 65 to 74 Years | 0 (0.0%) | 0 (0.0%) |
| 75 Years and over | 0 (0.0%) | 0 (0.0%) |
Disability Class: Vision Difficulty
| Age Bracket | Male | Female |
| Under 5 Years | 0 (0.0%) | 0 (0.0%) |
| 5 to 17 Years | 0 (0.0%) | 0 (0.0%) |
| 18 to 34 Years | 0 (0.0%) | 0 (0.0%) |
| 35 to 64 Years | 0 (0.0%) | 0 (0.0%) |
| 65 to 74 Years | 0 (0.0%) | 0 (0.0%) |
| 75 Years and over | 0 (0.0%) | 0 (0.0%) |
Disability Class: Cognitive Difficulty

| Age Bracket | Male | Female |
| 5 to 17 Years | 0 (0.0%) | 0 (0.0%) |
| 18 to 34 Years | 0 (0.0%) | 0 (0.0%) |
| 35 to 64 Years | 0 (0.0%) | 0 (0.0%) |
| 65 to 74 Years | 0 (0.0%) | 0 (0.0%) |
| 75 Years and over | 0 (0.0%) | 0 (0.0%) |
Disability Class: Ambulatory Difficulty
| Age Bracket | Male | Female |
| 5 to 17 Years | 0 (0.0%) | 0 (0.0%) |
| 18 to 34 Years | 0 (0.0%) | 0 (0.0%) |
| 35 to 64 Years | 0 (0.0%) | 0 (0.0%) |
| 65 to 74 Years | 0 (0.0%) | 0 (0.0%) |
| 75 Years and over | 0 (0.0%) | 0 (0.0%) |
Disability Class: Self-Care Difficulty
| Age Bracket | Male | Female |
| 5 to 17 Years | 0 (0.0%) | 0 (0.0%) |
| 18 to 34 Years | 0 (0.0%) | 0 (0.0%) |
| 35 to 64 Years | 0 (0.0%) | 0 (0.0%) |
| 65 to 74 Years | 0 (0.0%) | 0 (0.0%) |
| 75 Years and over | 0 (0.0%) | 0 (0.0%) |
Technology Access in Radnor
Computing Device Access in Radnor
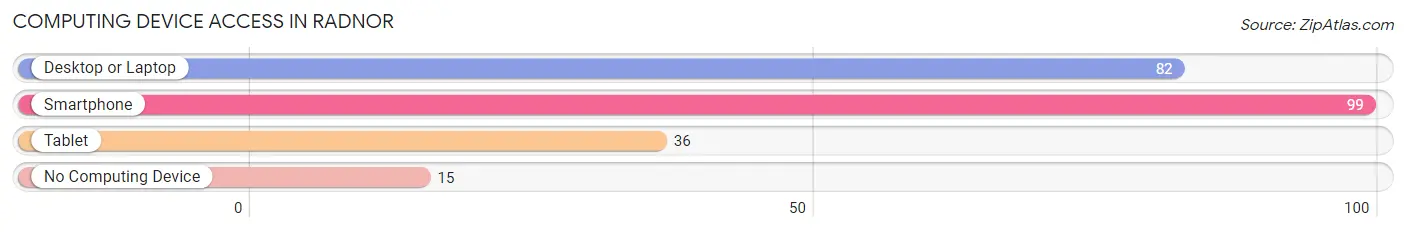
| Device Type | # Households | % Households |
| Desktop or Laptop | 82 | 71.9% |
| Smartphone | 99 | 86.8% |
| Tablet | 36 | 31.6% |
| No Computing Device | 15 | 13.2% |
| Total | 114 | 100.0% |
Internet Access in Radnor
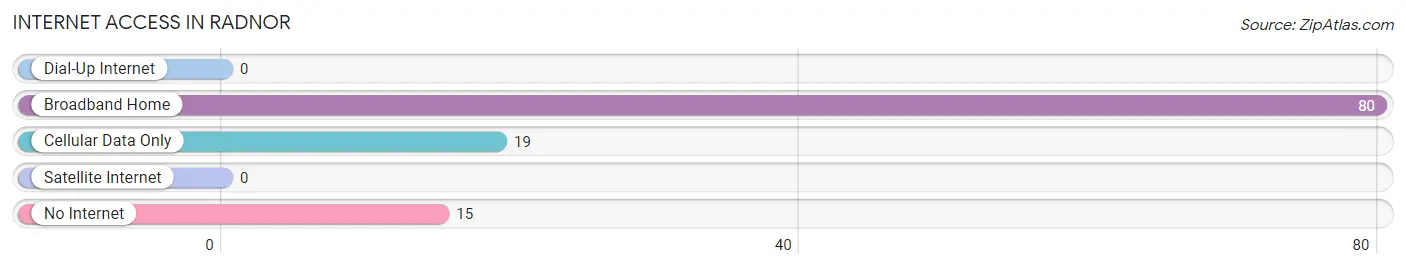
| Internet Type | # Households | % Households |
| Dial-Up Internet | 0 | 0.0% |
| Broadband Home | 80 | 70.2% |
| Cellular Data Only | 19 | 16.7% |
| Satellite Internet | 0 | 0.0% |
| No Internet | 15 | 13.2% |
| Total | 114 | 100.0% |
Radnor Summary
Radnor, Ohio is a small village located in Delaware County, Ohio. It is situated on the banks of the Olentangy River, approximately 20 miles north of Columbus. The village has a population of approximately 1,000 people and is part of the Columbus metropolitan area.
History
Radnor was founded in 1817 by a group of settlers from Pennsylvania. The village was named after Radnor Township in Pennsylvania, which was the home of many of the settlers. The village was originally a farming community, but it soon developed into a small industrial center. The first industry in the village was a sawmill, which was built in 1820. The sawmill was followed by a gristmill, a tannery, and a woolen mill.
In the late 19th century, Radnor became a popular tourist destination. The village was known for its scenic beauty and its proximity to the Olentangy River. The village was also home to several resorts, including the Radnor Hotel, which was built in 1891.
Geography
Radnor is located in the northern part of Delaware County, Ohio. It is situated on the banks of the Olentangy River, approximately 20 miles north of Columbus. The village is surrounded by rolling hills and farmland. The terrain is mostly flat, with some areas of higher elevation.
The climate in Radnor is humid continental, with hot summers and cold winters. The average annual temperature is around 50 degrees Fahrenheit. The average annual precipitation is around 40 inches.
Economy
The economy of Radnor is largely based on agriculture and tourism. The village is home to several farms, which produce a variety of crops, including corn, soybeans, and wheat. The village is also home to several wineries, which produce a variety of wines.
Tourism is an important part of the economy of Radnor. The village is home to several resorts, including the Radnor Hotel, which was built in 1891. The village is also home to several parks, including the Olentangy River State Park, which offers camping, fishing, and hiking.
Demographics
As of the 2010 census, the population of Radnor was 1,000 people. The racial makeup of the village was 97.2% White, 0.7% African American, 0.3% Native American, 0.3% Asian, and 1.5% from other races. The median household income was $45,000, and the median family income was $50,000. The per capita income was $20,000.
Radnor is a small village with a close-knit community. The village is home to several churches, including the Radnor United Methodist Church, which was founded in 1820. The village also has a public library, which was established in 1891.
Common Questions
What is Per Capita Income in Radnor?
Per Capita income in Radnor is $38,967.
What is the Median Family Income in Radnor?
Median Family Income in Radnor is $56,111.
What is the Median Household income in Radnor?
Median Household Income in Radnor is $67,778.
What is Inequality or Gini Index in Radnor?
Inequality or Gini Index in Radnor is 0.23.
What is the Total Population of Radnor?
Total Population of Radnor is 167.
What is the Total Male Population of Radnor?
Total Male Population of Radnor is 100.
What is the Total Female Population of Radnor?
Total Female Population of Radnor is 67.
What is the Ratio of Males per 100 Females in Radnor?
There are 149.25 Males per 100 Females in Radnor.
What is the Ratio of Females per 100 Males in Radnor?
There are 67.00 Females per 100 Males in Radnor.
What is the Median Population Age in Radnor?
Median Population Age in Radnor is 53.1 Years.
What is the Average Family Size in Radnor
Average Family Size in Radnor is 2.0 People.
What is the Average Household Size in Radnor
Average Household Size in Radnor is 1.5 People.
How Large is the Labor Force in Radnor?
There are 117 People in the Labor Forcein in Radnor.
What is the Percentage of People in the Labor Force in Radnor?
78.0% of People are in the Labor Force in Radnor.