Cities with the Largest Hawaiian / Pacific Community in New York
RELATED REPORTS & OPTIONS
Hawaiian / Pacific
New York
Compare Cities
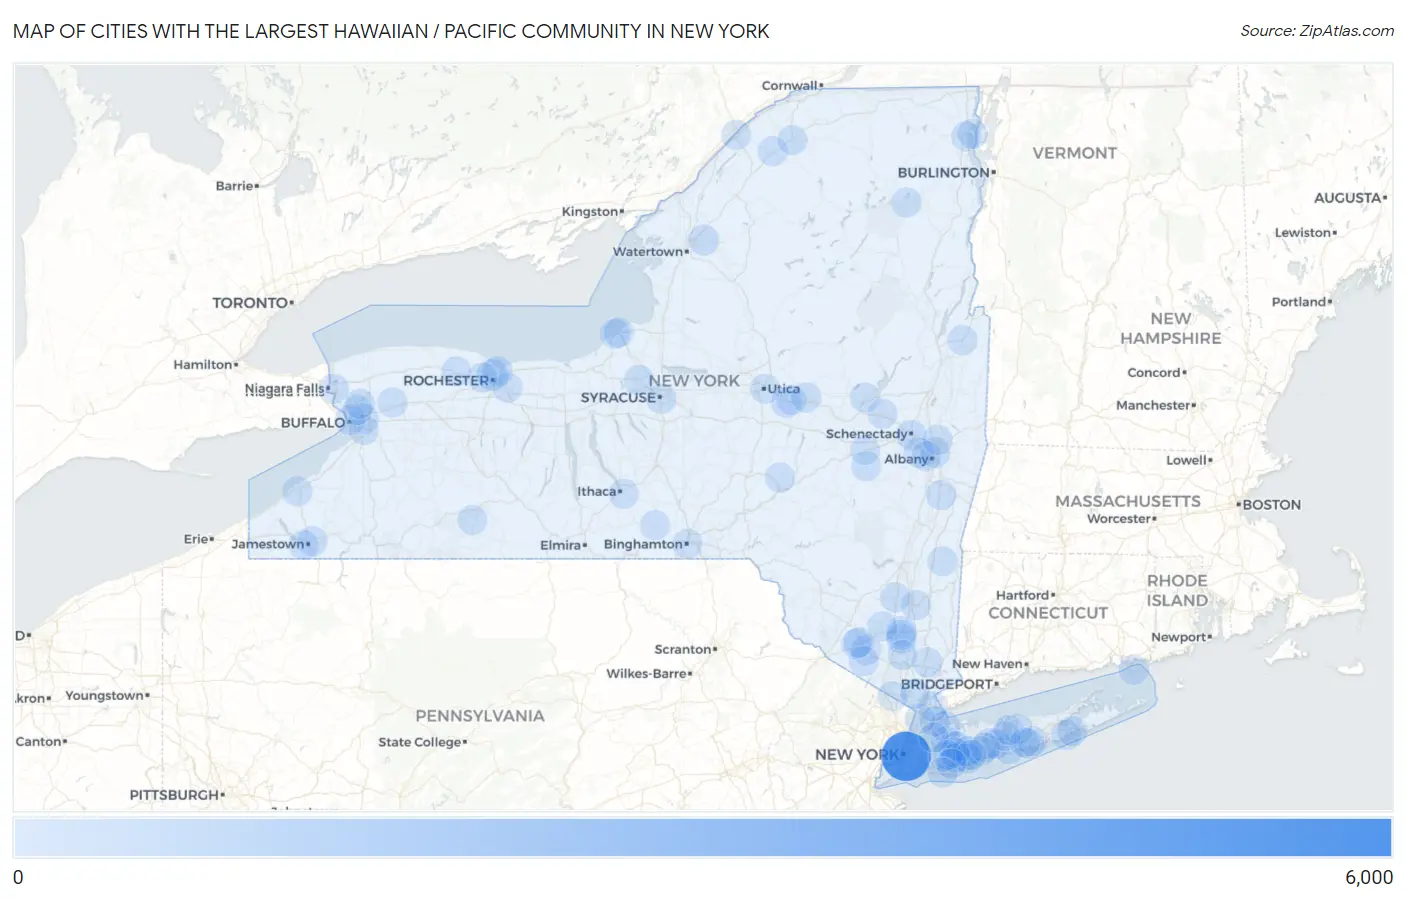
Map of Cities with the Largest Hawaiian / Pacific Community in New York
0
6,000
Cities with the Largest Hawaiian / Pacific Community in New York
| City | Hawaiian / Pacific | vs State | vs National | |
| 1. | New York | 5,431 | 9,120(59.55%)#1 | 624,863(0.87%)#11 |
| 2. | Rochester | 349 | 9,120(3.83%)#2 | 624,863(0.06%)#306 |
| 3. | Fort Drum | 183 | 9,120(2.01%)#3 | 624,863(0.03%)#531 |
| 4. | Goshen | 99 | 9,120(1.09%)#4 | 624,863(0.02%)#842 |
| 5. | Schenectady | 85 | 9,120(0.93%)#5 | 624,863(0.01%)#932 |
| 6. | Brentwood | 83 | 9,120(0.91%)#6 | 624,863(0.01%)#951 |
| 7. | New Cassel | 76 | 9,120(0.83%)#7 | 624,863(0.01%)#998 |
| 8. | West Hempstead | 71 | 9,120(0.78%)#8 | 624,863(0.01%)#1,040 |
| 9. | Glen Cove | 66 | 9,120(0.72%)#9 | 624,863(0.01%)#1,087 |
| 10. | North Massapequa | 62 | 9,120(0.68%)#10 | 624,863(0.01%)#1,133 |
| 11. | Menands | 62 | 9,120(0.68%)#11 | 624,863(0.01%)#1,138 |
| 12. | Middletown | 60 | 9,120(0.66%)#12 | 624,863(0.01%)#1,164 |
| 13. | Baldwinsville | 59 | 9,120(0.65%)#13 | 624,863(0.01%)#1,180 |
| 14. | Sayville | 57 | 9,120(0.62%)#14 | 624,863(0.01%)#1,207 |
| 15. | Ilion | 53 | 9,120(0.58%)#15 | 624,863(0.01%)#1,254 |
| 16. | Balmville | 53 | 9,120(0.58%)#16 | 624,863(0.01%)#1,255 |
| 17. | Irondequoit | 52 | 9,120(0.57%)#17 | 624,863(0.01%)#1,261 |
| 18. | Jefferson Valley Yorktown | 49 | 9,120(0.54%)#18 | 624,863(0.01%)#1,301 |
| 19. | Westmere | 42 | 9,120(0.46%)#19 | 624,863(0.01%)#1,413 |
| 20. | Cheektowaga | 40 | 9,120(0.44%)#20 | 624,863(0.01%)#1,439 |
| 21. | Gloversville | 37 | 9,120(0.41%)#21 | 624,863(0.01%)#1,513 |
| 22. | East Hills | 36 | 9,120(0.39%)#22 | 624,863(0.01%)#1,533 |
| 23. | North Bellmore | 34 | 9,120(0.37%)#23 | 624,863(0.01%)#1,570 |
| 24. | Syracuse | 33 | 9,120(0.36%)#24 | 624,863(0.01%)#1,584 |
| 25. | Marist College | 33 | 9,120(0.36%)#25 | 624,863(0.01%)#1,605 |
| 26. | Airmont | 31 | 9,120(0.34%)#26 | 624,863(0.00%)#1,652 |
| 27. | Ogdensburg | 31 | 9,120(0.34%)#27 | 624,863(0.00%)#1,654 |
| 28. | Albany | 30 | 9,120(0.33%)#28 | 624,863(0.00%)#1,663 |
| 29. | White Plains | 30 | 9,120(0.33%)#29 | 624,863(0.00%)#1,667 |
| 30. | Cohoes | 30 | 9,120(0.33%)#30 | 624,863(0.00%)#1,676 |
| 31. | Hicksville | 28 | 9,120(0.31%)#31 | 624,863(0.00%)#1,724 |
| 32. | East Massapequa | 28 | 9,120(0.31%)#32 | 624,863(0.00%)#1,734 |
| 33. | Roessleville | 28 | 9,120(0.31%)#33 | 624,863(0.00%)#1,740 |
| 34. | Coram | 26 | 9,120(0.29%)#34 | 624,863(0.00%)#1,799 |
| 35. | Binghamton | 24 | 9,120(0.26%)#35 | 624,863(0.00%)#1,859 |
| 36. | Mamaroneck | 24 | 9,120(0.26%)#36 | 624,863(0.00%)#1,872 |
| 37. | Suny Oswego | 24 | 9,120(0.26%)#37 | 624,863(0.00%)#1,890 |
| 38. | Plattsburgh | 22 | 9,120(0.24%)#38 | 624,863(0.00%)#1,954 |
| 39. | Fort Ann | 22 | 9,120(0.24%)#39 | 624,863(0.00%)#1,981 |
| 40. | Central Islip | 21 | 9,120(0.23%)#40 | 624,863(0.00%)#1,994 |
| 41. | New Windsor | 21 | 9,120(0.23%)#41 | 624,863(0.00%)#2,015 |
| 42. | Bard College | 21 | 9,120(0.23%)#42 | 624,863(0.00%)#2,032 |
| 43. | East Quogue | 20 | 9,120(0.22%)#43 | 624,863(0.00%)#2,068 |
| 44. | Pine Plains | 20 | 9,120(0.22%)#44 | 624,863(0.00%)#2,084 |
| 45. | Oswego | 19 | 9,120(0.21%)#45 | 624,863(0.00%)#2,103 |
| 46. | Walden | 19 | 9,120(0.21%)#46 | 624,863(0.00%)#2,116 |
| 47. | Akron | 19 | 9,120(0.21%)#47 | 624,863(0.00%)#2,124 |
| 48. | Arlington | 19 | 9,120(0.21%)#48 | 624,863(0.00%)#2,126 |
| 49. | Buffalo | 18 | 9,120(0.20%)#49 | 624,863(0.00%)#2,135 |
| 50. | Fredonia | 18 | 9,120(0.20%)#50 | 624,863(0.00%)#2,159 |
| 51. | West Seneca | 16 | 9,120(0.18%)#51 | 624,863(0.00%)#2,245 |
| 52. | Herkimer | 16 | 9,120(0.18%)#52 | 624,863(0.00%)#2,269 |
| 53. | Yonkers | 15 | 9,120(0.16%)#53 | 624,863(0.00%)#2,292 |
| 54. | East Ithaca | 15 | 9,120(0.16%)#54 | 624,863(0.00%)#2,339 |
| 55. | New Paltz | 14 | 9,120(0.15%)#55 | 624,863(0.00%)#2,393 |
| 56. | Canton | 14 | 9,120(0.15%)#56 | 624,863(0.00%)#2,396 |
| 57. | East Rochester | 14 | 9,120(0.15%)#57 | 624,863(0.00%)#2,399 |
| 58. | Florida | 14 | 9,120(0.15%)#58 | 624,863(0.00%)#2,405 |
| 59. | Little Falls | 13 | 9,120(0.14%)#59 | 624,863(0.00%)#2,472 |
| 60. | Falconer | 13 | 9,120(0.14%)#60 | 624,863(0.00%)#2,483 |
| 61. | Niagara Falls | 12 | 9,120(0.13%)#61 | 624,863(0.00%)#2,508 |
| 62. | Eggertsville | 12 | 9,120(0.13%)#62 | 624,863(0.00%)#2,531 |
| 63. | Newburgh | 11 | 9,120(0.12%)#63 | 624,863(0.00%)#2,586 |
| 64. | North Babylon | 11 | 9,120(0.12%)#64 | 624,863(0.00%)#2,597 |
| 65. | Mechanicstown | 11 | 9,120(0.12%)#65 | 624,863(0.00%)#2,606 |
| 66. | Farmingdale | 11 | 9,120(0.12%)#66 | 624,863(0.00%)#2,607 |
| 67. | North Gates | 10 | 9,120(0.11%)#67 | 624,863(0.00%)#2,683 |
| 68. | Brookhaven | 10 | 9,120(0.11%)#68 | 624,863(0.00%)#2,703 |
| 69. | Jamestown West | 10 | 9,120(0.11%)#69 | 624,863(0.00%)#2,711 |
| 70. | Middleburgh | 10 | 9,120(0.11%)#70 | 624,863(0.00%)#2,724 |
| 71. | Laurens | 10 | 9,120(0.11%)#71 | 624,863(0.00%)#2,733 |
| 72. | Utica | 9 | 9,120(0.10%)#72 | 624,863(0.00%)#2,738 |
| 73. | East Meadow | 9 | 9,120(0.10%)#73 | 624,863(0.00%)#2,745 |
| 74. | Lake Ronkonkoma | 9 | 9,120(0.10%)#74 | 624,863(0.00%)#2,756 |
| 75. | Baywood | 9 | 9,120(0.10%)#75 | 624,863(0.00%)#2,780 |
| 76. | Cumberland Head | 9 | 9,120(0.10%)#76 | 624,863(0.00%)#2,802 |
| 77. | Newark Valley | 9 | 9,120(0.10%)#77 | 624,863(0.00%)#2,809 |
| 78. | Alfred | 8 | 9,120(0.09%)#78 | 624,863(0.00%)#2,878 |
| 79. | Siena College | 8 | 9,120(0.09%)#79 | 624,863(0.00%)#2,900 |
| 80. | Lake Placid | 8 | 9,120(0.09%)#80 | 624,863(0.00%)#2,901 |
| 81. | Fishers Island | 8 | 9,120(0.09%)#81 | 624,863(0.00%)#2,927 |
| 82. | Hempstead | 7 | 9,120(0.08%)#82 | 624,863(0.00%)#2,933 |
| 83. | Centereach | 7 | 9,120(0.08%)#83 | 624,863(0.00%)#2,936 |
| 84. | Shirley | 7 | 9,120(0.08%)#84 | 624,863(0.00%)#2,942 |
| 85. | North Amityville | 7 | 9,120(0.08%)#85 | 624,863(0.00%)#2,949 |
| 86. | West Point | 7 | 9,120(0.08%)#86 | 624,863(0.00%)#2,976 |
| 87. | Upper Nyack | 7 | 9,120(0.08%)#87 | 624,863(0.00%)#2,998 |
| 88. | Amsterdam | 6 | 9,120(0.07%)#88 | 624,863(0.00%)#3,051 |
| 89. | Potsdam | 6 | 9,120(0.07%)#89 | 624,863(0.00%)#3,071 |
| 90. | Central Bridge | 6 | 9,120(0.07%)#90 | 624,863(0.00%)#3,135 |
| 91. | Freeport | 5 | 9,120(0.05%)#91 | 624,863(0.00%)#3,150 |
| 92. | University At Buffalo | 5 | 9,120(0.05%)#92 | 624,863(0.00%)#3,186 |
| 93. | Kings Point | 5 | 9,120(0.05%)#93 | 624,863(0.00%)#3,187 |
| 94. | Vassar College | 5 | 9,120(0.05%)#94 | 624,863(0.00%)#3,202 |
| 95. | Valatie | 5 | 9,120(0.05%)#95 | 624,863(0.00%)#3,220 |
| 96. | South Lansing | 5 | 9,120(0.05%)#96 | 624,863(0.00%)#3,242 |
| 97. | Long Beach | 4 | 9,120(0.04%)#97 | 624,863(0.00%)#3,270 |
| 98. | Hampton Bays | 4 | 9,120(0.04%)#98 | 624,863(0.00%)#3,287 |
| 99. | North Bellport | 4 | 9,120(0.04%)#99 | 624,863(0.00%)#3,299 |
| 100. | Brockport | 4 | 9,120(0.04%)#100 | 624,863(0.00%)#3,307 |
Common Questions
What are the Top 10 Cities with the Largest Hawaiian / Pacific Community in New York?
Top 10 Cities with the Largest Hawaiian / Pacific Community in New York are:
#1
5,431
#2
349
#3
183
#4
99
#5
85
#6
83
#7
76
#8
71
#9
66
#10
62
What city has the Largest Hawaiian / Pacific Community in New York?
New York has the Largest Hawaiian / Pacific Community in New York with 5,431.
What is the Total Hawaiian / Pacific Population in the State of New York?
Total Hawaiian / Pacific Population in New York is 9,120.
What is the Total Hawaiian / Pacific Population in the United States?
Total Hawaiian / Pacific Population in the United States is 624,863.