Cities with the Largest Hawaiian / Pacific Community in Kentucky
RELATED REPORTS & OPTIONS
Hawaiian / Pacific
Kentucky
Compare Cities
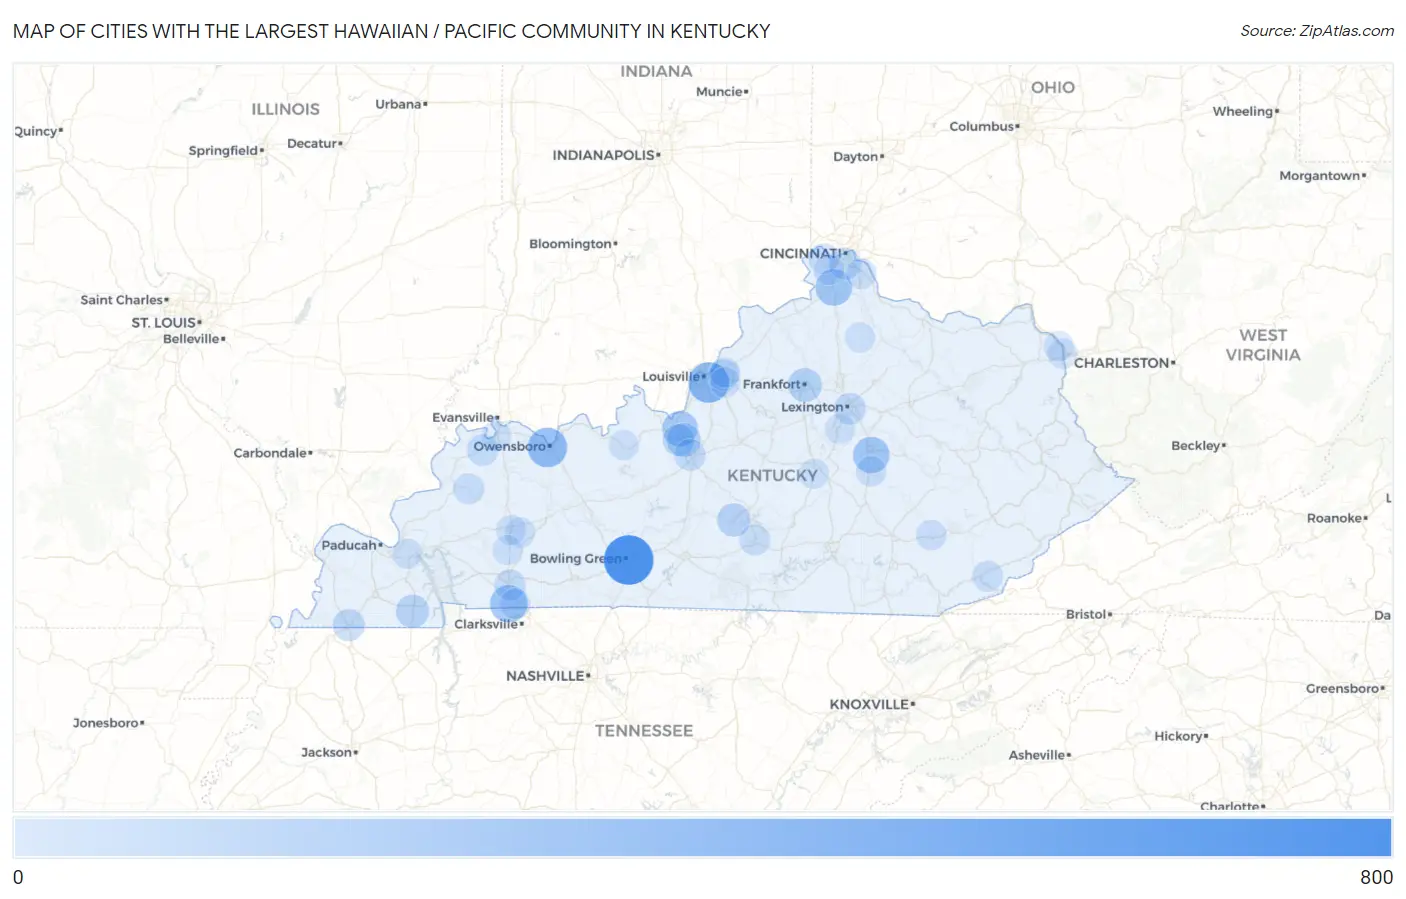
Map of Cities with the Largest Hawaiian / Pacific Community in Kentucky
0
800

Cities with the Largest Hawaiian / Pacific Community in Kentucky
| City | Hawaiian / Pacific | vs State | vs National | |
| 1. | Bowling Green | 640 | 3,805(16.82%)#1 | 624,863(0.10%)#179 |
| 2. | Louisville | 340 | 3,805(8.94%)#2 | 624,863(0.05%)#313 |
| 3. | Owensboro | 300 | 3,805(7.88%)#3 | 624,863(0.05%)#350 |
| 4. | Fort Campbell North | 232 | 3,805(6.10%)#4 | 624,863(0.04%)#440 |
| 5. | Walton | 203 | 3,805(5.34%)#5 | 624,863(0.03%)#488 |
| 6. | Richmond | 200 | 3,805(5.26%)#6 | 624,863(0.03%)#494 |
| 7. | Fort Knox | 173 | 3,805(4.55%)#7 | 624,863(0.03%)#559 |
| 8. | Radcliff | 121 | 3,805(3.18%)#8 | 624,863(0.02%)#733 |
| 9. | Frankfort | 115 | 3,805(3.02%)#9 | 624,863(0.02%)#767 |
| 10. | Greensburg | 99 | 3,805(2.60%)#10 | 624,863(0.02%)#845 |
| 11. | Murray | 94 | 3,805(2.47%)#11 | 624,863(0.02%)#873 |
| 12. | Fulton | 60 | 3,805(1.58%)#12 | 624,863(0.01%)#1,171 |
| 13. | Covington | 55 | 3,805(1.45%)#13 | 624,863(0.01%)#1,226 |
| 14. | Vine Grove | 55 | 3,805(1.45%)#14 | 624,863(0.01%)#1,233 |
| 15. | Lexington | 49 | 3,805(1.29%)#15 | 624,863(0.01%)#1,292 |
| 16. | Elizabethtown | 45 | 3,805(1.18%)#16 | 624,863(0.01%)#1,356 |
| 17. | Corydon | 42 | 3,805(1.10%)#17 | 624,863(0.01%)#1,421 |
| 18. | Hopkinsville | 29 | 3,805(0.76%)#18 | 624,863(0.00%)#1,691 |
| 19. | Lyndon | 27 | 3,805(0.71%)#19 | 624,863(0.00%)#1,778 |
| 20. | Clay | 27 | 3,805(0.71%)#20 | 624,863(0.00%)#1,788 |
| 21. | Columbia | 24 | 3,805(0.63%)#21 | 624,863(0.00%)#1,887 |
| 22. | Coxton | 24 | 3,805(0.63%)#22 | 624,863(0.00%)#1,898 |
| 23. | Alexandria | 16 | 3,805(0.42%)#23 | 624,863(0.00%)#2,265 |
| 24. | Oak Grove | 15 | 3,805(0.39%)#24 | 624,863(0.00%)#2,325 |
| 25. | Hebron | 13 | 3,805(0.34%)#25 | 624,863(0.00%)#2,464 |
| 26. | Berea | 12 | 3,805(0.32%)#26 | 624,863(0.00%)#2,529 |
| 27. | Manchester | 10 | 3,805(0.26%)#27 | 624,863(0.00%)#2,716 |
| 28. | Nicholasville | 6 | 3,805(0.16%)#28 | 624,863(0.00%)#3,040 |
| 29. | Jeffersontown | 6 | 3,805(0.16%)#29 | 624,863(0.00%)#3,042 |
| 30. | White Plains | 6 | 3,805(0.16%)#30 | 624,863(0.00%)#3,123 |
| 31. | Catlettsburg | 5 | 3,805(0.13%)#31 | 624,863(0.00%)#3,218 |
| 32. | Henderson | 4 | 3,805(0.11%)#32 | 624,863(0.00%)#3,273 |
| 33. | Hardinsburg | 4 | 3,805(0.11%)#33 | 624,863(0.00%)#3,330 |
| 34. | Ashland | 3 | 3,805(0.08%)#34 | 624,863(0.00%)#3,399 |
| 35. | Calvert City | 3 | 3,805(0.08%)#35 | 624,863(0.00%)#3,444 |
| 36. | Junction City | 3 | 3,805(0.08%)#36 | 624,863(0.00%)#3,452 |
| 37. | Berry | 3 | 3,805(0.08%)#37 | 624,863(0.00%)#3,510 |
| 38. | Florence | 1 | 3,805(0.03%)#38 | 624,863(0.00%)#3,679 |
| 39. | Meadow Vale | 1 | 3,805(0.03%)#39 | 624,863(0.00%)#3,749 |
| 40. | Nortonville | 1 | 3,805(0.03%)#40 | 624,863(0.00%)#3,751 |
| 41. | Crofton | 1 | 3,805(0.03%)#41 | 624,863(0.00%)#3,765 |
Common Questions
What are the Top 10 Cities with the Largest Hawaiian / Pacific Community in Kentucky?
Top 10 Cities with the Largest Hawaiian / Pacific Community in Kentucky are:
#1
640
#2
340
#3
300
#4
232
#5
203
#6
200
#7
173
#8
121
#9
115
#10
99
What city has the Largest Hawaiian / Pacific Community in Kentucky?
Bowling Green has the Largest Hawaiian / Pacific Community in Kentucky with 640.
What is the Total Hawaiian / Pacific Population in the State of Kentucky?
Total Hawaiian / Pacific Population in Kentucky is 3,805.
What is the Total Hawaiian / Pacific Population in the United States?
Total Hawaiian / Pacific Population in the United States is 624,863.