Cities with the Largest Hawaiian / Pacific Community in Maryland
RELATED REPORTS & OPTIONS
Hawaiian / Pacific
Maryland
Compare Cities
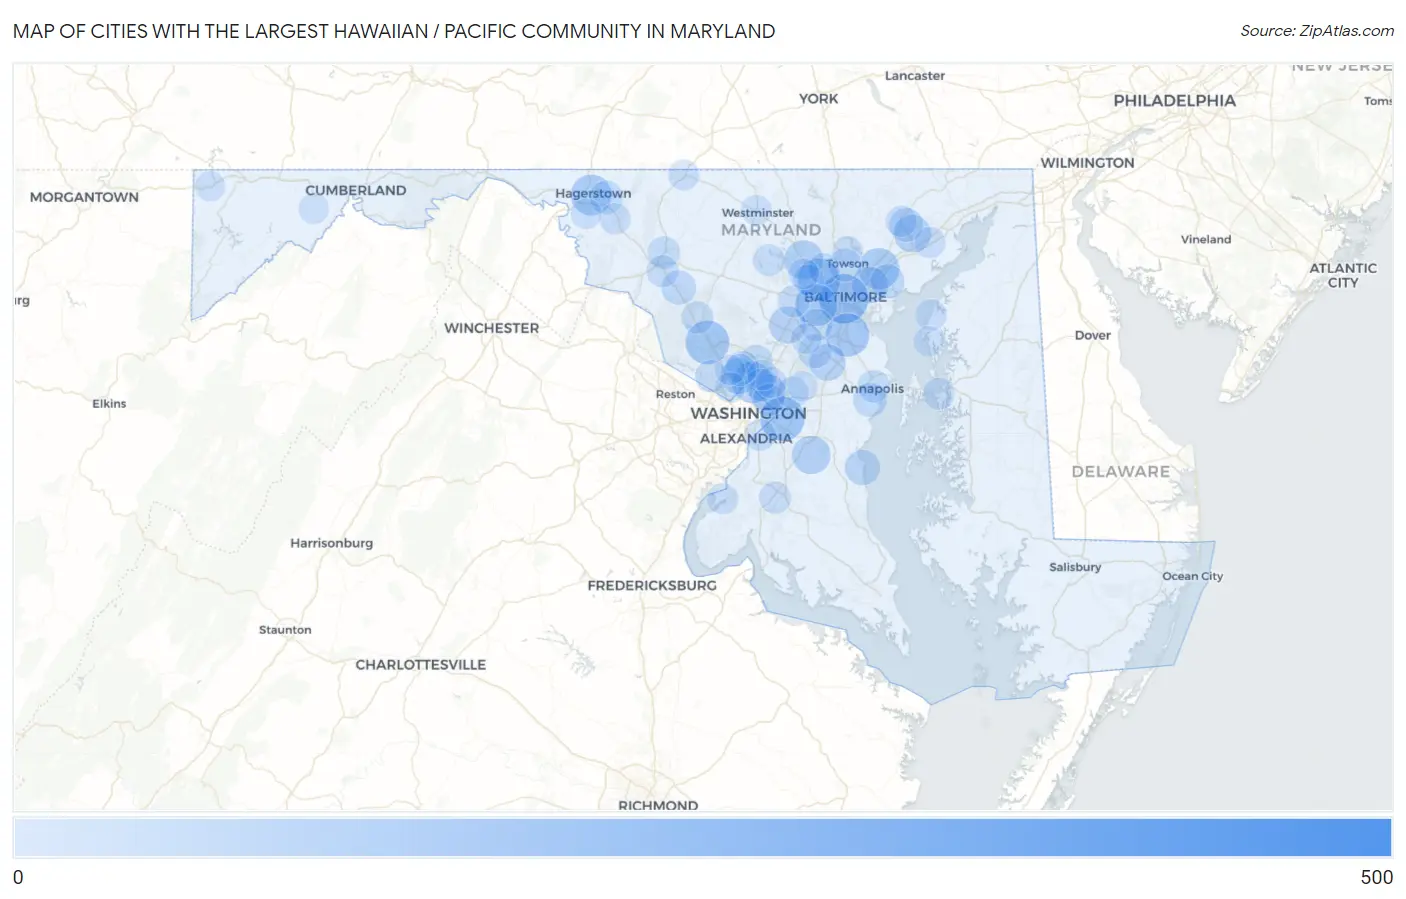
Map of Cities with the Largest Hawaiian / Pacific Community in Maryland
0
500
Cities with the Largest Hawaiian / Pacific Community in Maryland
| City | Hawaiian / Pacific | vs State | vs National | |
| 1. | Woodlawn Cdp Baltimore County | 451 | 3,120(14.46%)#1 | 624,863(0.07%)#242 |
| 2. | Baltimore | 181 | 3,120(5.80%)#2 | 624,863(0.03%)#534 |
| 3. | Walker Mill | 133 | 3,120(4.26%)#3 | 624,863(0.02%)#687 |
| 4. | Gaithersburg | 126 | 3,120(4.04%)#4 | 624,863(0.02%)#705 |
| 5. | Glen Burnie | 124 | 3,120(3.97%)#5 | 624,863(0.02%)#719 |
| 6. | Lochearn | 120 | 3,120(3.85%)#6 | 624,863(0.02%)#740 |
| 7. | Catonsville | 110 | 3,120(3.53%)#7 | 624,863(0.02%)#789 |
| 8. | White Marsh | 104 | 3,120(3.33%)#8 | 624,863(0.02%)#827 |
| 9. | Silver Spring | 103 | 3,120(3.30%)#9 | 624,863(0.02%)#829 |
| 10. | Hagerstown | 101 | 3,120(3.24%)#10 | 624,863(0.02%)#833 |
| 11. | Owings Mills | 86 | 3,120(2.76%)#11 | 624,863(0.01%)#926 |
| 12. | Croom | 77 | 3,120(2.47%)#12 | 624,863(0.01%)#992 |
| 13. | Bel Air South | 67 | 3,120(2.15%)#13 | 624,863(0.01%)#1,070 |
| 14. | Columbia | 65 | 3,120(2.08%)#14 | 624,863(0.01%)#1,094 |
| 15. | Odenton | 60 | 3,120(1.92%)#15 | 624,863(0.01%)#1,162 |
| 16. | Rosedale | 60 | 3,120(1.92%)#16 | 624,863(0.01%)#1,169 |
| 17. | Hyattsville | 58 | 3,120(1.86%)#17 | 624,863(0.01%)#1,191 |
| 18. | South Kensington | 52 | 3,120(1.67%)#18 | 624,863(0.01%)#1,265 |
| 19. | North Beach | 49 | 3,120(1.57%)#19 | 624,863(0.01%)#1,305 |
| 20. | Urbana | 40 | 3,120(1.28%)#20 | 624,863(0.01%)#1,449 |
| 21. | Middle River | 36 | 3,120(1.15%)#21 | 624,863(0.01%)#1,525 |
| 22. | Bel Air | 36 | 3,120(1.15%)#22 | 624,863(0.01%)#1,532 |
| 23. | Annapolis Neck | 33 | 3,120(1.06%)#23 | 624,863(0.01%)#1,597 |
| 24. | Fort Meade | 33 | 3,120(1.06%)#24 | 624,863(0.01%)#1,600 |
| 25. | Robinwood | 32 | 3,120(1.03%)#25 | 624,863(0.01%)#1,627 |
| 26. | Colesville | 28 | 3,120(0.90%)#26 | 624,863(0.00%)#1,739 |
| 27. | Towson | 27 | 3,120(0.87%)#27 | 624,863(0.00%)#1,760 |
| 28. | Wheaton | 26 | 3,120(0.83%)#28 | 624,863(0.00%)#1,796 |
| 29. | Frederick | 22 | 3,120(0.71%)#29 | 624,863(0.00%)#1,940 |
| 30. | Naval Academy | 22 | 3,120(0.71%)#30 | 624,863(0.00%)#1,975 |
| 31. | Langley Park | 21 | 3,120(0.67%)#31 | 624,863(0.00%)#2,001 |
| 32. | Elkridge | 20 | 3,120(0.64%)#32 | 624,863(0.00%)#2,051 |
| 33. | Cottage City | 20 | 3,120(0.64%)#33 | 624,863(0.00%)#2,083 |
| 34. | Potomac | 19 | 3,120(0.61%)#34 | 624,863(0.00%)#2,090 |
| 35. | Clarksburg | 19 | 3,120(0.61%)#35 | 624,863(0.00%)#2,095 |
| 36. | Ellicott City | 18 | 3,120(0.58%)#36 | 624,863(0.00%)#2,140 |
| 37. | Ballenger Creek | 18 | 3,120(0.58%)#37 | 624,863(0.00%)#2,150 |
| 38. | Lanham | 18 | 3,120(0.58%)#38 | 624,863(0.00%)#2,156 |
| 39. | Waldorf | 17 | 3,120(0.54%)#39 | 624,863(0.00%)#2,189 |
| 40. | Eldersburg | 17 | 3,120(0.54%)#40 | 624,863(0.00%)#2,195 |
| 41. | North Kensington | 17 | 3,120(0.54%)#41 | 624,863(0.00%)#2,211 |
| 42. | Glassmanor | 15 | 3,120(0.48%)#42 | 624,863(0.00%)#2,311 |
| 43. | Grasonville | 15 | 3,120(0.48%)#43 | 624,863(0.00%)#2,335 |
| 44. | Pikesville | 13 | 3,120(0.42%)#44 | 624,863(0.00%)#2,439 |
| 45. | Tolchester | 11 | 3,120(0.35%)#45 | 624,863(0.00%)#2,653 |
| 46. | Mount Lena | 10 | 3,120(0.32%)#46 | 624,863(0.00%)#2,731 |
| 47. | Bel Air North | 9 | 3,120(0.29%)#47 | 624,863(0.00%)#2,747 |
| 48. | College Park | 8 | 3,120(0.26%)#48 | 624,863(0.00%)#2,829 |
| 49. | Milford Mill | 8 | 3,120(0.26%)#49 | 624,863(0.00%)#2,832 |
| 50. | Green Valley | 8 | 3,120(0.26%)#50 | 624,863(0.00%)#2,853 |
| 51. | Riverside | 8 | 3,120(0.26%)#51 | 624,863(0.00%)#2,873 |
| 52. | Indian Head | 8 | 3,120(0.26%)#52 | 624,863(0.00%)#2,882 |
| 53. | Emmitsburg | 7 | 3,120(0.22%)#53 | 624,863(0.00%)#2,990 |
| 54. | Jessup | 6 | 3,120(0.19%)#54 | 624,863(0.00%)#3,067 |
| 55. | Randallstown | 5 | 3,120(0.16%)#55 | 624,863(0.00%)#3,156 |
| 56. | Timonium | 4 | 3,120(0.13%)#56 | 624,863(0.00%)#3,298 |
| 57. | Hillandale | 4 | 3,120(0.13%)#57 | 624,863(0.00%)#3,315 |
| 58. | St James | 4 | 3,120(0.13%)#58 | 624,863(0.00%)#3,318 |
| 59. | Westminster | 3 | 3,120(0.10%)#59 | 624,863(0.00%)#3,401 |
| 60. | Glenn Dale | 3 | 3,120(0.10%)#60 | 624,863(0.00%)#3,410 |
| 61. | Bethesda | 2 | 3,120(0.06%)#61 | 624,863(0.00%)#3,517 |
| 62. | North Bethesda | 2 | 3,120(0.06%)#62 | 624,863(0.00%)#3,520 |
| 63. | Midland | 2 | 3,120(0.06%)#63 | 624,863(0.00%)#3,611 |
| 64. | Rock Hall | 1 | 3,120(0.03%)#64 | 624,863(0.00%)#3,736 |
| 65. | Friendsville | 1 | 3,120(0.03%)#65 | 624,863(0.00%)#3,773 |
Common Questions
What are the Top 10 Cities with the Largest Hawaiian / Pacific Community in Maryland?
Top 10 Cities with the Largest Hawaiian / Pacific Community in Maryland are:
#1
181
#2
133
#3
126
#4
124
#5
120
#6
110
#7
104
#8
103
#9
101
#10
86
What city has the Largest Hawaiian / Pacific Community in Maryland?
Baltimore has the Largest Hawaiian / Pacific Community in Maryland with 181.
What is the Total Hawaiian / Pacific Population in the State of Maryland?
Total Hawaiian / Pacific Population in Maryland is 3,120.
What is the Total Hawaiian / Pacific Population in the United States?
Total Hawaiian / Pacific Population in the United States is 624,863.