Zip Codes with the Highest Percentage of Population with a Degree in Visual and Performing Arts in Chicopee, MA
RELATED REPORTS & OPTIONS
Visual and Performing Arts
Chicopee
Compare Zip Codes
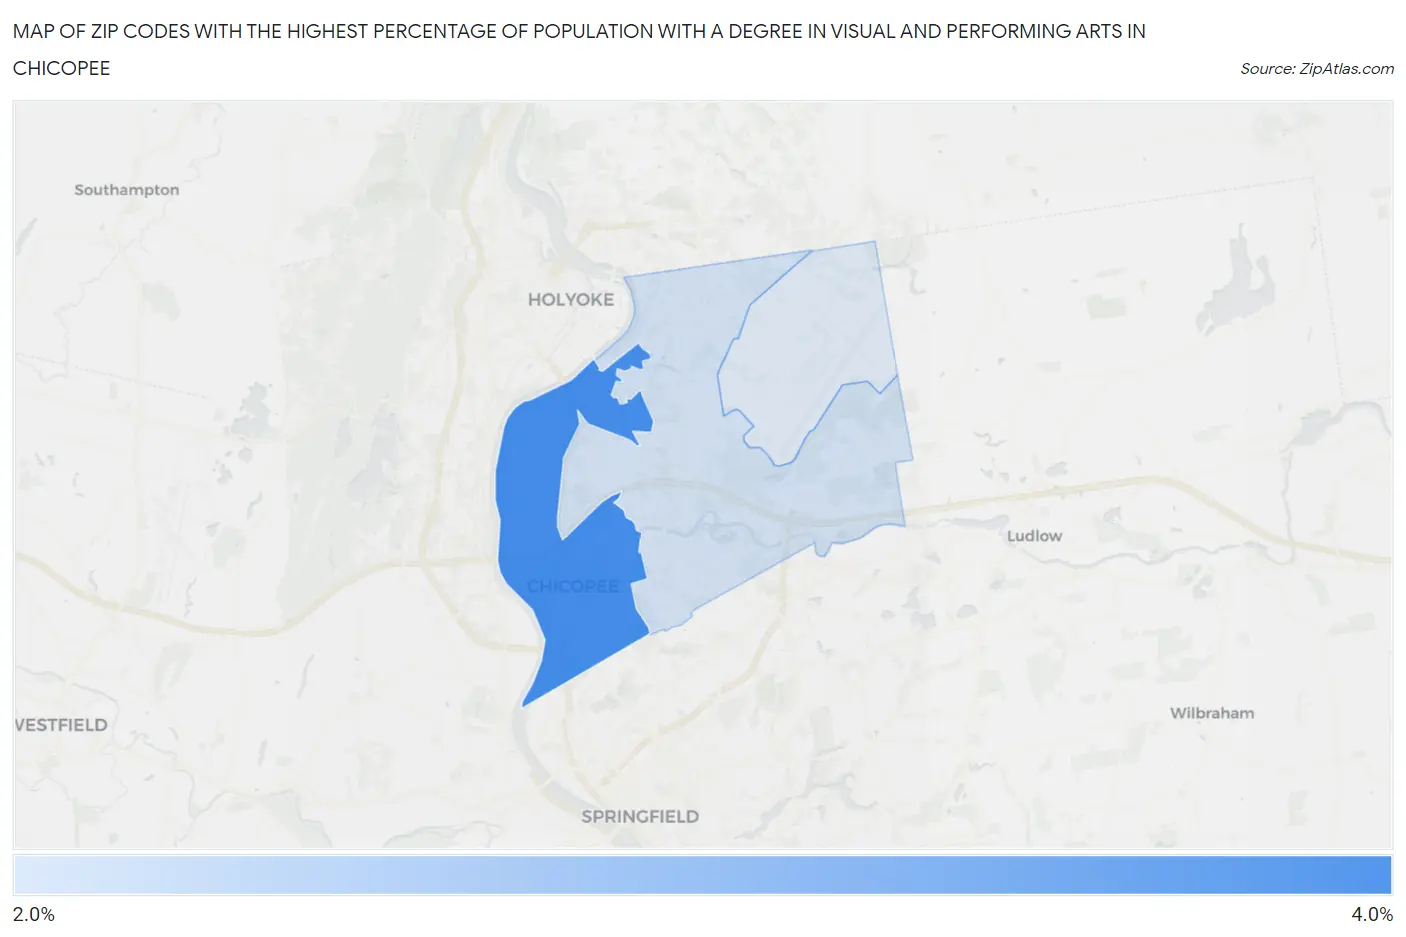
Map of Zip Codes with the Highest Percentage of Population with a Degree in Visual and Performing Arts in Chicopee
2.4%
3.1%
Zip Codes with the Highest Percentage of Population with a Degree in Visual and Performing Arts in Chicopee, MA
| Zip Code | % Graduates | vs State | vs National | |
| 1. | 01013 | 3.1% | 4.7%(-1.65)#371 | 4.3%(-1.18)#12,462 |
| 2. | 01020 | 2.4% | 4.7%(-2.36)#418 | 4.3%(-1.90)#15,167 |
1
Common Questions
What are the Top Zip Codes with the Highest Percentage of Population with a Degree in Visual and Performing Arts in Chicopee, MA?
Top Zip Codes with the Highest Percentage of Population with a Degree in Visual and Performing Arts in Chicopee, MA are:
What zip code has the Highest Percentage of Population with a Degree in Visual and Performing Arts in Chicopee, MA?
01013 has the Highest Percentage of Population with a Degree in Visual and Performing Arts in Chicopee, MA with 3.1%.
What is the Percentage of Population with a Degree in Visual and Performing Arts in Chicopee, MA?
Percentage of Population with a Degree in Visual and Performing Arts in Chicopee is 2.5%.
What is the Percentage of Population with a Degree in Visual and Performing Arts in Massachusetts?
Percentage of Population with a Degree in Visual and Performing Arts in Massachusetts is 4.7%.
What is the Percentage of Population with a Degree in Visual and Performing Arts in the United States?
Percentage of Population with a Degree in Visual and Performing Arts in the United States is 4.3%.