Zip Codes with the Highest Percentage of Population with a Degree in Visual and Performing Arts in Lawrence, MA
RELATED REPORTS & OPTIONS
Visual and Performing Arts
Lawrence
Compare Zip Codes
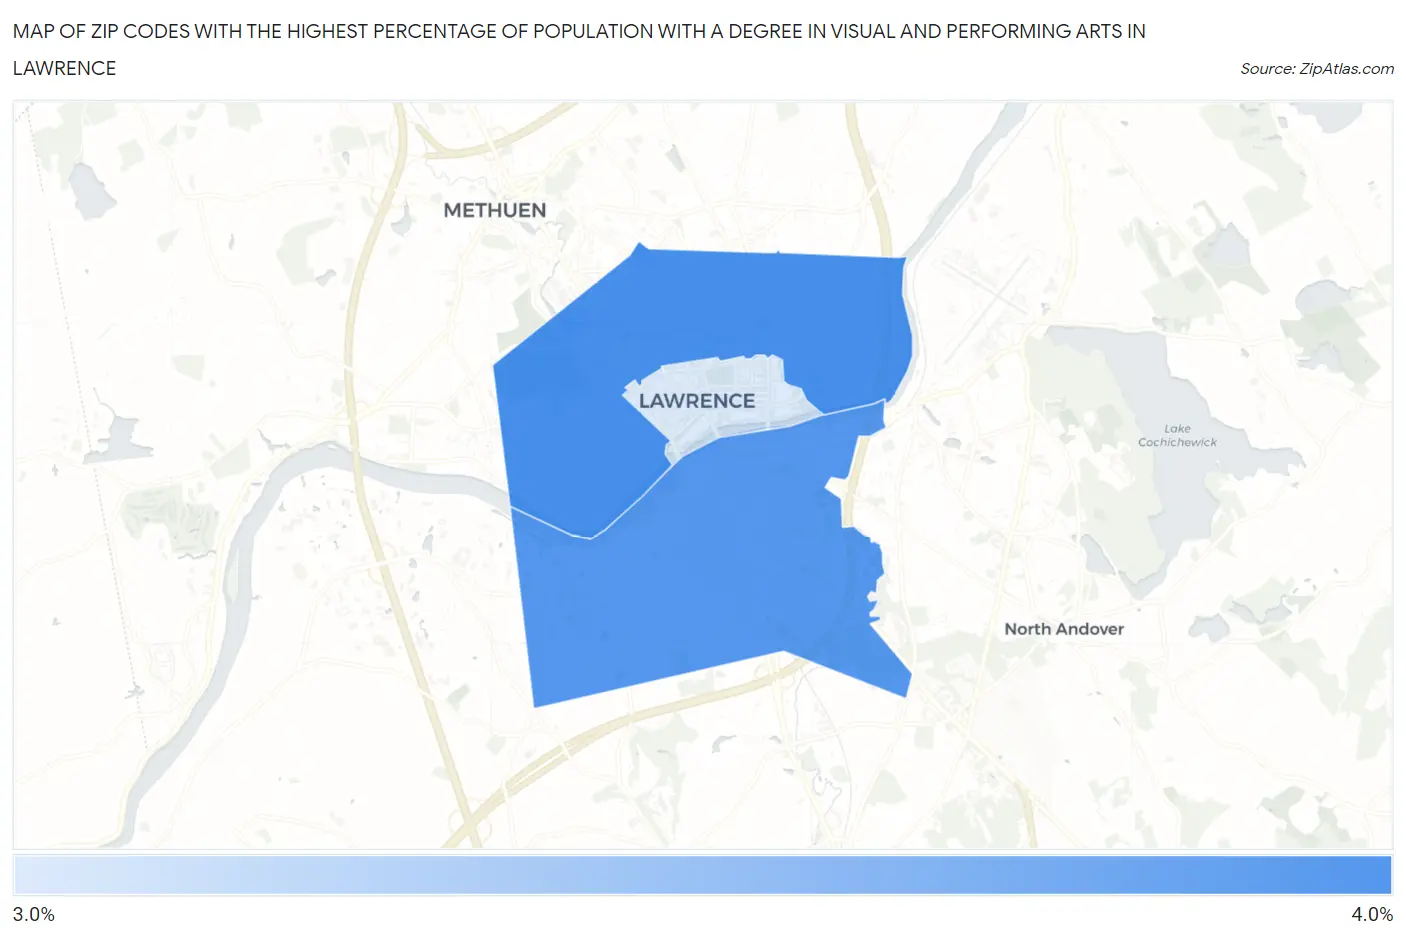
Map of Zip Codes with the Highest Percentage of Population with a Degree in Visual and Performing Arts in Lawrence
3.3%
3.6%
Zip Codes with the Highest Percentage of Population with a Degree in Visual and Performing Arts in Lawrence, MA
| Zip Code | % Graduates | vs State | vs National | |
| 1. | 01841 | 3.6% | 4.7%(-1.07)#317 | 4.3%(-0.605)#10,343 |
| 2. | 01843 | 3.6% | 4.7%(-1.10)#323 | 4.3%(-0.638)#10,454 |
| 3. | 01840 | 3.3% | 4.7%(-1.43)#352 | 4.3%(-0.969)#11,683 |
1
Common Questions
What are the Top Zip Codes with the Highest Percentage of Population with a Degree in Visual and Performing Arts in Lawrence, MA?
Top Zip Codes with the Highest Percentage of Population with a Degree in Visual and Performing Arts in Lawrence, MA are:
What zip code has the Highest Percentage of Population with a Degree in Visual and Performing Arts in Lawrence, MA?
01841 has the Highest Percentage of Population with a Degree in Visual and Performing Arts in Lawrence, MA with 3.6%.
What is the Percentage of Population with a Degree in Visual and Performing Arts in Lawrence, MA?
Percentage of Population with a Degree in Visual and Performing Arts in Lawrence is 3.6%.
What is the Percentage of Population with a Degree in Visual and Performing Arts in Massachusetts?
Percentage of Population with a Degree in Visual and Performing Arts in Massachusetts is 4.7%.
What is the Percentage of Population with a Degree in Visual and Performing Arts in the United States?
Percentage of Population with a Degree in Visual and Performing Arts in the United States is 4.3%.