Zip Codes with the Highest Percentage of Population with a Degree in Visual and Performing Arts in Lynn, MA
RELATED REPORTS & OPTIONS
Visual and Performing Arts
Lynn
Compare Zip Codes
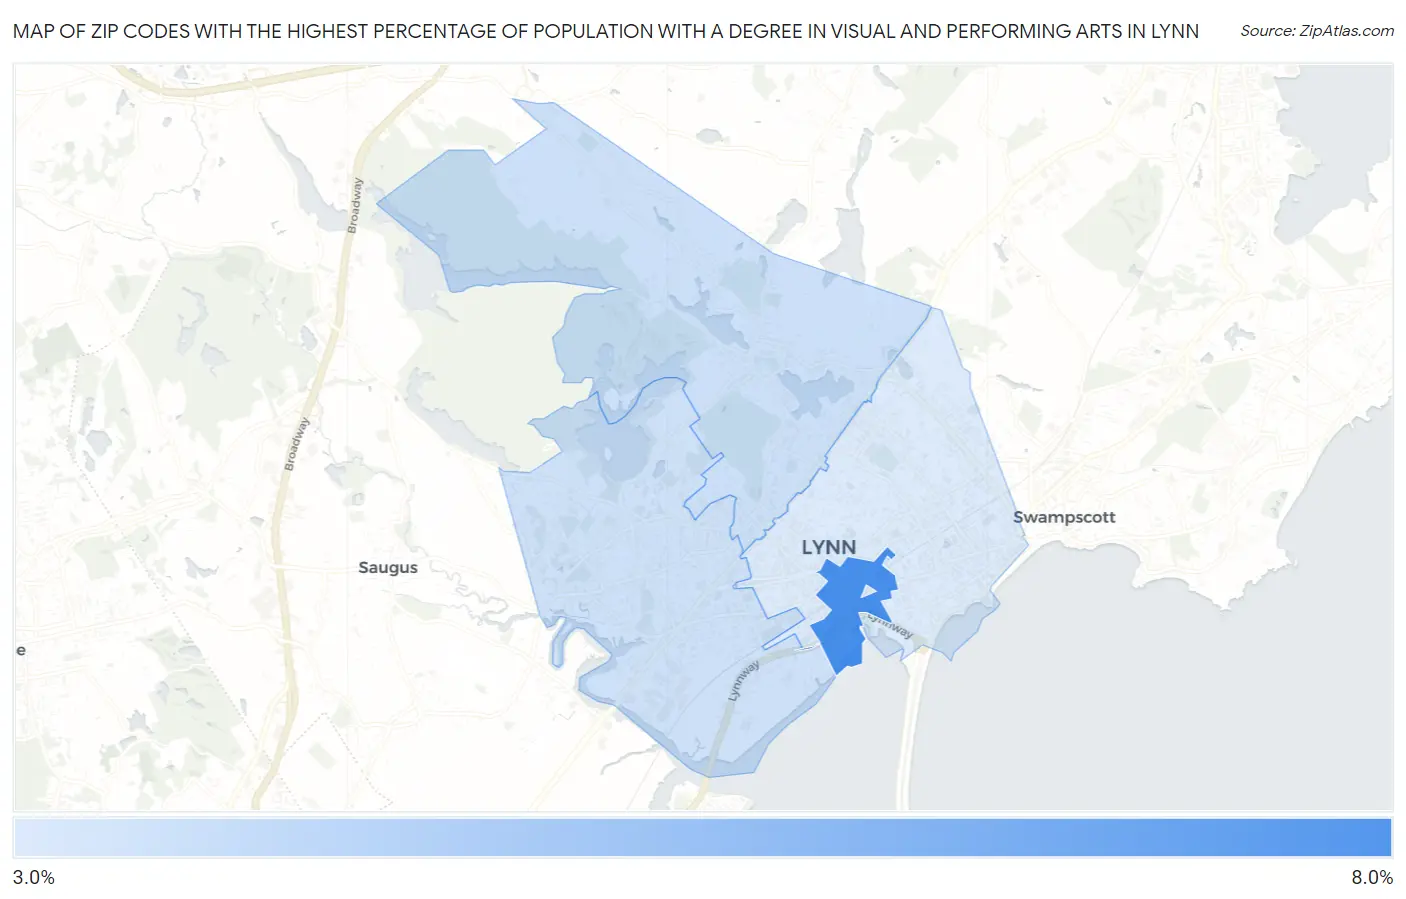
Map of Zip Codes with the Highest Percentage of Population with a Degree in Visual and Performing Arts in Lynn
3.1%
7.8%
Zip Codes with the Highest Percentage of Population with a Degree in Visual and Performing Arts in Lynn, MA
| Zip Code | % Graduates | vs State | vs National | |
| 1. | 01901 | 7.8% | 4.7%(+3.10)#63 | 4.3%(+3.56)#2,977 |
| 2. | 01904 | 3.6% | 4.7%(-1.14)#326 | 4.3%(-0.678)#10,586 |
| 3. | 01905 | 3.5% | 4.7%(-1.25)#338 | 4.3%(-0.792)#11,032 |
| 4. | 01902 | 3.1% | 4.7%(-1.66)#375 | 4.3%(-1.20)#12,531 |
1
Common Questions
What are the Top 3 Zip Codes with the Highest Percentage of Population with a Degree in Visual and Performing Arts in Lynn, MA?
Top 3 Zip Codes with the Highest Percentage of Population with a Degree in Visual and Performing Arts in Lynn, MA are:
What zip code has the Highest Percentage of Population with a Degree in Visual and Performing Arts in Lynn, MA?
01901 has the Highest Percentage of Population with a Degree in Visual and Performing Arts in Lynn, MA with 7.8%.
What is the Percentage of Population with a Degree in Visual and Performing Arts in Lynn, MA?
Percentage of Population with a Degree in Visual and Performing Arts in Lynn is 3.5%.
What is the Percentage of Population with a Degree in Visual and Performing Arts in Massachusetts?
Percentage of Population with a Degree in Visual and Performing Arts in Massachusetts is 4.7%.
What is the Percentage of Population with a Degree in Visual and Performing Arts in the United States?
Percentage of Population with a Degree in Visual and Performing Arts in the United States is 4.3%.