Zip Codes with the Highest Percentage of Population with a Degree in Visual and Performing Arts in Waltham, MA
RELATED REPORTS & OPTIONS
Visual and Performing Arts
Waltham
Compare Zip Codes
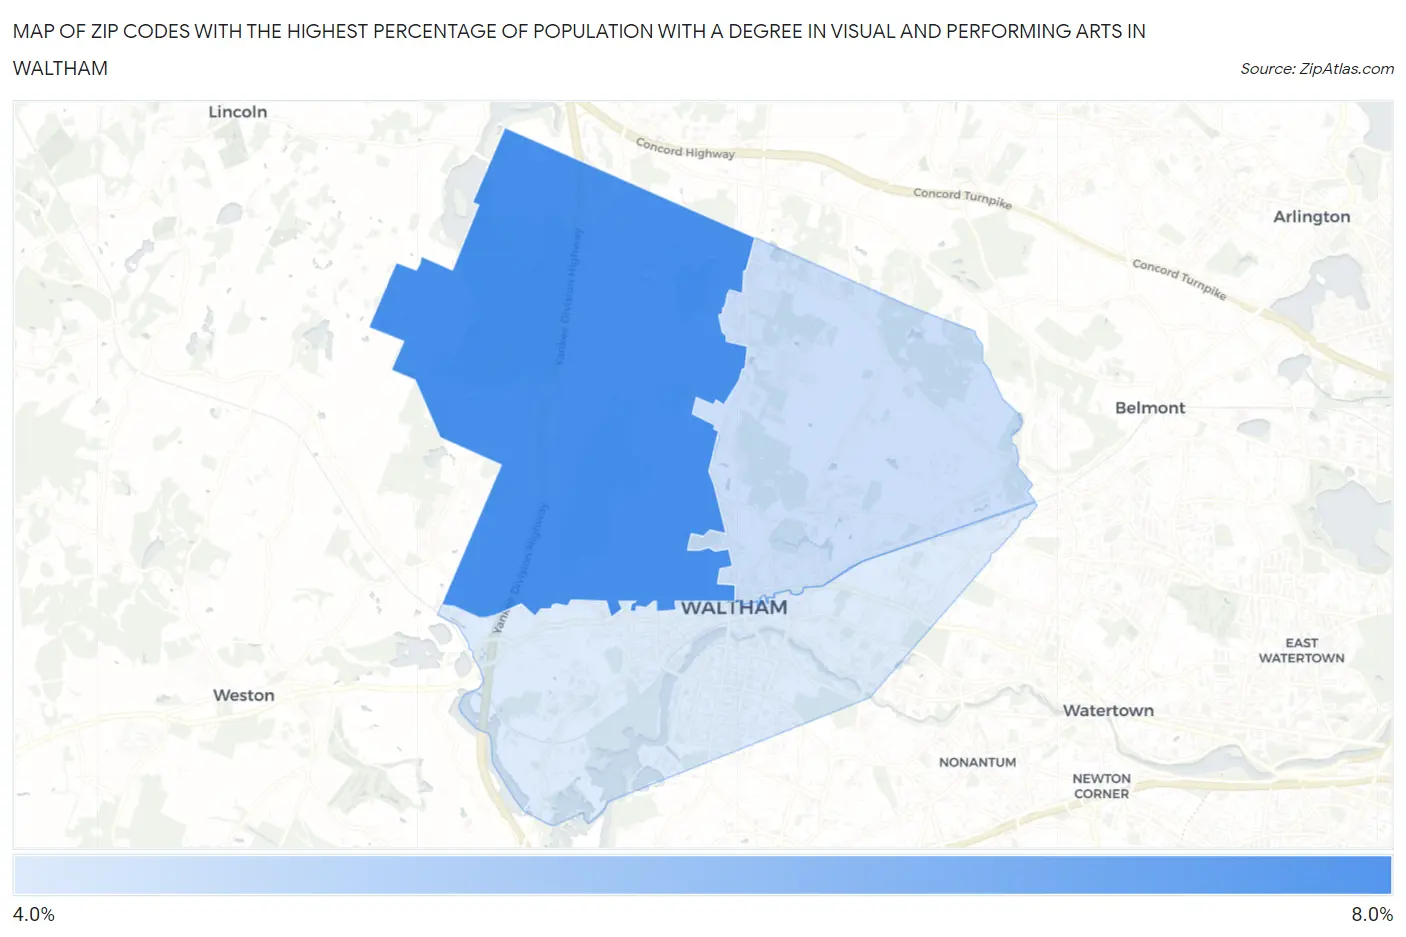
Map of Zip Codes with the Highest Percentage of Population with a Degree in Visual and Performing Arts in Waltham
4.1%
7.1%
Zip Codes with the Highest Percentage of Population with a Degree in Visual and Performing Arts in Waltham, MA
| Zip Code | % Graduates | vs State | vs National | |
| 1. | 02451 | 7.1% | 4.7%(+2.42)#84 | 4.3%(+2.88)#3,530 |
| 2. | 02452 | 4.5% | 4.7%(-0.215)#241 | 4.3%(+0.248)#7,813 |
| 3. | 02453 | 4.1% | 4.7%(-0.602)#271 | 4.3%(-0.139)#8,893 |
1
Common Questions
What are the Top Zip Codes with the Highest Percentage of Population with a Degree in Visual and Performing Arts in Waltham, MA?
Top Zip Codes with the Highest Percentage of Population with a Degree in Visual and Performing Arts in Waltham, MA are:
What zip code has the Highest Percentage of Population with a Degree in Visual and Performing Arts in Waltham, MA?
02451 has the Highest Percentage of Population with a Degree in Visual and Performing Arts in Waltham, MA with 7.1%.
What is the Percentage of Population with a Degree in Visual and Performing Arts in Waltham, MA?
Percentage of Population with a Degree in Visual and Performing Arts in Waltham is 5.2%.
What is the Percentage of Population with a Degree in Visual and Performing Arts in Massachusetts?
Percentage of Population with a Degree in Visual and Performing Arts in Massachusetts is 4.7%.
What is the Percentage of Population with a Degree in Visual and Performing Arts in the United States?
Percentage of Population with a Degree in Visual and Performing Arts in the United States is 4.3%.