Zip Codes with the Highest Percentage of Population with a Degree in Visual and Performing Arts in Lowell, MA
RELATED REPORTS & OPTIONS
Visual and Performing Arts
Lowell
Compare Zip Codes
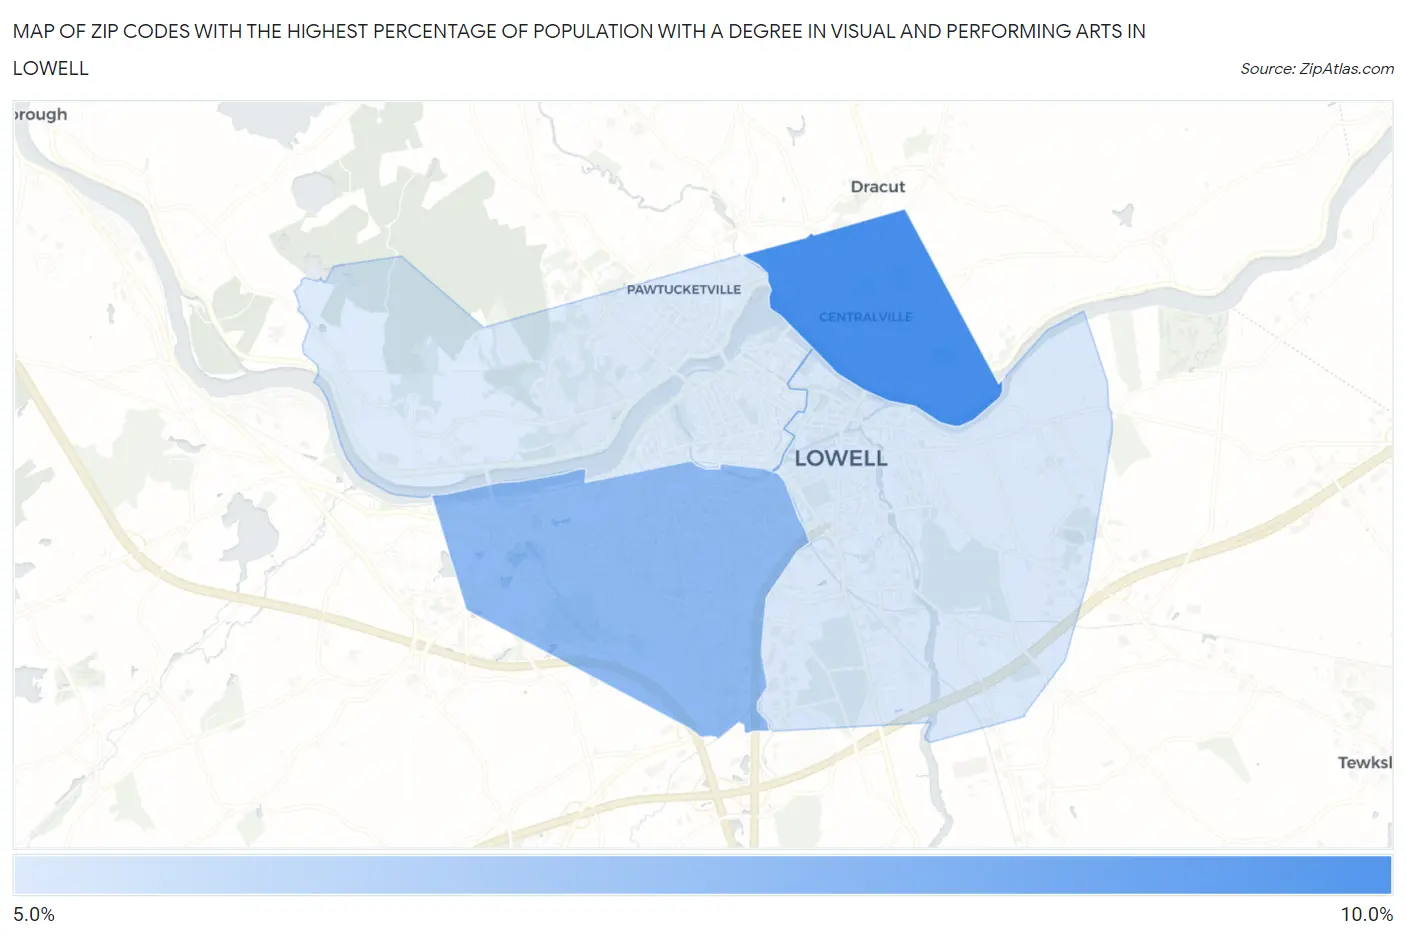
Map of Zip Codes with the Highest Percentage of Population with a Degree in Visual and Performing Arts in Lowell
5.9%
8.7%
Zip Codes with the Highest Percentage of Population with a Degree in Visual and Performing Arts in Lowell, MA
| Zip Code | % Graduates | vs State | vs National | |
| 1. | 01850 | 8.7% | 4.7%(+3.95)#52 | 4.3%(+4.41)#2,440 |
| 2. | 01851 | 7.4% | 4.7%(+2.65)#76 | 4.3%(+3.12)#3,316 |
| 3. | 01852 | 6.0% | 4.7%(+1.26)#138 | 4.3%(+1.73)#4,903 |
| 4. | 01854 | 5.9% | 4.7%(+1.17)#141 | 4.3%(+1.63)#5,026 |
1
Common Questions
What are the Top 3 Zip Codes with the Highest Percentage of Population with a Degree in Visual and Performing Arts in Lowell, MA?
Top 3 Zip Codes with the Highest Percentage of Population with a Degree in Visual and Performing Arts in Lowell, MA are:
What zip code has the Highest Percentage of Population with a Degree in Visual and Performing Arts in Lowell, MA?
01850 has the Highest Percentage of Population with a Degree in Visual and Performing Arts in Lowell, MA with 8.7%.
What is the Percentage of Population with a Degree in Visual and Performing Arts in Lowell, MA?
Percentage of Population with a Degree in Visual and Performing Arts in Lowell is 6.6%.
What is the Percentage of Population with a Degree in Visual and Performing Arts in Massachusetts?
Percentage of Population with a Degree in Visual and Performing Arts in Massachusetts is 4.7%.
What is the Percentage of Population with a Degree in Visual and Performing Arts in the United States?
Percentage of Population with a Degree in Visual and Performing Arts in the United States is 4.3%.