Zip Codes with the Highest Percentage of Population with a Degree in Visual and Performing Arts in Arlington, MA
RELATED REPORTS & OPTIONS
Visual and Performing Arts
Arlington
Compare Zip Codes
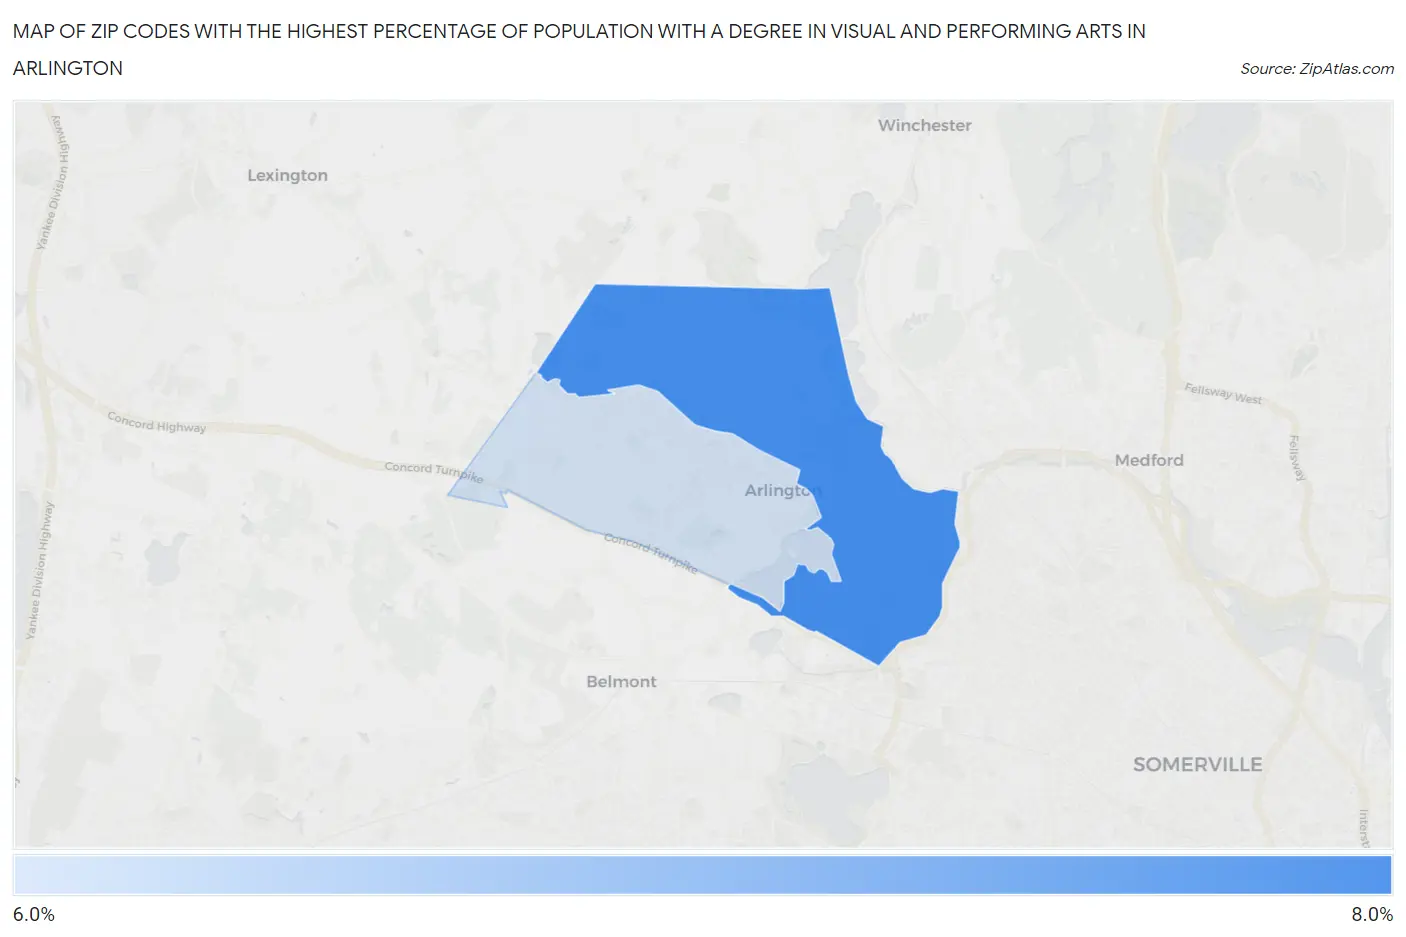
Map of Zip Codes with the Highest Percentage of Population with a Degree in Visual and Performing Arts in Arlington
6.8%
7.8%
Zip Codes with the Highest Percentage of Population with a Degree in Visual and Performing Arts in Arlington, MA
| Zip Code | % Graduates | vs State | vs National | |
| 1. | 02474 | 7.8% | 4.7%(+3.07)#64 | 4.3%(+3.53)#2,997 |
| 2. | 02476 | 6.8% | 4.7%(+2.10)#96 | 4.3%(+2.56)#3,870 |
1
Common Questions
What are the Top Zip Codes with the Highest Percentage of Population with a Degree in Visual and Performing Arts in Arlington, MA?
Top Zip Codes with the Highest Percentage of Population with a Degree in Visual and Performing Arts in Arlington, MA are:
What zip code has the Highest Percentage of Population with a Degree in Visual and Performing Arts in Arlington, MA?
02474 has the Highest Percentage of Population with a Degree in Visual and Performing Arts in Arlington, MA with 7.8%.
What is the Percentage of Population with a Degree in Visual and Performing Arts in Arlington, MA?
Percentage of Population with a Degree in Visual and Performing Arts in Arlington is 7.4%.
What is the Percentage of Population with a Degree in Visual and Performing Arts in Massachusetts?
Percentage of Population with a Degree in Visual and Performing Arts in Massachusetts is 4.7%.
What is the Percentage of Population with a Degree in Visual and Performing Arts in the United States?
Percentage of Population with a Degree in Visual and Performing Arts in the United States is 4.3%.