Zip Codes with the Highest Percentage of Population Employed in Installation, Maintenance & Repair in Fall River, MA
RELATED REPORTS & OPTIONS
Installation, Maintenance & Repair
Fall River
Compare Zip Codes
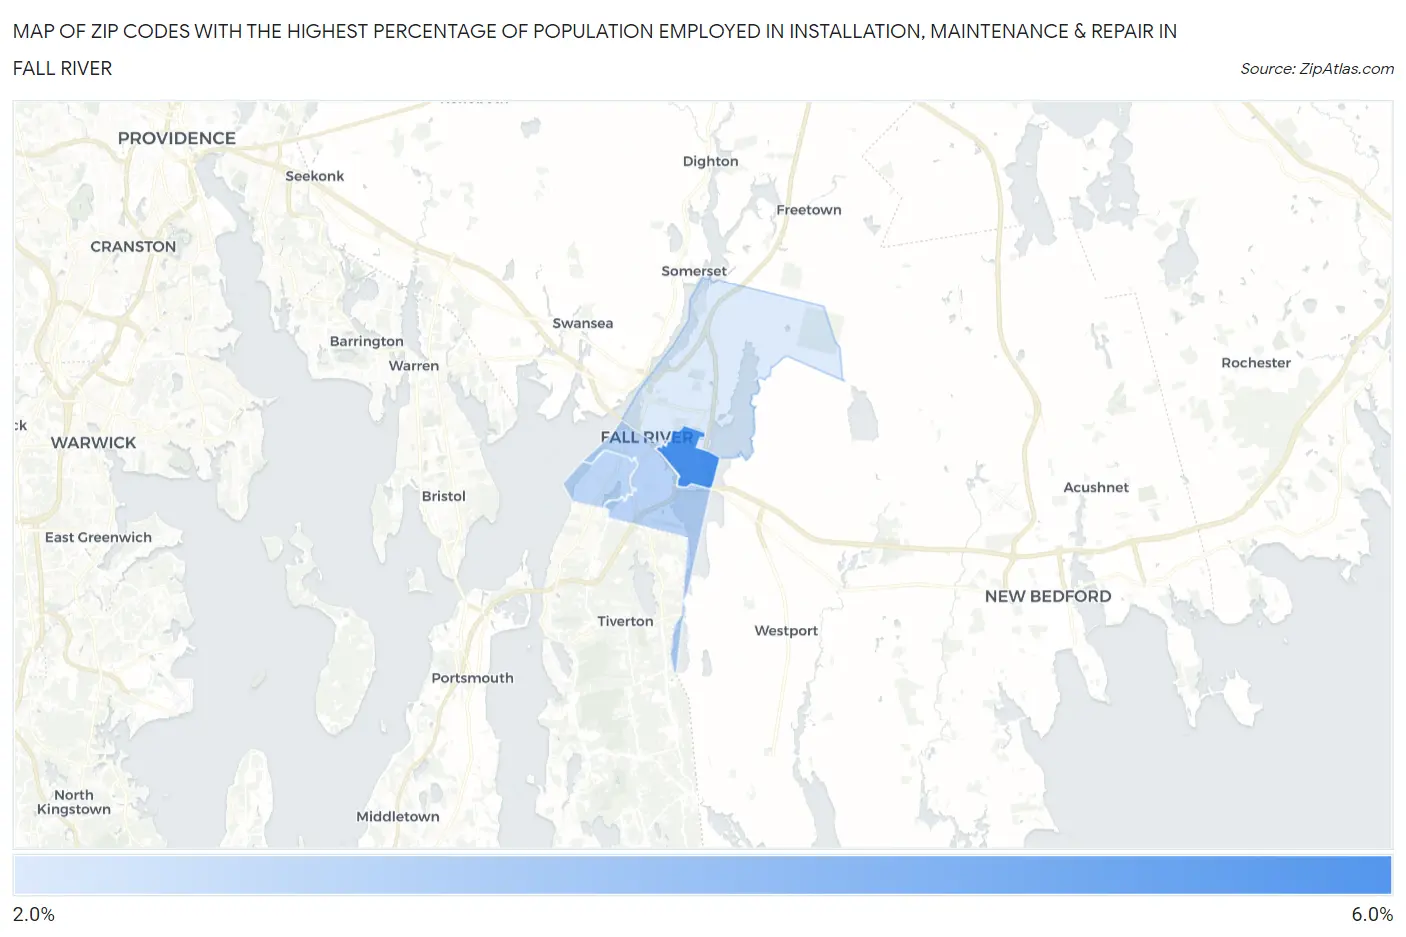
Map of Zip Codes with the Highest Percentage of Population Employed in Installation, Maintenance & Repair in Fall River
2.2%
5.2%
Zip Codes with the Highest Percentage of Population Employed in Installation, Maintenance & Repair in Fall River, MA
| Zip Code | % Employed | vs State | vs National | |
| 1. | 02723 | 5.2% | 2.2%(+2.98)#52 | 3.1%(+2.11)#8,154 |
| 2. | 02721 | 2.9% | 2.2%(+0.751)#168 | 3.1%(-0.121)#17,240 |
| 3. | 02724 | 2.8% | 2.2%(+0.654)#176 | 3.1%(-0.218)#17,759 |
| 4. | 02720 | 2.2% | 2.2%(+0.033)#240 | 3.1%(-0.839)#20,940 |
1
Common Questions
What are the Top 3 Zip Codes with the Highest Percentage of Population Employed in Installation, Maintenance & Repair in Fall River, MA?
Top 3 Zip Codes with the Highest Percentage of Population Employed in Installation, Maintenance & Repair in Fall River, MA are:
What zip code has the Highest Percentage of Population Employed in Installation, Maintenance & Repair in Fall River, MA?
02723 has the Highest Percentage of Population Employed in Installation, Maintenance & Repair in Fall River, MA with 5.2%.
What is the Percentage of Population Employed in Installation, Maintenance & Repair in Fall River, MA?
Percentage of Population Employed in Installation, Maintenance & Repair in Fall River is 3.1%.
What is the Percentage of Population Employed in Installation, Maintenance & Repair in Massachusetts?
Percentage of Population Employed in Installation, Maintenance & Repair in Massachusetts is 2.2%.
What is the Percentage of Population Employed in Installation, Maintenance & Repair in the United States?
Percentage of Population Employed in Installation, Maintenance & Repair in the United States is 3.1%.