Zip Codes with the Highest Percentage of Population Employed in Installation, Maintenance & Repair in Haverhill, MA
RELATED REPORTS & OPTIONS
Installation, Maintenance & Repair
Haverhill
Compare Zip Codes
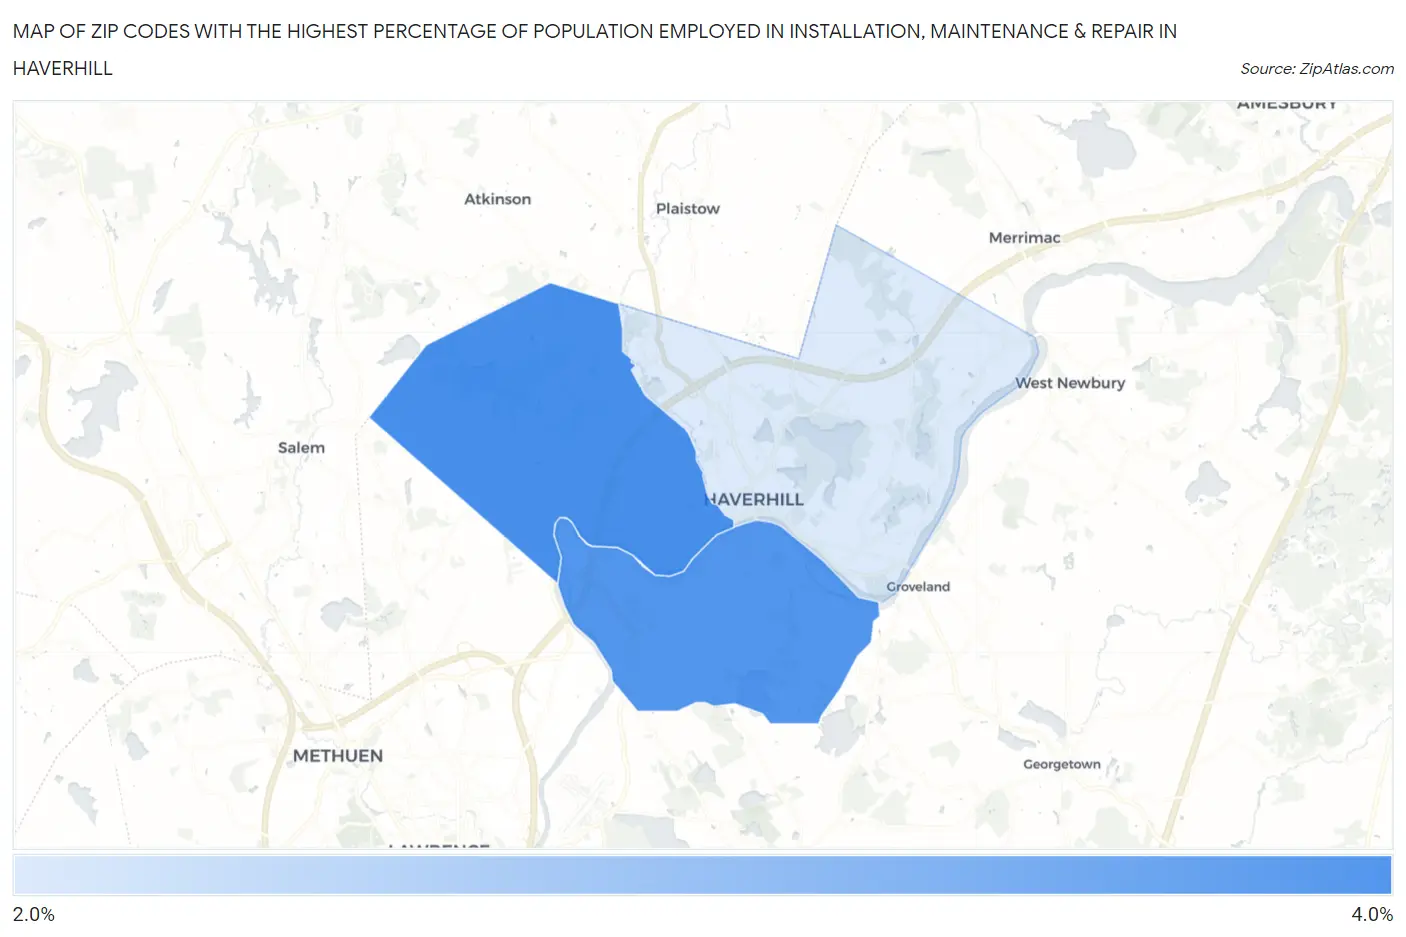
Map of Zip Codes with the Highest Percentage of Population Employed in Installation, Maintenance & Repair in Haverhill
2.9%
3.8%
Zip Codes with the Highest Percentage of Population Employed in Installation, Maintenance & Repair in Haverhill, MA
| Zip Code | % Employed | vs State | vs National | |
| 1. | 01832 | 3.8% | 2.2%(+1.58)#110 | 3.1%(+0.709)#13,346 |
| 2. | 01835 | 3.7% | 2.2%(+1.51)#117 | 3.1%(+0.638)#13,636 |
| 3. | 01830 | 2.9% | 2.2%(+0.699)#173 | 3.1%(-0.173)#17,522 |
1
Common Questions
What are the Top Zip Codes with the Highest Percentage of Population Employed in Installation, Maintenance & Repair in Haverhill, MA?
Top Zip Codes with the Highest Percentage of Population Employed in Installation, Maintenance & Repair in Haverhill, MA are:
What zip code has the Highest Percentage of Population Employed in Installation, Maintenance & Repair in Haverhill, MA?
01832 has the Highest Percentage of Population Employed in Installation, Maintenance & Repair in Haverhill, MA with 3.8%.
What is the Percentage of Population Employed in Installation, Maintenance & Repair in Haverhill, MA?
Percentage of Population Employed in Installation, Maintenance & Repair in Haverhill is 3.4%.
What is the Percentage of Population Employed in Installation, Maintenance & Repair in Massachusetts?
Percentage of Population Employed in Installation, Maintenance & Repair in Massachusetts is 2.2%.
What is the Percentage of Population Employed in Installation, Maintenance & Repair in the United States?
Percentage of Population Employed in Installation, Maintenance & Repair in the United States is 3.1%.