Zip Codes with the Highest Percentage of Population Employed in Installation, Maintenance & Repair in Quincy, MA
RELATED REPORTS & OPTIONS
Installation, Maintenance & Repair
Quincy
Compare Zip Codes
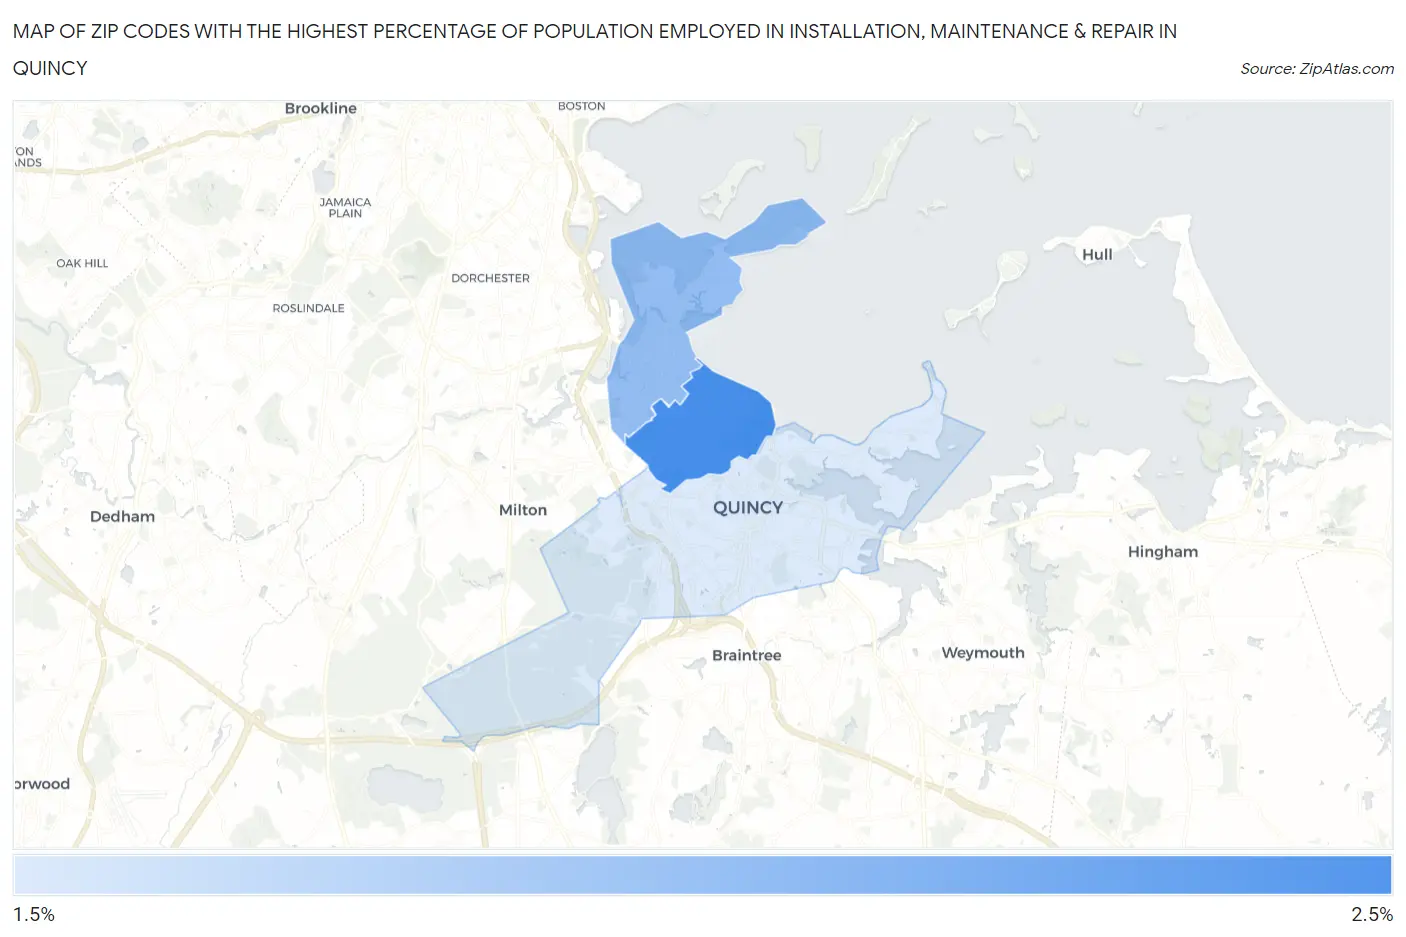
Map of Zip Codes with the Highest Percentage of Population Employed in Installation, Maintenance & Repair in Quincy
1.6%
2.4%
Zip Codes with the Highest Percentage of Population Employed in Installation, Maintenance & Repair in Quincy, MA
| Zip Code | % Employed | vs State | vs National | |
| 1. | 02170 | 2.4% | 2.2%(+0.243)#221 | 3.1%(-0.629)#19,870 |
| 2. | 02171 | 2.0% | 2.2%(-0.198)#264 | 3.1%(-1.07)#22,033 |
| 3. | 02169 | 1.6% | 2.2%(-0.634)#317 | 3.1%(-1.51)#23,913 |
1
Common Questions
What are the Top Zip Codes with the Highest Percentage of Population Employed in Installation, Maintenance & Repair in Quincy, MA?
Top Zip Codes with the Highest Percentage of Population Employed in Installation, Maintenance & Repair in Quincy, MA are:
What zip code has the Highest Percentage of Population Employed in Installation, Maintenance & Repair in Quincy, MA?
02170 has the Highest Percentage of Population Employed in Installation, Maintenance & Repair in Quincy, MA with 2.4%.
What is the Percentage of Population Employed in Installation, Maintenance & Repair in Quincy, MA?
Percentage of Population Employed in Installation, Maintenance & Repair in Quincy is 1.8%.
What is the Percentage of Population Employed in Installation, Maintenance & Repair in Massachusetts?
Percentage of Population Employed in Installation, Maintenance & Repair in Massachusetts is 2.2%.
What is the Percentage of Population Employed in Installation, Maintenance & Repair in the United States?
Percentage of Population Employed in Installation, Maintenance & Repair in the United States is 3.1%.