Zip Codes with the Highest Percentage of Population Employed in Installation, Maintenance & Repair in Peoria, IL
RELATED REPORTS & OPTIONS
Installation, Maintenance & Repair
Peoria
Compare Zip Codes
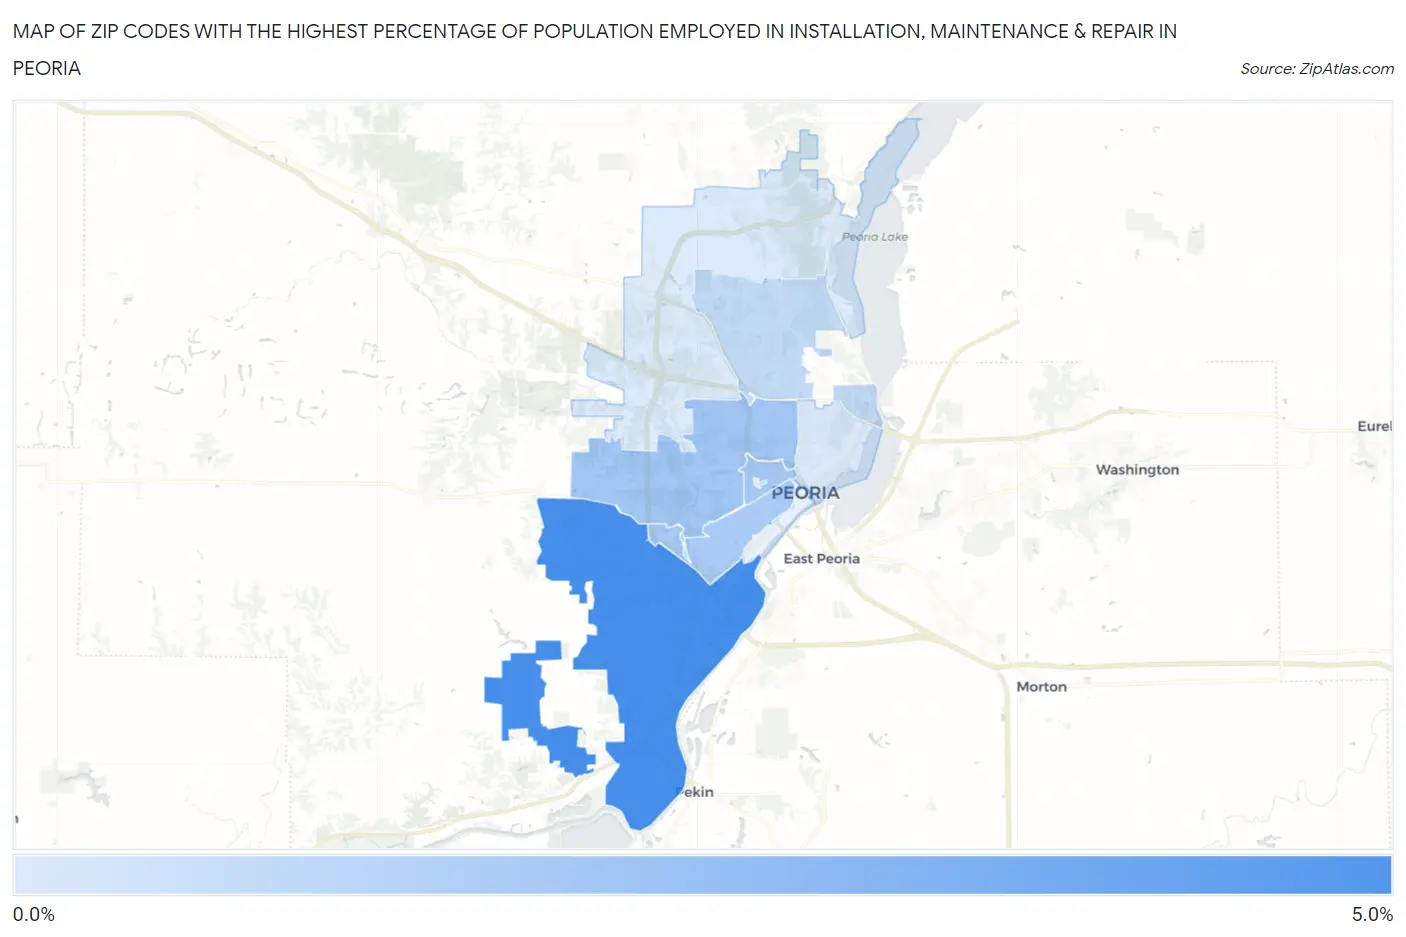
Map of Zip Codes with the Highest Percentage of Population Employed in Installation, Maintenance & Repair in Peoria
0.66%
4.0%
Zip Codes with the Highest Percentage of Population Employed in Installation, Maintenance & Repair in Peoria, IL
| Zip Code | % Employed | vs State | vs National | |
| 1. | 61607 | 4.0% | 2.7%(+1.28)#544 | 3.1%(+0.938)#12,334 |
| 2. | 61604 | 1.9% | 2.7%(-0.793)#991 | 3.1%(-1.13)#22,308 |
| 3. | 61606 | 1.9% | 2.7%(-0.867)#1,008 | 3.1%(-1.21)#22,604 |
| 4. | 61605 | 1.8% | 2.7%(-0.972)#1,031 | 3.1%(-1.31)#23,086 |
| 5. | 61614 | 1.2% | 2.7%(-1.52)#1,132 | 3.1%(-1.86)#25,216 |
| 6. | 61603 | 0.73% | 2.7%(-2.00)#1,194 | 3.1%(-2.34)#26,688 |
| 7. | 61615 | 0.66% | 2.7%(-2.07)#1,205 | 3.1%(-2.41)#26,885 |
1
Common Questions
What are the Top 5 Zip Codes with the Highest Percentage of Population Employed in Installation, Maintenance & Repair in Peoria, IL?
Top 5 Zip Codes with the Highest Percentage of Population Employed in Installation, Maintenance & Repair in Peoria, IL are:
What zip code has the Highest Percentage of Population Employed in Installation, Maintenance & Repair in Peoria, IL?
61607 has the Highest Percentage of Population Employed in Installation, Maintenance & Repair in Peoria, IL with 4.0%.
What is the Percentage of Population Employed in Installation, Maintenance & Repair in Peoria, IL?
Percentage of Population Employed in Installation, Maintenance & Repair in Peoria is 1.1%.
What is the Percentage of Population Employed in Installation, Maintenance & Repair in Illinois?
Percentage of Population Employed in Installation, Maintenance & Repair in Illinois is 2.7%.
What is the Percentage of Population Employed in Installation, Maintenance & Repair in the United States?
Percentage of Population Employed in Installation, Maintenance & Repair in the United States is 3.1%.