Zip Codes with the Highest Percentage of Population Employed in Installation, Maintenance & Repair in Quincy, IL
RELATED REPORTS & OPTIONS
Installation, Maintenance & Repair
Quincy
Compare Zip Codes
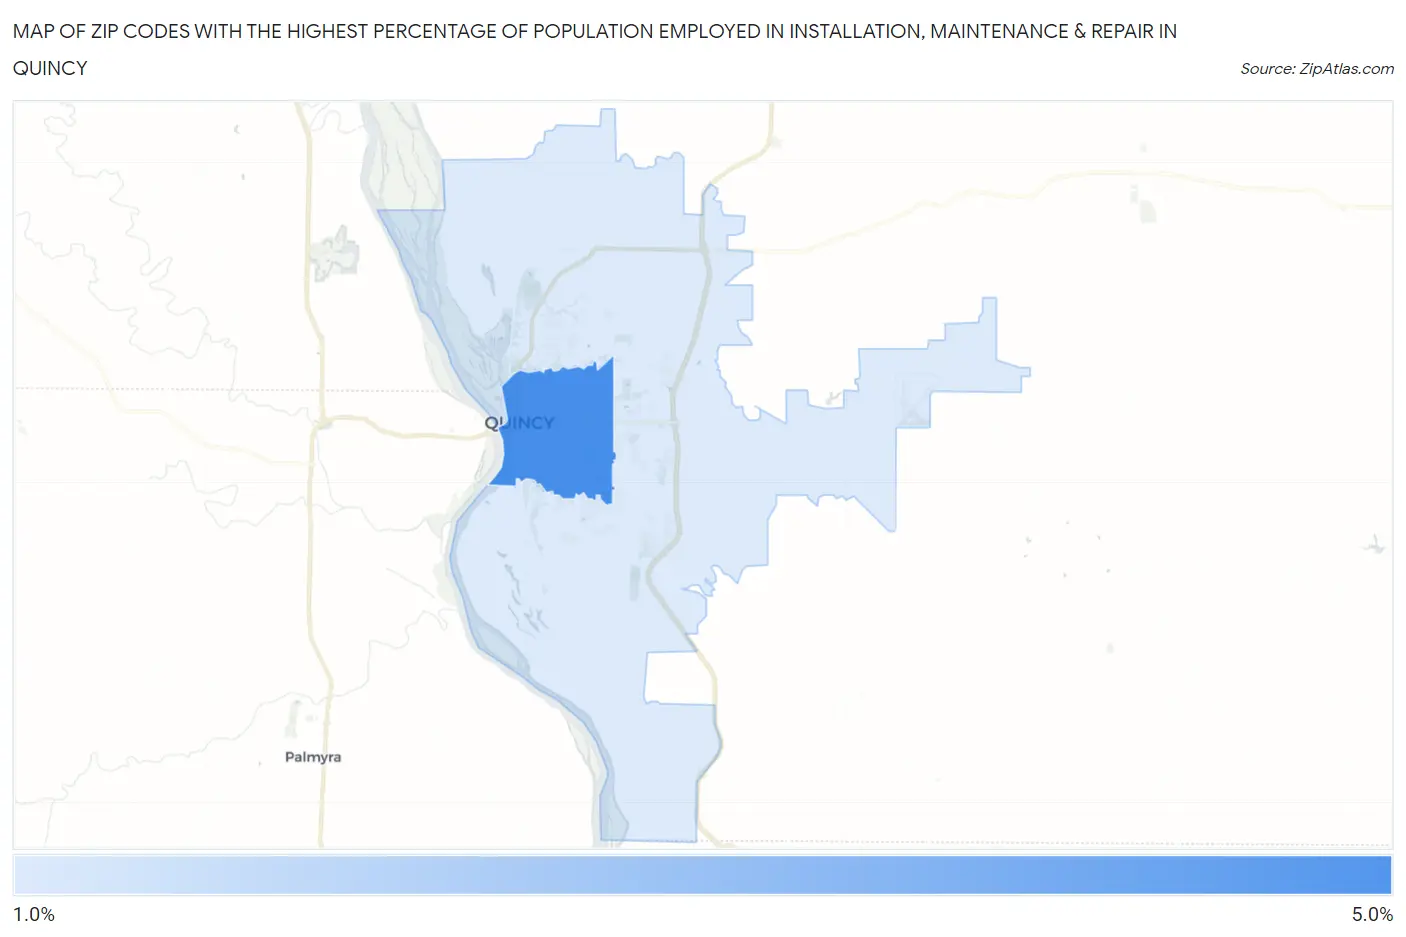
Map of Zip Codes with the Highest Percentage of Population Employed in Installation, Maintenance & Repair in Quincy
1.5%
4.4%
Zip Codes with the Highest Percentage of Population Employed in Installation, Maintenance & Repair in Quincy, IL
| Zip Code | % Employed | vs State | vs National | |
| 1. | 62301 | 4.4% | 2.7%(+1.69)#480 | 3.1%(+1.35)#10,686 |
| 2. | 62305 | 1.5% | 2.7%(-1.18)#1,073 | 3.1%(-1.52)#23,999 |
1
Common Questions
What are the Top Zip Codes with the Highest Percentage of Population Employed in Installation, Maintenance & Repair in Quincy, IL?
Top Zip Codes with the Highest Percentage of Population Employed in Installation, Maintenance & Repair in Quincy, IL are:
What zip code has the Highest Percentage of Population Employed in Installation, Maintenance & Repair in Quincy, IL?
62301 has the Highest Percentage of Population Employed in Installation, Maintenance & Repair in Quincy, IL with 4.4%.
What is the Percentage of Population Employed in Installation, Maintenance & Repair in Quincy, IL?
Percentage of Population Employed in Installation, Maintenance & Repair in Quincy is 3.8%.
What is the Percentage of Population Employed in Installation, Maintenance & Repair in Illinois?
Percentage of Population Employed in Installation, Maintenance & Repair in Illinois is 2.7%.
What is the Percentage of Population Employed in Installation, Maintenance & Repair in the United States?
Percentage of Population Employed in Installation, Maintenance & Repair in the United States is 3.1%.