Zip Codes with the Highest Percentage of Population Employed in Installation, Maintenance & Repair in Glenview, IL
RELATED REPORTS & OPTIONS
Installation, Maintenance & Repair
Glenview
Compare Zip Codes
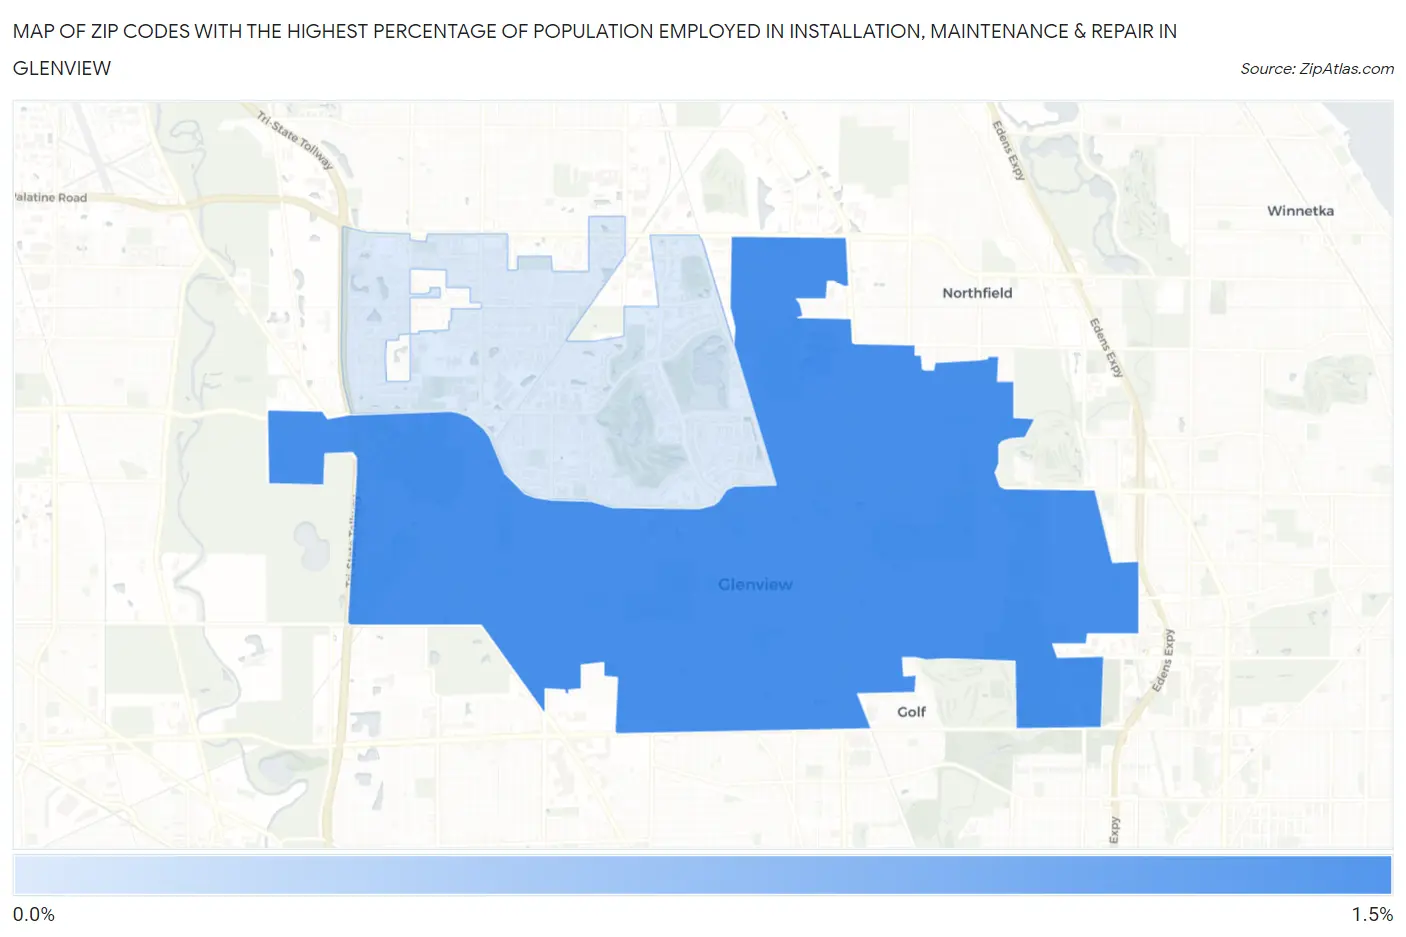
Map of Zip Codes with the Highest Percentage of Population Employed in Installation, Maintenance & Repair in Glenview
0.44%
1.4%
Zip Codes with the Highest Percentage of Population Employed in Installation, Maintenance & Repair in Glenview, IL
| Zip Code | % Employed | vs State | vs National | |
| 1. | 60025 | 1.4% | 2.7%(-1.33)#1,106 | 3.1%(-1.67)#24,546 |
| 2. | 60026 | 0.44% | 2.7%(-2.29)#1,225 | 3.1%(-2.63)#27,324 |
1
Common Questions
What are the Top Zip Codes with the Highest Percentage of Population Employed in Installation, Maintenance & Repair in Glenview, IL?
Top Zip Codes with the Highest Percentage of Population Employed in Installation, Maintenance & Repair in Glenview, IL are:
What zip code has the Highest Percentage of Population Employed in Installation, Maintenance & Repair in Glenview, IL?
60025 has the Highest Percentage of Population Employed in Installation, Maintenance & Repair in Glenview, IL with 1.4%.
What is the Percentage of Population Employed in Installation, Maintenance & Repair in Glenview, IL?
Percentage of Population Employed in Installation, Maintenance & Repair in Glenview is 1.1%.
What is the Percentage of Population Employed in Installation, Maintenance & Repair in Illinois?
Percentage of Population Employed in Installation, Maintenance & Repair in Illinois is 2.7%.
What is the Percentage of Population Employed in Installation, Maintenance & Repair in the United States?
Percentage of Population Employed in Installation, Maintenance & Repair in the United States is 3.1%.