Zip Codes with the Highest Percentage of Population Employed in Installation, Maintenance & Repair in Wheaton, IL
RELATED REPORTS & OPTIONS
Installation, Maintenance & Repair
Wheaton
Compare Zip Codes
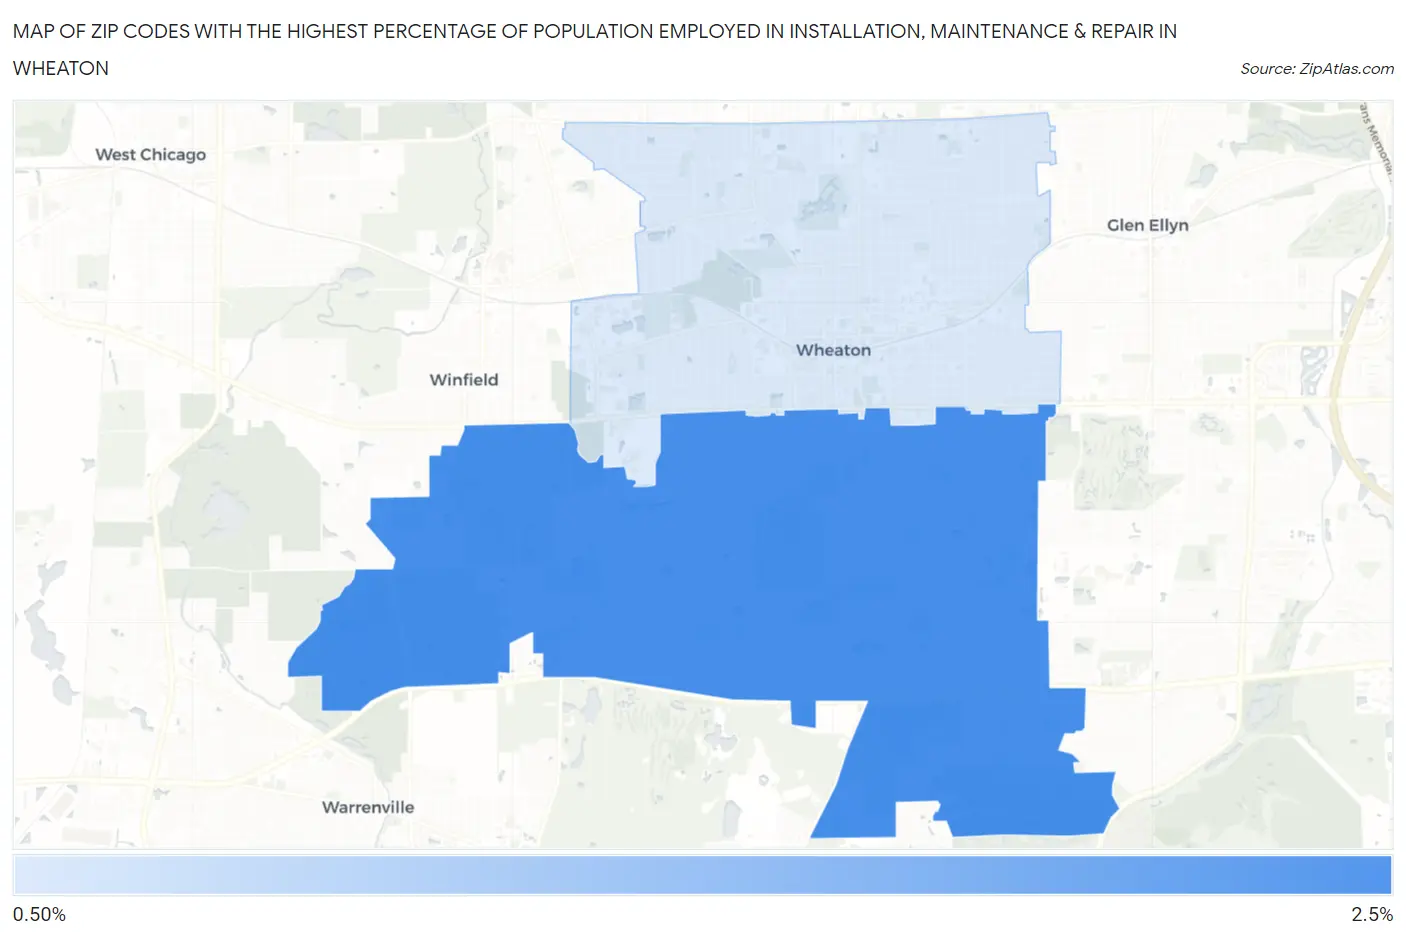
Map of Zip Codes with the Highest Percentage of Population Employed in Installation, Maintenance & Repair in Wheaton
1.4%
2.0%
Zip Codes with the Highest Percentage of Population Employed in Installation, Maintenance & Repair in Wheaton, IL
| Zip Code | % Employed | vs State | vs National | |
| 1. | 60189 | 2.0% | 2.7%(-0.711)#978 | 3.1%(-1.05)#21,935 |
| 2. | 60187 | 1.4% | 2.7%(-1.28)#1,094 | 3.1%(-1.62)#24,385 |
1
Common Questions
What are the Top Zip Codes with the Highest Percentage of Population Employed in Installation, Maintenance & Repair in Wheaton, IL?
Top Zip Codes with the Highest Percentage of Population Employed in Installation, Maintenance & Repair in Wheaton, IL are:
What zip code has the Highest Percentage of Population Employed in Installation, Maintenance & Repair in Wheaton, IL?
60189 has the Highest Percentage of Population Employed in Installation, Maintenance & Repair in Wheaton, IL with 2.0%.
What is the Percentage of Population Employed in Installation, Maintenance & Repair in Wheaton, IL?
Percentage of Population Employed in Installation, Maintenance & Repair in Wheaton is 1.5%.
What is the Percentage of Population Employed in Installation, Maintenance & Repair in Illinois?
Percentage of Population Employed in Installation, Maintenance & Repair in Illinois is 2.7%.
What is the Percentage of Population Employed in Installation, Maintenance & Repair in the United States?
Percentage of Population Employed in Installation, Maintenance & Repair in the United States is 3.1%.