Zip Codes with the Highest Percentage of Population Employed in Installation, Maintenance & Repair in Waukegan, IL
RELATED REPORTS & OPTIONS
Installation, Maintenance & Repair
Waukegan
Compare Zip Codes
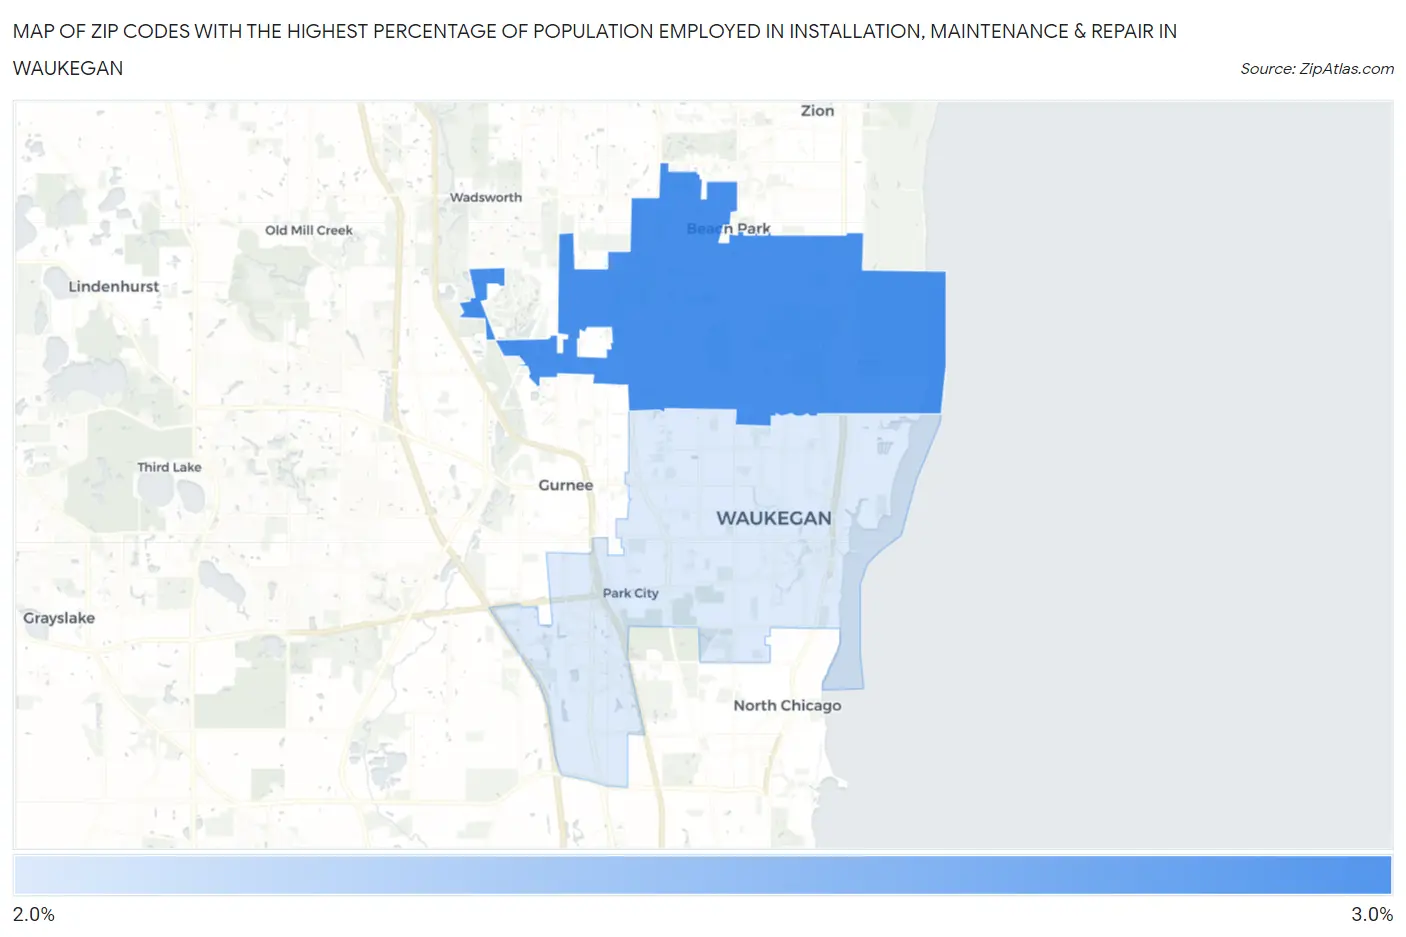
Map of Zip Codes with the Highest Percentage of Population Employed in Installation, Maintenance & Repair in Waukegan
2.6%
2.9%
Zip Codes with the Highest Percentage of Population Employed in Installation, Maintenance & Repair in Waukegan, IL
| Zip Code | % Employed | vs State | vs National | |
| 1. | 60087 | 2.9% | 2.7%(+0.159)#779 | 3.1%(-0.180)#17,562 |
| 2. | 60085 | 2.6% | 2.7%(-0.121)#845 | 3.1%(-0.460)#19,043 |
1
Common Questions
What are the Top Zip Codes with the Highest Percentage of Population Employed in Installation, Maintenance & Repair in Waukegan, IL?
Top Zip Codes with the Highest Percentage of Population Employed in Installation, Maintenance & Repair in Waukegan, IL are:
What zip code has the Highest Percentage of Population Employed in Installation, Maintenance & Repair in Waukegan, IL?
60087 has the Highest Percentage of Population Employed in Installation, Maintenance & Repair in Waukegan, IL with 2.9%.
What is the Percentage of Population Employed in Installation, Maintenance & Repair in Waukegan, IL?
Percentage of Population Employed in Installation, Maintenance & Repair in Waukegan is 2.5%.
What is the Percentage of Population Employed in Installation, Maintenance & Repair in Illinois?
Percentage of Population Employed in Installation, Maintenance & Repair in Illinois is 2.7%.
What is the Percentage of Population Employed in Installation, Maintenance & Repair in the United States?
Percentage of Population Employed in Installation, Maintenance & Repair in the United States is 3.1%.