Zip Codes with the Highest Percentage of Population Employed in Installation, Maintenance & Repair in Danville, IL
RELATED REPORTS & OPTIONS
Installation, Maintenance & Repair
Danville
Compare Zip Codes
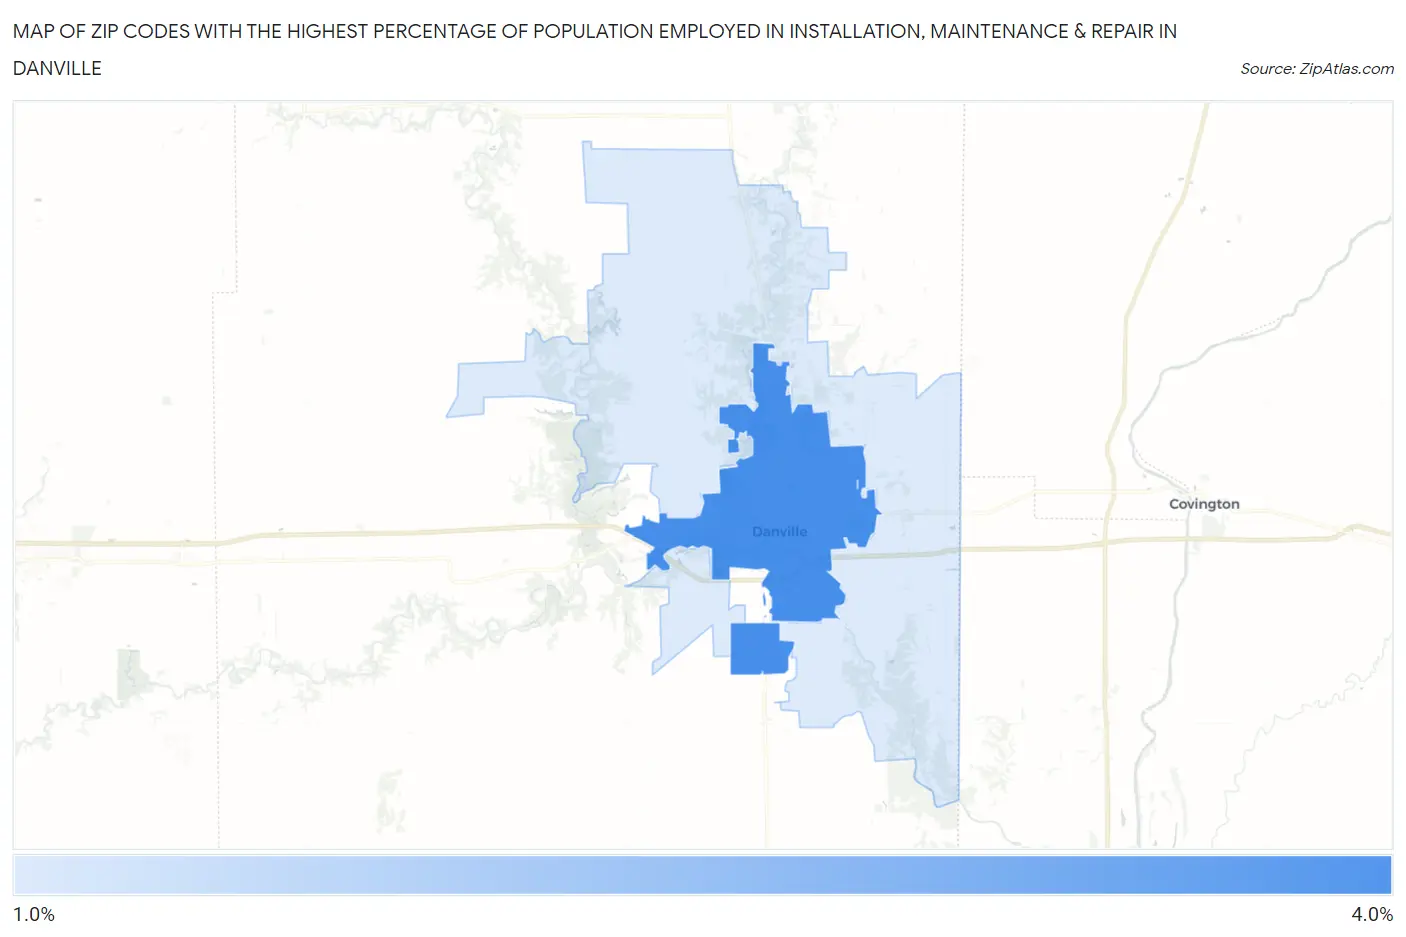
Map of Zip Codes with the Highest Percentage of Population Employed in Installation, Maintenance & Repair in Danville
1.9%
3.1%
Zip Codes with the Highest Percentage of Population Employed in Installation, Maintenance & Repair in Danville, IL
| Zip Code | % Employed | vs State | vs National | |
| 1. | 61832 | 3.1% | 2.7%(+0.388)#724 | 3.1%(+0.049)#16,444 |
| 2. | 61834 | 1.9% | 2.7%(-0.824)#997 | 3.1%(-1.16)#22,451 |
1
Common Questions
What are the Top Zip Codes with the Highest Percentage of Population Employed in Installation, Maintenance & Repair in Danville, IL?
Top Zip Codes with the Highest Percentage of Population Employed in Installation, Maintenance & Repair in Danville, IL are:
What zip code has the Highest Percentage of Population Employed in Installation, Maintenance & Repair in Danville, IL?
61832 has the Highest Percentage of Population Employed in Installation, Maintenance & Repair in Danville, IL with 3.1%.
What is the Percentage of Population Employed in Installation, Maintenance & Repair in Danville, IL?
Percentage of Population Employed in Installation, Maintenance & Repair in Danville is 2.4%.
What is the Percentage of Population Employed in Installation, Maintenance & Repair in Illinois?
Percentage of Population Employed in Installation, Maintenance & Repair in Illinois is 2.7%.
What is the Percentage of Population Employed in Installation, Maintenance & Repair in the United States?
Percentage of Population Employed in Installation, Maintenance & Repair in the United States is 3.1%.