De Witt, IL Map & Demographics
De Witt Map
De Witt Overview
$29,001
PER CAPITA INCOME
$79,583
AVG FAMILY INCOME
$61,500
AVG HOUSEHOLD INCOME
0.31
INEQUALITY / GINI INDEX
187
TOTAL POPULATION
90
MALE POPULATION
97
FEMALE POPULATION
92.78
MALES / 100 FEMALES
107.78
FEMALES / 100 MALES
49.7
MEDIAN AGE
3.3
AVG FAMILY SIZE
2.5
AVG HOUSEHOLD SIZE
88
LABOR FORCE [ PEOPLE ]
59.5%
PERCENT IN LABOR FORCE
5.7%
UNEMPLOYMENT RATE
Income in De Witt
Income Overview in De Witt
Per Capita Income in De Witt is $29,001, while median incomes of families and households are $79,583 and $61,500 respectively.
| Characteristic | Number | Measure |
| Per Capita Income | 187 | $29,001 |
| Median Family Income | 47 | $79,583 |
| Mean Family Income | 47 | $78,855 |
| Median Household Income | 74 | $61,500 |
| Mean Household Income | 74 | $68,931 |
| Income Deficit | 47 | $0 |
| Wage / Income Gap (%) | 187 | 0.00% |
| Wage / Income Gap ($) | 187 | 100.00¢ per $1 |
| Gini / Inequality Index | 187 | 0.31 |
Earnings by Sex in De Witt
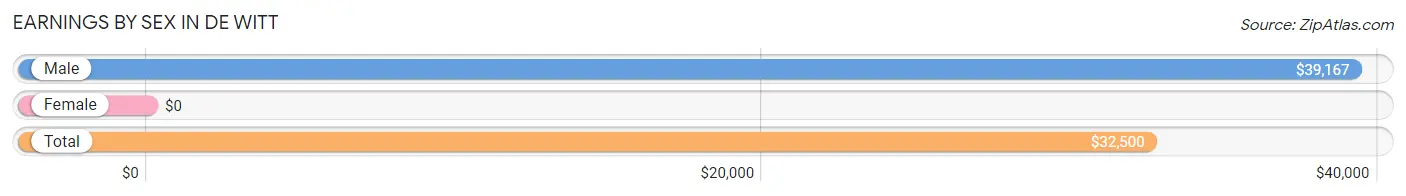
| Sex | Number | Average Earnings |
| Male | 56 (59.6%) | $39,167 |
| Female | 38 (40.4%) | $0 |
| Total | 94 (100.0%) | $32,500 |
Earnings by Sex by Income Bracket in De Witt
The most common earnings brackets in De Witt are $75,000 to $99,999 for men (17 | 30.4%) and $15,000 to $17,499 for women (15 | 39.5%).
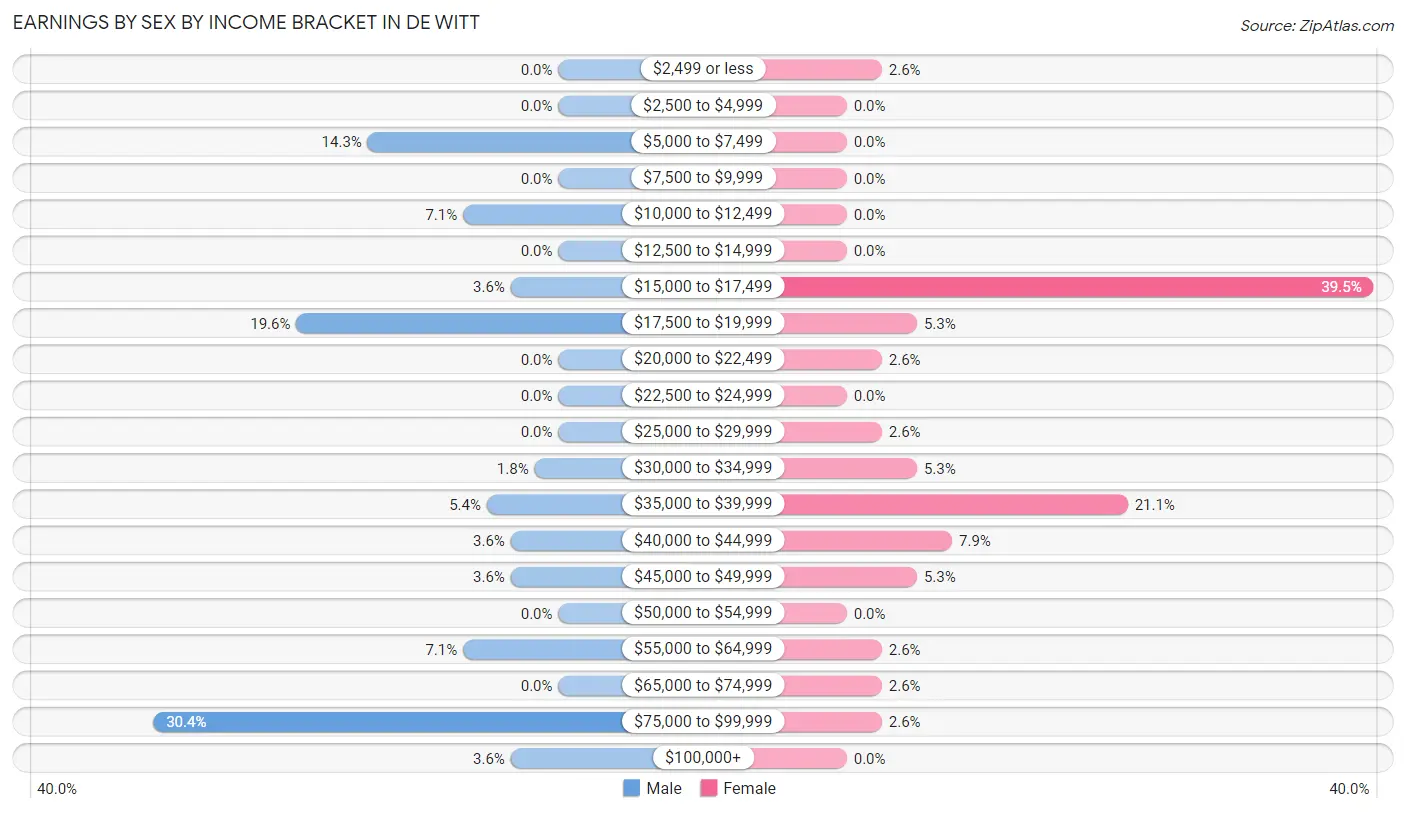
| Income | Male | Female |
| $2,499 or less | 0 (0.0%) | 1 (2.6%) |
| $2,500 to $4,999 | 0 (0.0%) | 0 (0.0%) |
| $5,000 to $7,499 | 8 (14.3%) | 0 (0.0%) |
| $7,500 to $9,999 | 0 (0.0%) | 0 (0.0%) |
| $10,000 to $12,499 | 4 (7.1%) | 0 (0.0%) |
| $12,500 to $14,999 | 0 (0.0%) | 0 (0.0%) |
| $15,000 to $17,499 | 2 (3.6%) | 15 (39.5%) |
| $17,500 to $19,999 | 11 (19.6%) | 2 (5.3%) |
| $20,000 to $22,499 | 0 (0.0%) | 1 (2.6%) |
| $22,500 to $24,999 | 0 (0.0%) | 0 (0.0%) |
| $25,000 to $29,999 | 0 (0.0%) | 1 (2.6%) |
| $30,000 to $34,999 | 1 (1.8%) | 2 (5.3%) |
| $35,000 to $39,999 | 3 (5.4%) | 8 (21.0%) |
| $40,000 to $44,999 | 2 (3.6%) | 3 (7.9%) |
| $45,000 to $49,999 | 2 (3.6%) | 2 (5.3%) |
| $50,000 to $54,999 | 0 (0.0%) | 0 (0.0%) |
| $55,000 to $64,999 | 4 (7.1%) | 1 (2.6%) |
| $65,000 to $74,999 | 0 (0.0%) | 1 (2.6%) |
| $75,000 to $99,999 | 17 (30.4%) | 1 (2.6%) |
| $100,000+ | 2 (3.6%) | 0 (0.0%) |
| Total | 56 (100.0%) | 38 (100.0%) |
Earnings by Sex by Educational Attainment in De Witt
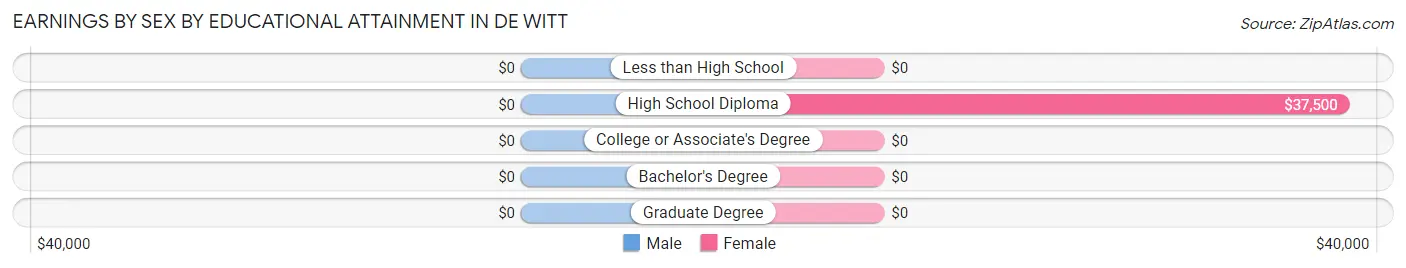
| Educational Attainment | Male Income | Female Income |
| Less than High School | - | - |
| High School Diploma | - | - |
| College or Associate's Degree | - | - |
| Bachelor's Degree | - | - |
| Graduate Degree | - | - |
| Total | $44,375 | $0 |
Family Income in De Witt
Family Income Brackets in De Witt
According to the De Witt family income data, there are 18 families falling into the $100,000 to $149,999 income range, which is the most common income bracket and makes up 38.3% of all families.
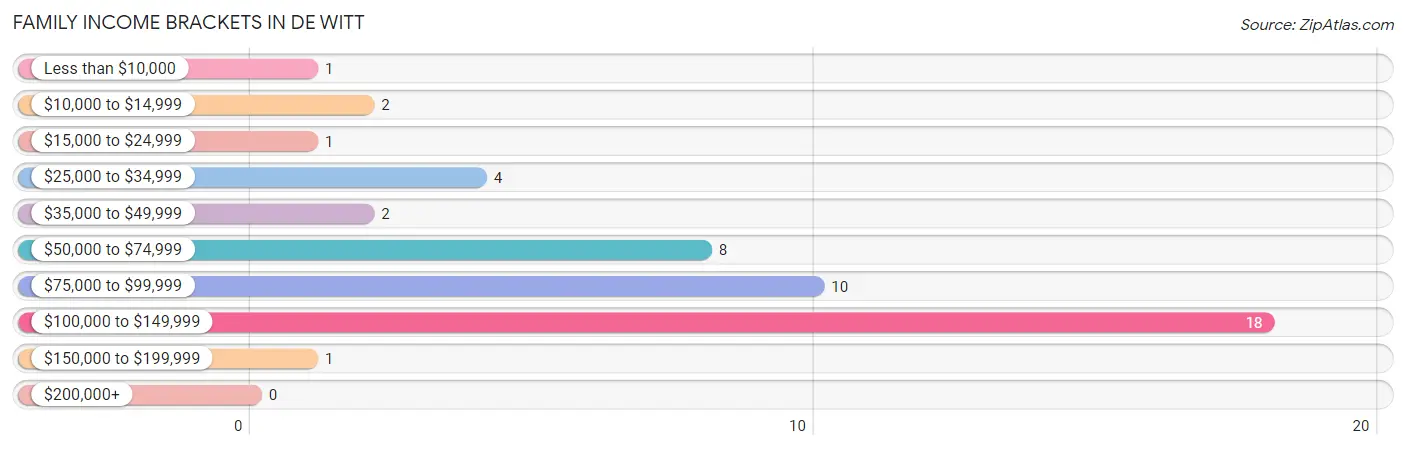
| Income Bracket | # Families | % Families |
| Less than $10,000 | 1 | 2.1% |
| $10,000 to $14,999 | 2 | 4.3% |
| $15,000 to $24,999 | 1 | 2.1% |
| $25,000 to $34,999 | 4 | 8.5% |
| $35,000 to $49,999 | 2 | 4.3% |
| $50,000 to $74,999 | 8 | 17.0% |
| $75,000 to $99,999 | 10 | 21.3% |
| $100,000 to $149,999 | 18 | 38.3% |
| $150,000 to $199,999 | 1 | 2.1% |
| $200,000+ | 0 | 0.0% |
Family Income by Famaliy Size in De Witt
4-person families (16 | 34.0%) account for the highest median family income in De Witt with $108,462 per family, while 2-person families (24 | 51.1%) have the highest median income of $33,750 per family member.
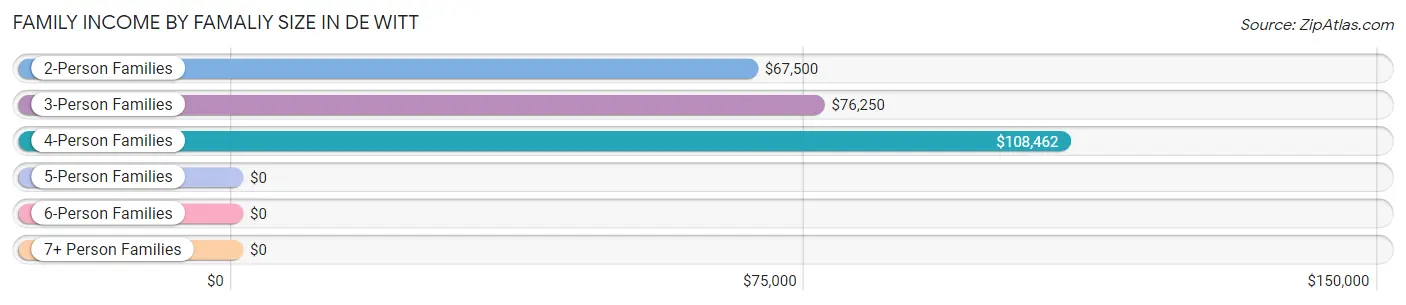
| Income Bracket | # Families | Median Income |
| 2-Person Families | 24 (51.1%) | $67,500 |
| 3-Person Families | 7 (14.9%) | $76,250 |
| 4-Person Families | 16 (34.0%) | $108,462 |
| 5-Person Families | 0 (0.0%) | $0 |
| 6-Person Families | 0 (0.0%) | $0 |
| 7+ Person Families | 0 (0.0%) | $0 |
| Total | 47 (100.0%) | $79,583 |
Family Income by Number of Earners in De Witt
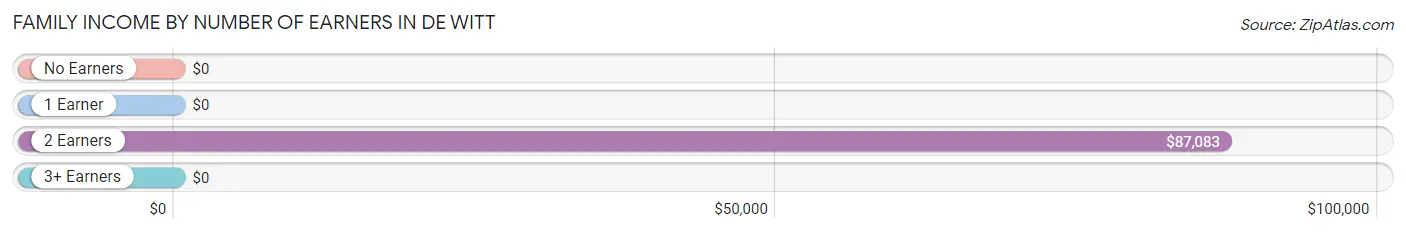
| Number of Earners | # Families | Median Income |
| No Earners | 11 (23.4%) | $0 |
| 1 Earner | 3 (6.4%) | $0 |
| 2 Earners | 31 (66.0%) | $87,083 |
| 3+ Earners | 2 (4.3%) | $0 |
| Total | 47 (100.0%) | $79,583 |
Household Income in De Witt
Household Income Brackets in De Witt
With 19 households falling in the category, the $100,000 to $149,999 income range is the most frequent in De Witt, accounting for 25.7% of all households. In contrast, only 1 households (1.3%) fall into the less than $10,000 income bracket, making it the least populous group.
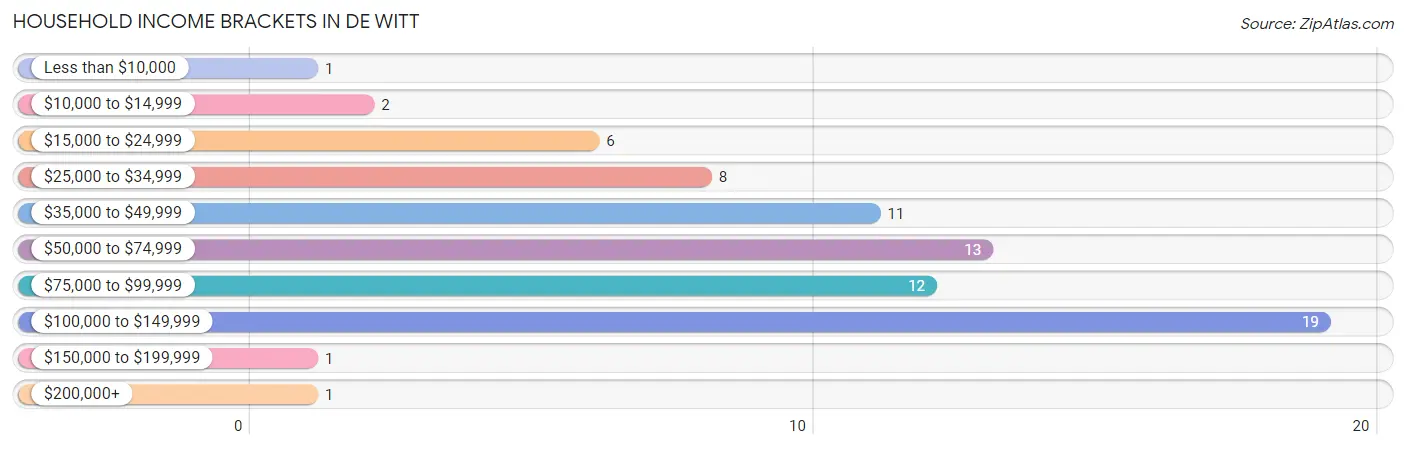
| Income Bracket | # Households | % Households |
| Less than $10,000 | 1 | 1.4% |
| $10,000 to $14,999 | 2 | 2.7% |
| $15,000 to $24,999 | 6 | 8.1% |
| $25,000 to $34,999 | 8 | 10.8% |
| $35,000 to $49,999 | 11 | 14.9% |
| $50,000 to $74,999 | 13 | 17.6% |
| $75,000 to $99,999 | 12 | 16.2% |
| $100,000 to $149,999 | 19 | 25.7% |
| $150,000 to $199,999 | 1 | 1.4% |
| $200,000+ | 1 | 1.4% |
Household Income by Householder Age in De Witt
The median household income in De Witt is $61,500, with the highest median household income of $79,583 found in the 45 to 64 years age bracket for the primary householder. A total of 43 households (58.1%) fall into this category. Meanwhile, the 15 to 24 years age bracket for the primary householder has the lowest median household income of $0, with 1 households (1.3%) in this group.
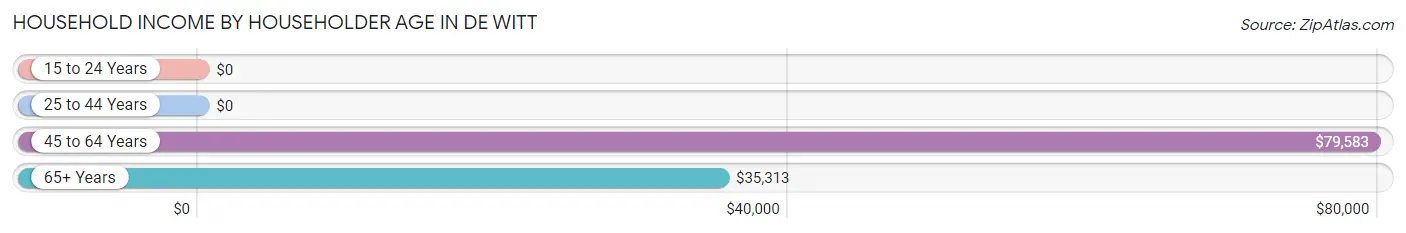
| Income Bracket | # Households | Median Income |
| 15 to 24 Years | 1 (1.3%) | $0 |
| 25 to 44 Years | 3 (4.1%) | $0 |
| 45 to 64 Years | 43 (58.1%) | $79,583 |
| 65+ Years | 27 (36.5%) | $35,313 |
| Total | 74 (100.0%) | $61,500 |
Poverty in De Witt
Income Below Poverty by Sex and Age in De Witt
With 11.1% poverty level for males and 8.3% for females among the residents of De Witt, 12 to 14 year old males and 12 to 14 year old females are the most vulnerable to poverty, with 2 males (100.0%) and 2 females (100.0%) in their respective age groups living below the poverty level.
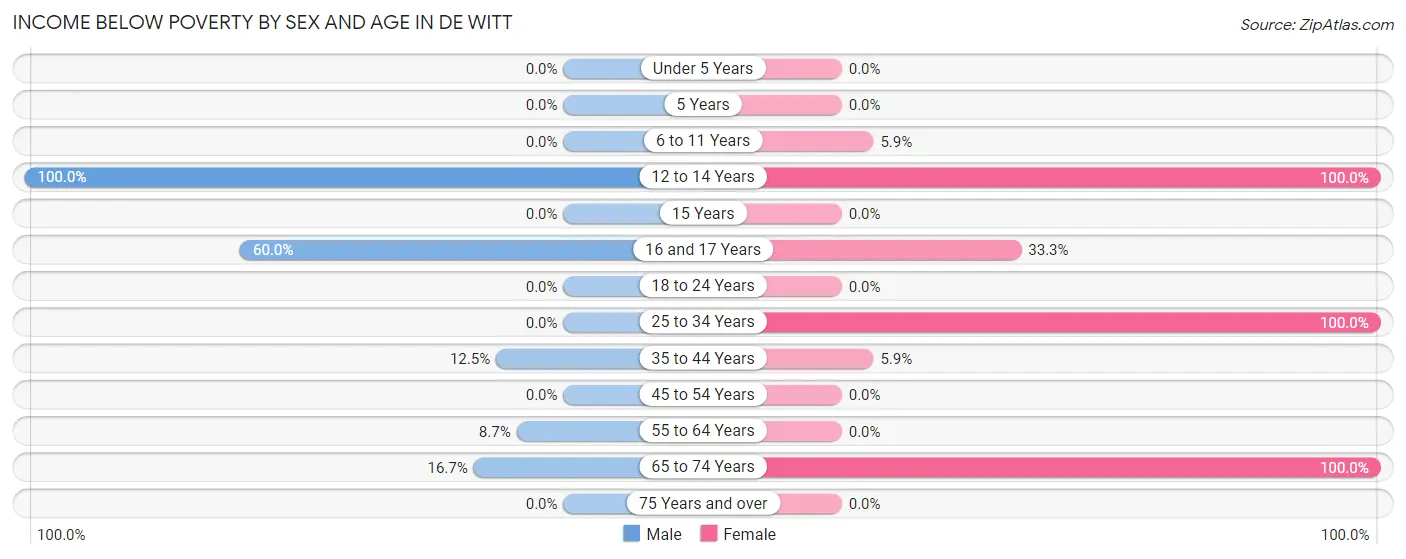
| Age Bracket | Male | Female |
| Under 5 Years | 0 (0.0%) | 0 (0.0%) |
| 5 Years | 0 (0.0%) | 0 (0.0%) |
| 6 to 11 Years | 0 (0.0%) | 1 (5.9%) |
| 12 to 14 Years | 2 (100.0%) | 2 (100.0%) |
| 15 Years | 0 (0.0%) | 0 (0.0%) |
| 16 and 17 Years | 3 (60.0%) | 1 (33.3%) |
| 18 to 24 Years | 0 (0.0%) | 0 (0.0%) |
| 25 to 34 Years | 0 (0.0%) | 1 (100.0%) |
| 35 to 44 Years | 1 (12.5%) | 1 (5.9%) |
| 45 to 54 Years | 0 (0.0%) | 0 (0.0%) |
| 55 to 64 Years | 2 (8.7%) | 0 (0.0%) |
| 65 to 74 Years | 2 (16.7%) | 2 (100.0%) |
| 75 Years and over | 0 (0.0%) | 0 (0.0%) |
| Total | 10 (11.1%) | 8 (8.3%) |
Income Above Poverty by Sex and Age in De Witt
According to the poverty statistics in De Witt, males aged 18 to 24 years and females aged 5 years are the age groups that are most secure financially, with 100.0% of males and 100.0% of females in these age groups living above the poverty line.
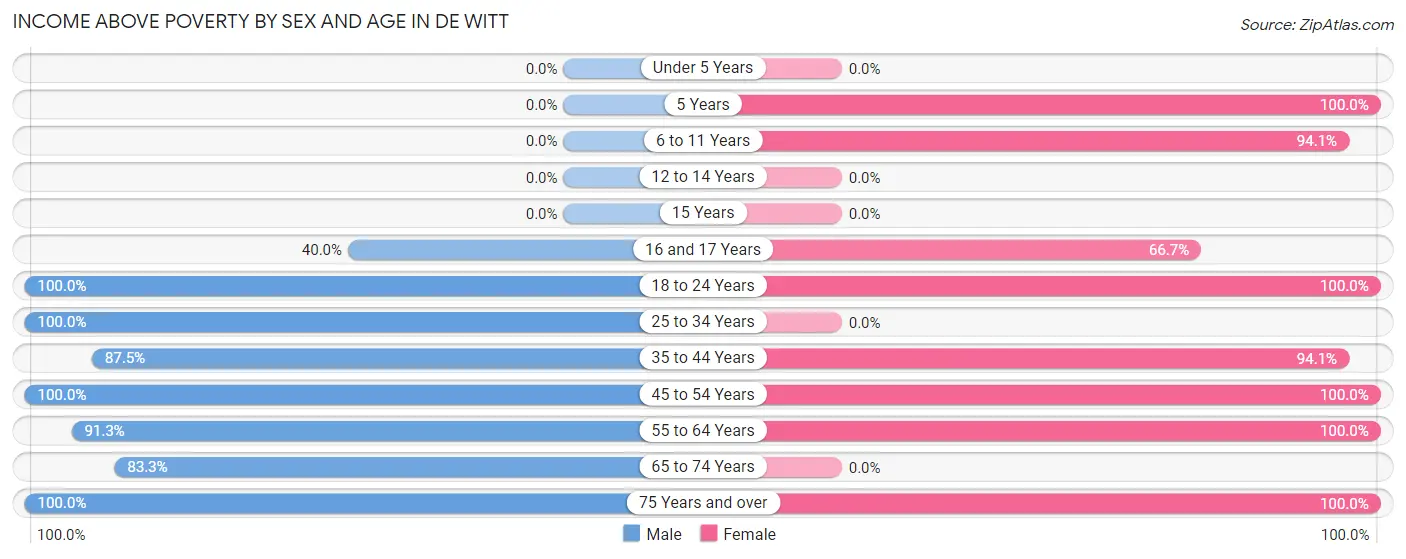
| Age Bracket | Male | Female |
| Under 5 Years | 0 (0.0%) | 0 (0.0%) |
| 5 Years | 0 (0.0%) | 18 (100.0%) |
| 6 to 11 Years | 0 (0.0%) | 16 (94.1%) |
| 12 to 14 Years | 0 (0.0%) | 0 (0.0%) |
| 15 Years | 0 (0.0%) | 0 (0.0%) |
| 16 and 17 Years | 2 (40.0%) | 2 (66.7%) |
| 18 to 24 Years | 3 (100.0%) | 2 (100.0%) |
| 25 to 34 Years | 1 (100.0%) | 0 (0.0%) |
| 35 to 44 Years | 7 (87.5%) | 16 (94.1%) |
| 45 to 54 Years | 26 (100.0%) | 8 (100.0%) |
| 55 to 64 Years | 21 (91.3%) | 17 (100.0%) |
| 65 to 74 Years | 10 (83.3%) | 0 (0.0%) |
| 75 Years and over | 10 (100.0%) | 10 (100.0%) |
| Total | 80 (88.9%) | 89 (91.7%) |
Income Below Poverty Among Married-Couple Families in De Witt
The poverty statistics for married-couple families in De Witt show that 7.9% or 3 of the total 38 families live below the poverty line. Families with 1 or 2 children have the highest poverty rate of 11.1%, comprising of 2 families. On the other hand, families with no children have the lowest poverty rate of 5.0%, which includes 1 families.
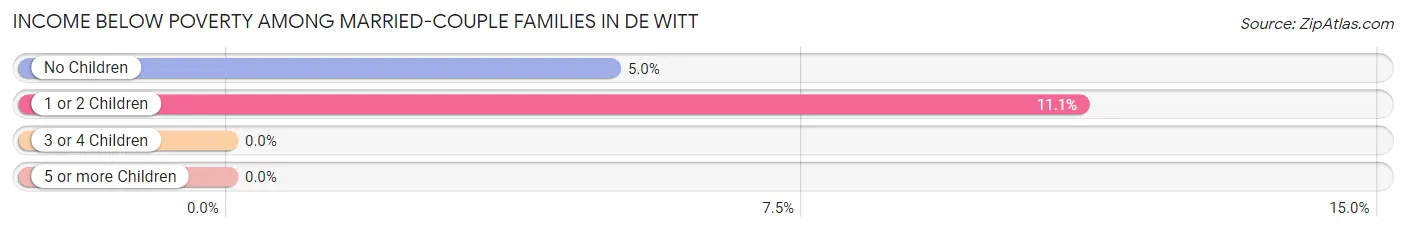
| Children | Above Poverty | Below Poverty |
| No Children | 19 (95.0%) | 1 (5.0%) |
| 1 or 2 Children | 16 (88.9%) | 2 (11.1%) |
| 3 or 4 Children | 0 (0.0%) | 0 (0.0%) |
| 5 or more Children | 0 (0.0%) | 0 (0.0%) |
| Total | 35 (92.1%) | 3 (7.9%) |
Income Below Poverty Among Single-Parent Households in De Witt
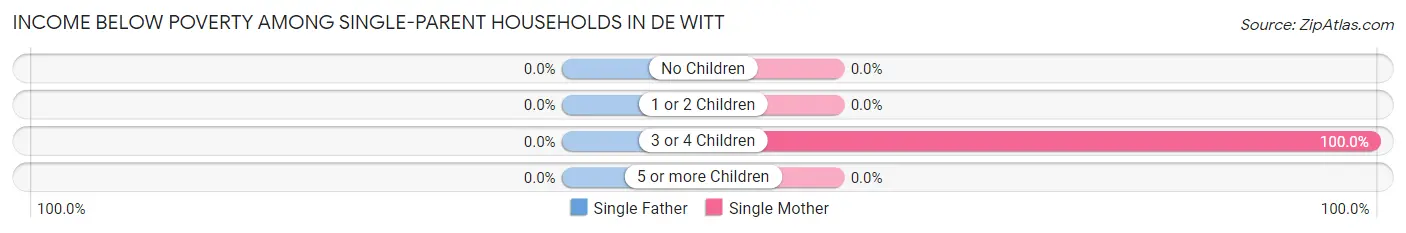
| Children | Single Father | Single Mother |
| No Children | 0 (0.0%) | 0 (0.0%) |
| 1 or 2 Children | 0 (0.0%) | 0 (0.0%) |
| 3 or 4 Children | 0 (0.0%) | 1 (100.0%) |
| 5 or more Children | 0 (0.0%) | 0 (0.0%) |
| Total | 0 (0.0%) | 1 (12.5%) |
Income Below Poverty Among Married-Couple vs Single-Parent Households in De Witt
The poverty data for De Witt shows that 3 of the married-couple family households (7.9%) and 1 of the single-parent households (11.1%) are living below the poverty level. Within the married-couple family households, those with 1 or 2 children have the highest poverty rate, with 2 households (11.1%) falling below the poverty line. Among the single-parent households, those with 3 or 4 children have the highest poverty rate, with 1 household (100.0%) living below poverty.
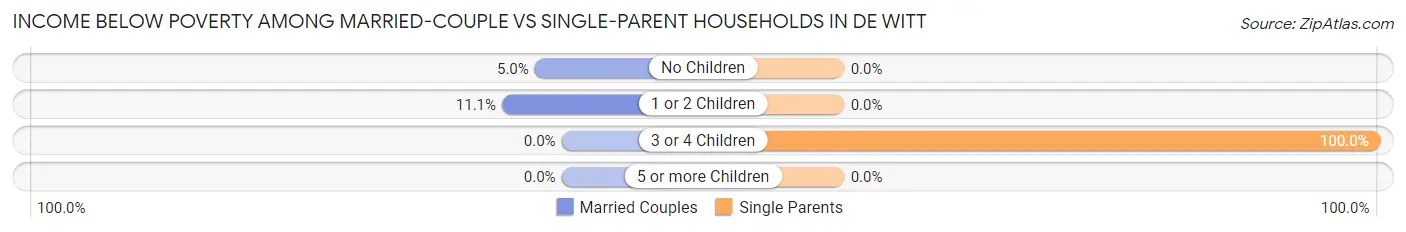
| Children | Married-Couple Families | Single-Parent Households |
| No Children | 1 (5.0%) | 0 (0.0%) |
| 1 or 2 Children | 2 (11.1%) | 0 (0.0%) |
| 3 or 4 Children | 0 (0.0%) | 1 (100.0%) |
| 5 or more Children | 0 (0.0%) | 0 (0.0%) |
| Total | 3 (7.9%) | 1 (11.1%) |
Race in De Witt
The most populous races in De Witt are White / Caucasian (184 | 98.4%), Asian (1 | 0.5%), and Black / African American (1 | 0.5%).
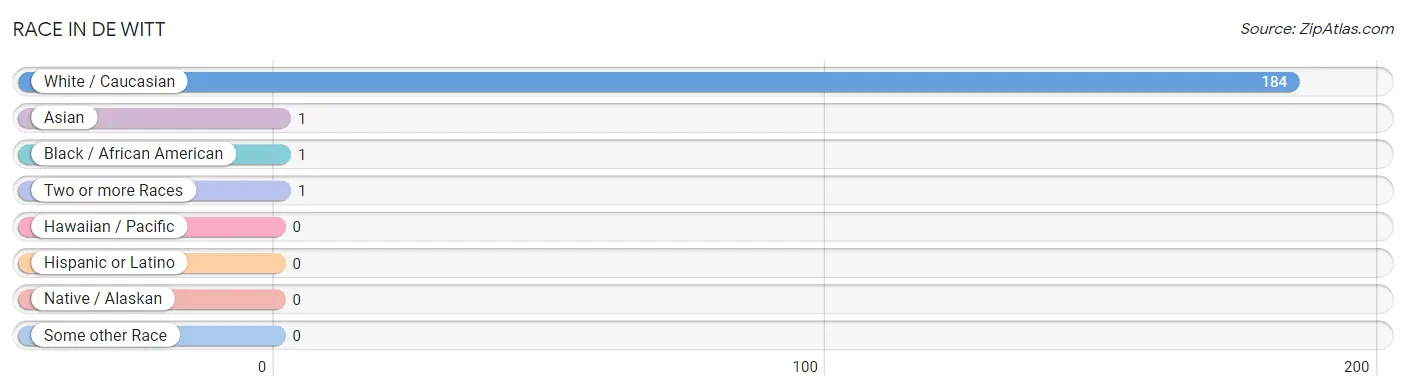
| Race | # Population | % Population |
| Asian | 1 | 0.5% |
| Black / African American | 1 | 0.5% |
| Hawaiian / Pacific | 0 | 0.0% |
| Hispanic or Latino | 0 | 0.0% |
| Native / Alaskan | 0 | 0.0% |
| White / Caucasian | 184 | 98.4% |
| Two or more Races | 1 | 0.5% |
| Some other Race | 0 | 0.0% |
| Total | 187 | 100.0% |
Ancestry in De Witt
The most populous ancestries reported in De Witt are German (39 | 20.9%), English (20 | 10.7%), American (18 | 9.6%), Polish (16 | 8.6%), and Irish (10 | 5.3%), together accounting for 55.1% of all De Witt residents.
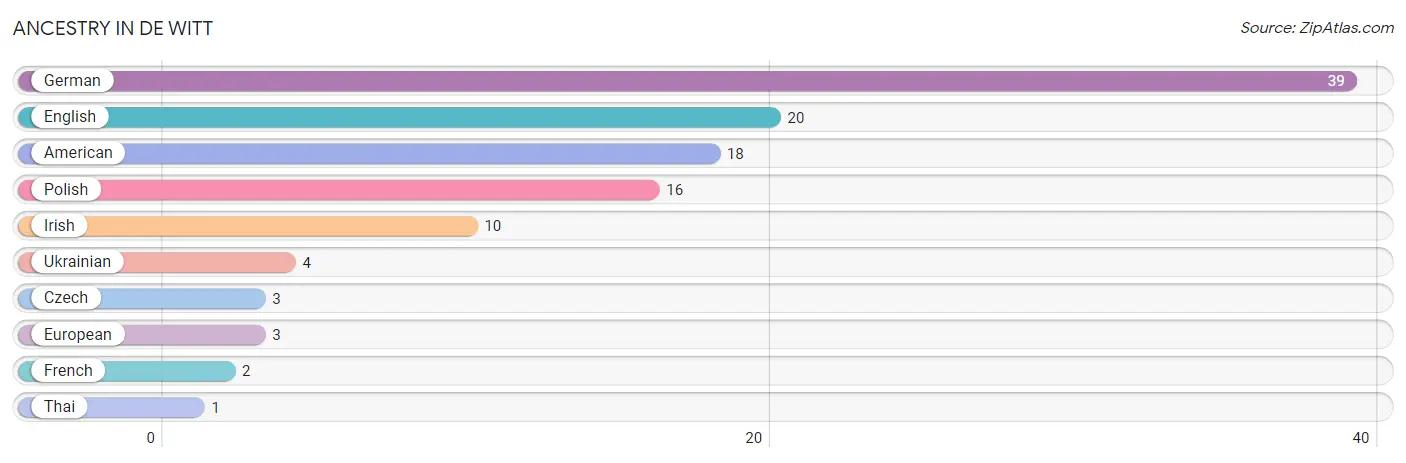
| Ancestry | # Population | % Population |
| American | 18 | 9.6% |
| Czech | 3 | 1.6% |
| English | 20 | 10.7% |
| European | 3 | 1.6% |
| French | 2 | 1.1% |
| German | 39 | 20.9% |
| Irish | 10 | 5.3% |
| Polish | 16 | 8.6% |
| Thai | 1 | 0.5% |
| Ukrainian | 4 | 2.1% | View All 10 Rows |
Immigrants in De Witt
The most numerous immigrant groups reported in De Witt came from Asia (1 | 0.5%), India (1 | 0.5%), and South Central Asia (1 | 0.5%), together accounting for 1.6% of all De Witt residents.
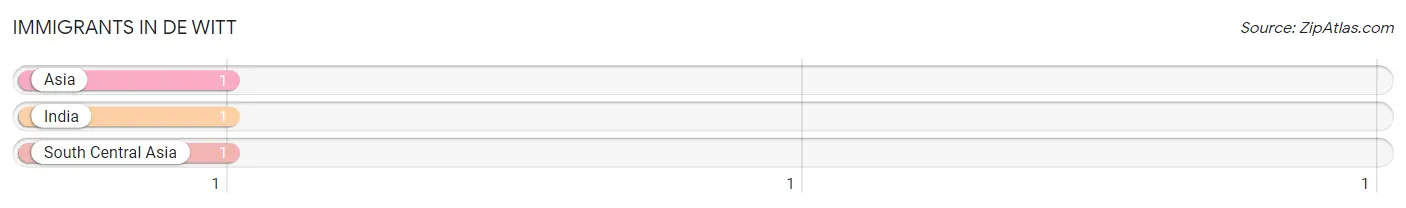
| Immigration Origin | # Population | % Population |
| Asia | 1 | 0.5% |
| India | 1 | 0.5% |
| South Central Asia | 1 | 0.5% | View All 3 Rows |
Sex and Age in De Witt
Sex and Age in De Witt
The most populous age groups in De Witt are 45 to 49 Years (18 | 20.0%) for men and 5 to 9 Years (35 | 36.1%) for women.
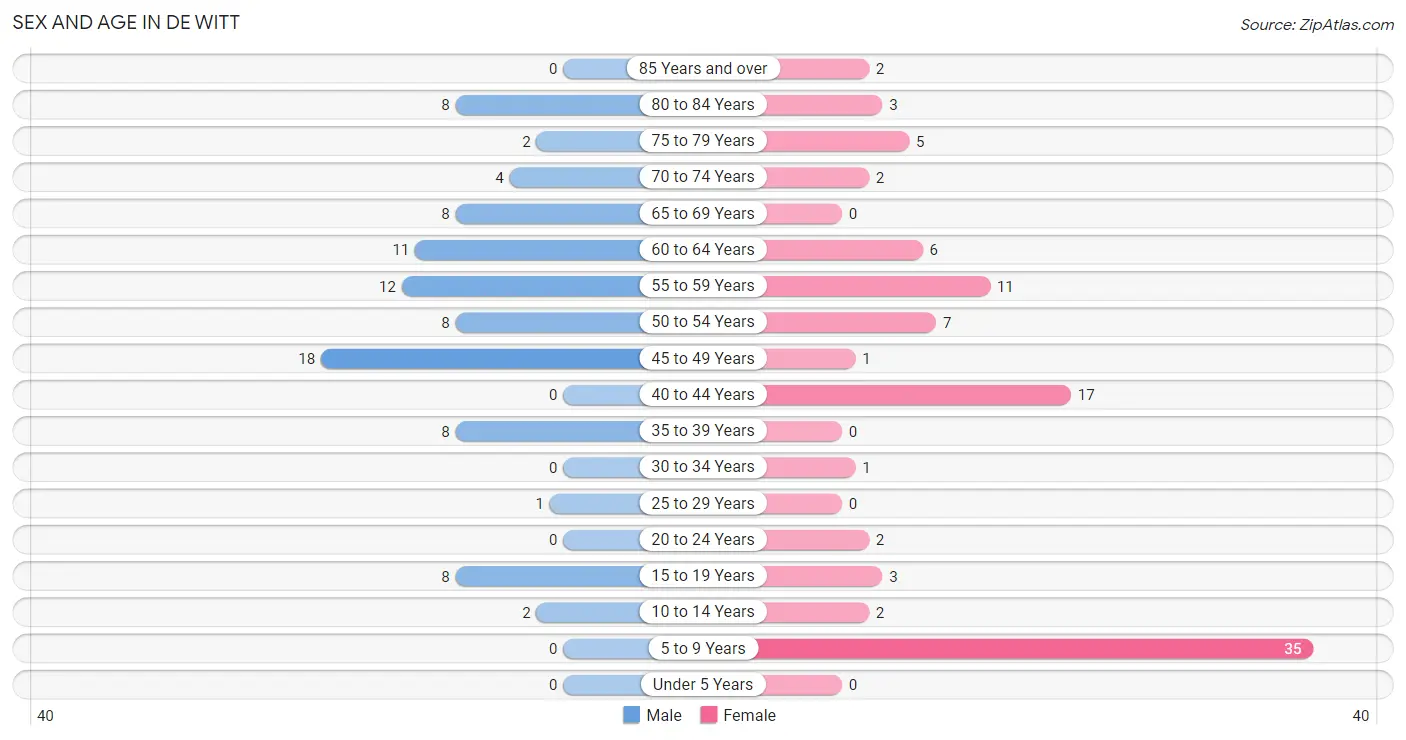
| Age Bracket | Male | Female |
| Under 5 Years | 0 (0.0%) | 0 (0.0%) |
| 5 to 9 Years | 0 (0.0%) | 35 (36.1%) |
| 10 to 14 Years | 2 (2.2%) | 2 (2.1%) |
| 15 to 19 Years | 8 (8.9%) | 3 (3.1%) |
| 20 to 24 Years | 0 (0.0%) | 2 (2.1%) |
| 25 to 29 Years | 1 (1.1%) | 0 (0.0%) |
| 30 to 34 Years | 0 (0.0%) | 1 (1.0%) |
| 35 to 39 Years | 8 (8.9%) | 0 (0.0%) |
| 40 to 44 Years | 0 (0.0%) | 17 (17.5%) |
| 45 to 49 Years | 18 (20.0%) | 1 (1.0%) |
| 50 to 54 Years | 8 (8.9%) | 7 (7.2%) |
| 55 to 59 Years | 12 (13.3%) | 11 (11.3%) |
| 60 to 64 Years | 11 (12.2%) | 6 (6.2%) |
| 65 to 69 Years | 8 (8.9%) | 0 (0.0%) |
| 70 to 74 Years | 4 (4.4%) | 2 (2.1%) |
| 75 to 79 Years | 2 (2.2%) | 5 (5.1%) |
| 80 to 84 Years | 8 (8.9%) | 3 (3.1%) |
| 85 Years and over | 0 (0.0%) | 2 (2.1%) |
| Total | 90 (100.0%) | 97 (100.0%) |
Families and Households in De Witt
Median Family Size in De Witt
The median family size in De Witt is 3.34 persons per family, with married-couple families (38 | 80.8%) accounting for the largest median family size of 3.45 persons per family. On the other hand, single male/father families (1 | 2.1%) represent the smallest median family size with 2.00 persons per family.
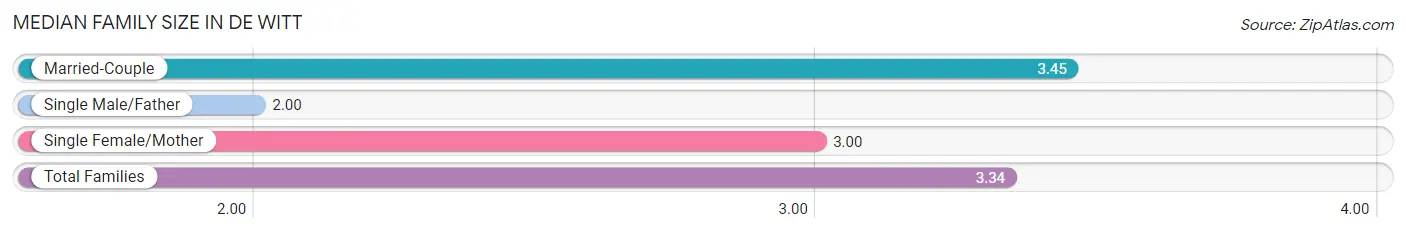
| Family Type | # Families | Family Size |
| Married-Couple | 38 (80.8%) | 3.45 |
| Single Male/Father | 1 (2.1%) | 2.00 |
| Single Female/Mother | 8 (17.0%) | 3.00 |
| Total Families | 47 (100.0%) | 3.34 |
Median Household Size in De Witt
The median household size in De Witt is 2.53 persons per household, with married-couple households (38 | 51.3%) accounting for the largest median household size of 3.45 persons per household. non-family households (27 | 36.5%) represent the smallest median household size with 1.04 persons per household.
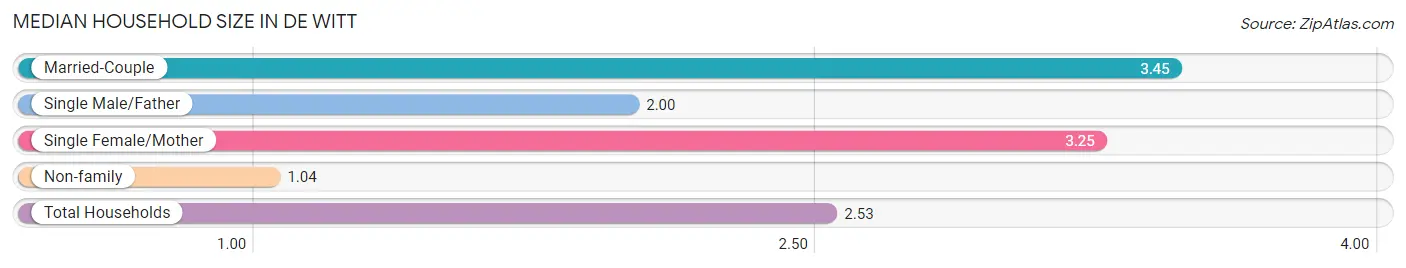
| Household Type | # Households | Household Size |
| Married-Couple | 38 (51.3%) | 3.45 |
| Single Male/Father | 1 (1.3%) | 2.00 |
| Single Female/Mother | 8 (10.8%) | 3.25 |
| Non-family | 27 (36.5%) | 1.04 |
| Total Households | 74 (100.0%) | 2.53 |
Household Size by Marriage Status in De Witt
Out of a total of 74 households in De Witt, 47 (63.5%) are family households, while 27 (36.5%) are nonfamily households. The most numerous type of family households are 2-person households, comprising 24, and the most common type of nonfamily households are 1-person households, comprising 26.
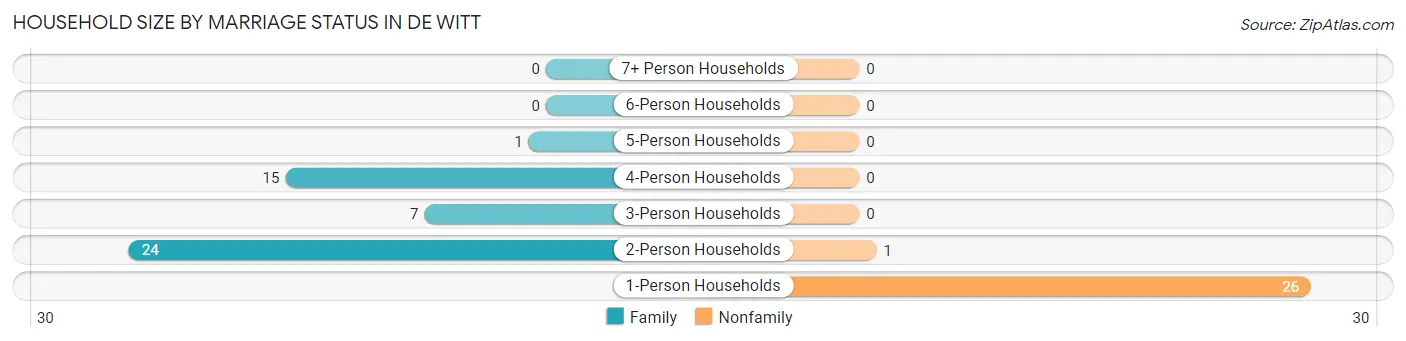
| Household Size | Family Households | Nonfamily Households |
| 1-Person Households | - | 26 (35.1%) |
| 2-Person Households | 24 (32.4%) | 1 (1.3%) |
| 3-Person Households | 7 (9.5%) | 0 (0.0%) |
| 4-Person Households | 15 (20.3%) | 0 (0.0%) |
| 5-Person Households | 1 (1.3%) | 0 (0.0%) |
| 6-Person Households | 0 (0.0%) | 0 (0.0%) |
| 7+ Person Households | 0 (0.0%) | 0 (0.0%) |
| Total | 47 (63.5%) | 27 (36.5%) |
Female Fertility in De Witt
Fertility by Age in De Witt
Average fertility rate in De Witt is 33.0 births per 1,000 women. Women in the age bracket of 20 to 34 years have the highest fertility rate with 333.0 births per 1,000 women. Women in the age bracket of 20 to 34 years acount for 100.0% of all women with births.
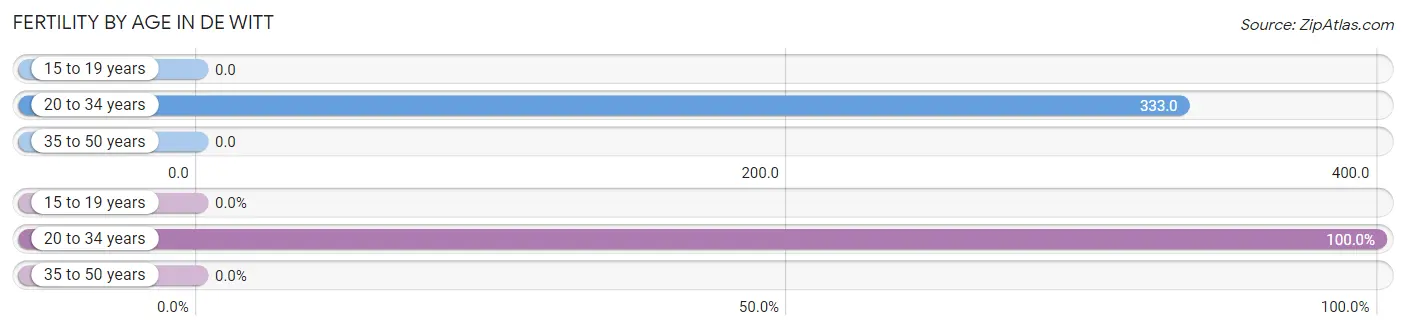
| Age Bracket | Women with Births | Births / 1,000 Women |
| 15 to 19 years | 0 (0.0%) | 0.0 |
| 20 to 34 years | 1 (100.0%) | 333.0 |
| 35 to 50 years | 0 (0.0%) | 0.0 |
| Total | 1 (100.0%) | 33.0 |
Fertility by Age by Marriage Status in De Witt
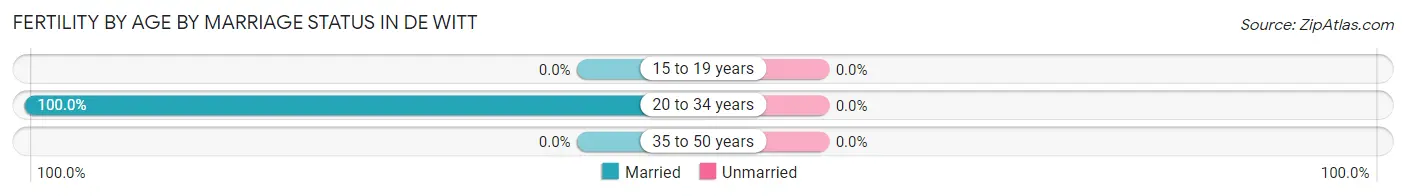
| Age Bracket | Married | Unmarried |
| 15 to 19 years | 0 (0.0%) | 0 (0.0%) |
| 20 to 34 years | 1 (100.0%) | 0 (0.0%) |
| 35 to 50 years | 0 (0.0%) | 0 (0.0%) |
| Total | 1 (100.0%) | 0 (0.0%) |
Fertility by Education in De Witt
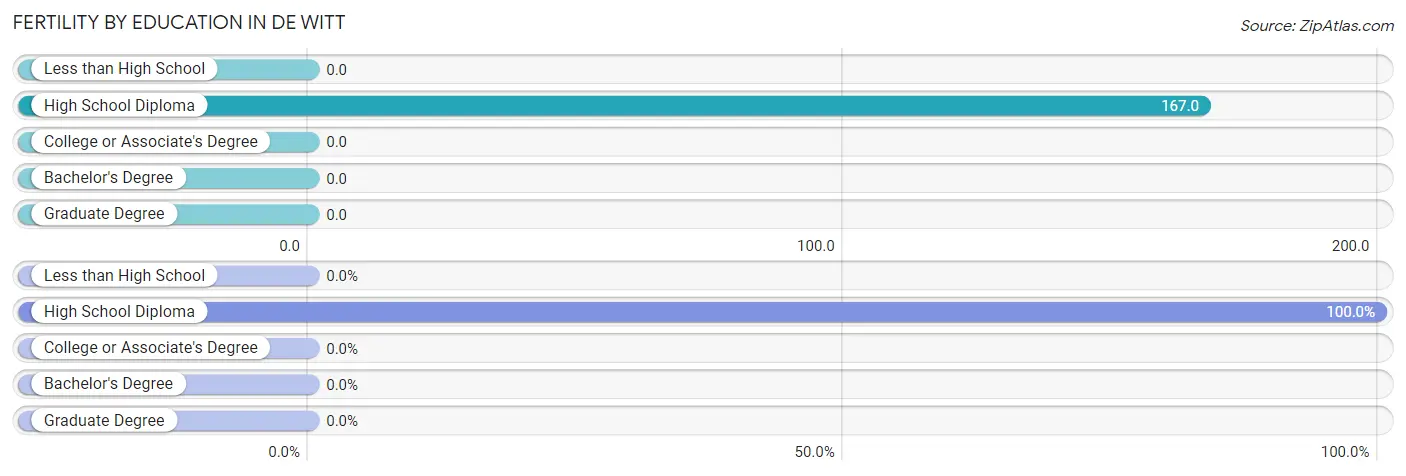
| Educational Attainment | Women with Births | Births / 1,000 Women |
| Less than High School | 0 (0.0%) | 0.0 |
| High School Diploma | 1 (100.0%) | 167.0 |
| College or Associate's Degree | 0 (0.0%) | 0.0 |
| Bachelor's Degree | 0 (0.0%) | 0.0 |
| Graduate Degree | 0 (0.0%) | 0.0 |
| Total | 1 (100.0%) | 33.0 |
Fertility by Education by Marriage Status in De Witt
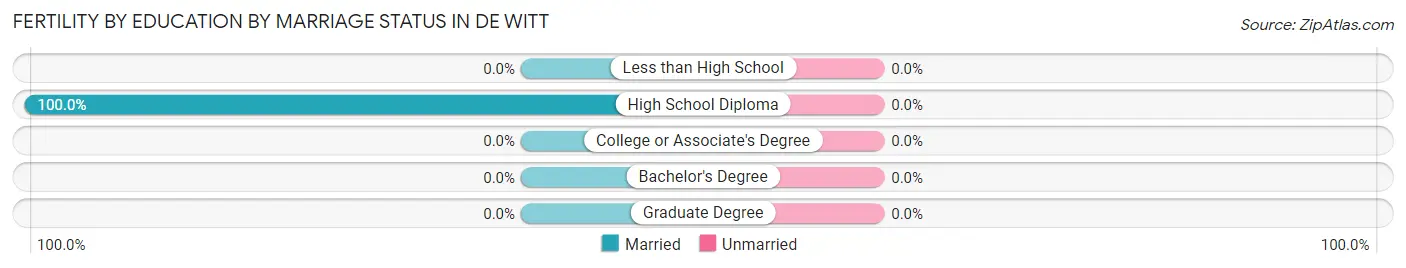
| Educational Attainment | Married | Unmarried |
| Less than High School | 0 (0.0%) | 0 (0.0%) |
| High School Diploma | 1 (100.0%) | 0 (0.0%) |
| College or Associate's Degree | 0 (0.0%) | 0 (0.0%) |
| Bachelor's Degree | 0 (0.0%) | 0 (0.0%) |
| Graduate Degree | 0 (0.0%) | 0 (0.0%) |
| Total | 1 (100.0%) | 0 (0.0%) |
Employment Characteristics in De Witt
Employment by Class of Employer in De Witt
Among the 83 employed individuals in De Witt, private company employees (54 | 65.1%), local government employees (21 | 25.3%), and not-for-profit organizations (3 | 3.6%) make up the most common classes of employment.
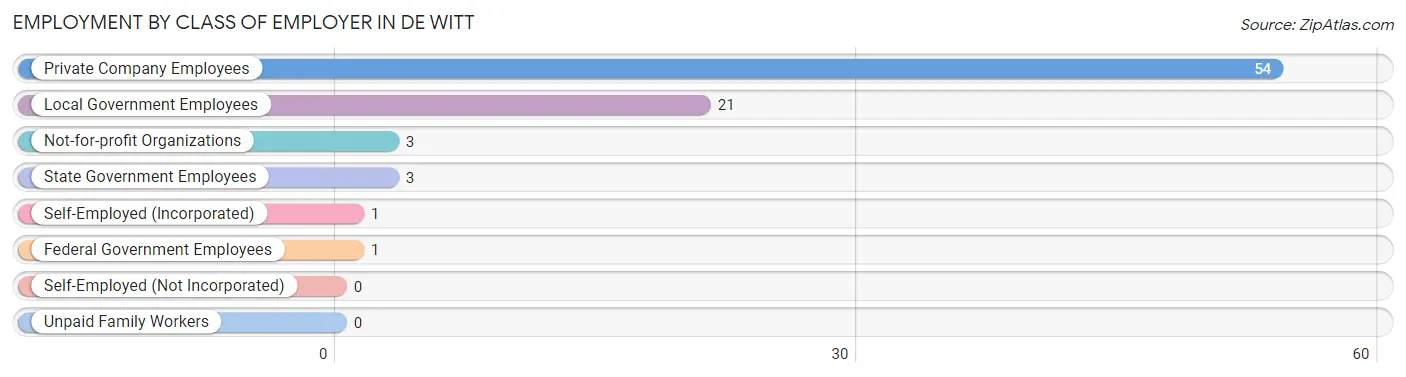
| Employer Class | # Employees | % Employees |
| Private Company Employees | 54 | 65.1% |
| Self-Employed (Incorporated) | 1 | 1.2% |
| Self-Employed (Not Incorporated) | 0 | 0.0% |
| Not-for-profit Organizations | 3 | 3.6% |
| Local Government Employees | 21 | 25.3% |
| State Government Employees | 3 | 3.6% |
| Federal Government Employees | 1 | 1.2% |
| Unpaid Family Workers | 0 | 0.0% |
| Total | 83 | 100.0% |
Employment Status by Age in De Witt
According to the labor force statistics for De Witt, out of the total population over 16 years of age (148), 59.5% or 88 individuals are in the labor force, with 5.7% or 5 of them unemployed. The age group with the highest labor force participation rate is 20 to 24 years, with 100.0% or 2 individuals in the labor force. Within the labor force, the 30 to 34 years age range has the highest percentage of unemployed individuals, with 100.0% or 1 of them being unemployed.
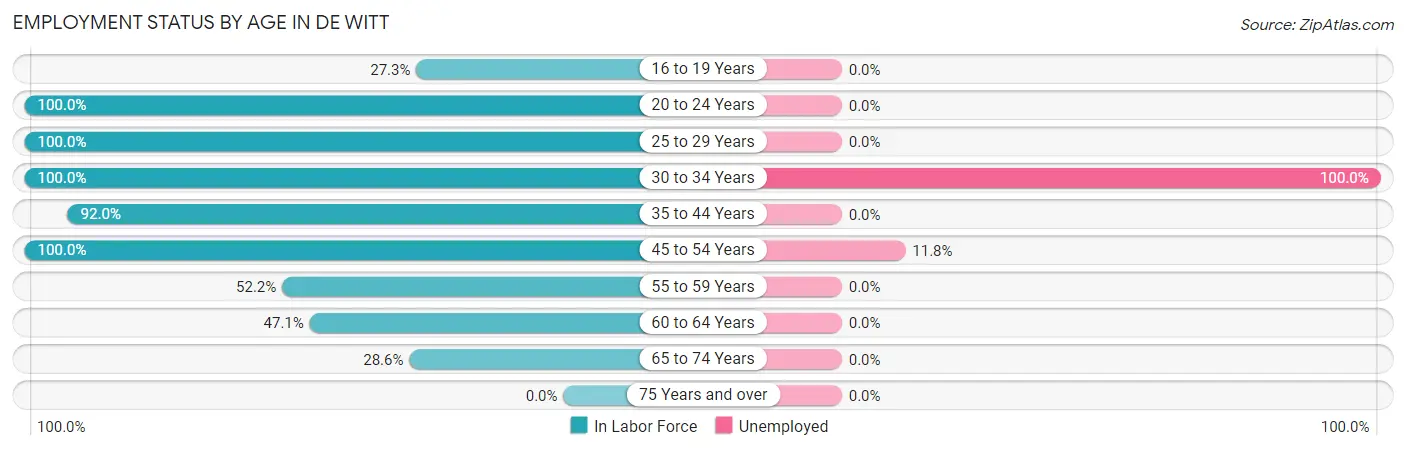
| Age Bracket | In Labor Force | Unemployed |
| 16 to 19 Years | 3 (27.3%) | 0 (0.0%) |
| 20 to 24 Years | 2 (100.0%) | 0 (0.0%) |
| 25 to 29 Years | 1 (100.0%) | 0 (0.0%) |
| 30 to 34 Years | 1 (100.0%) | 1 (100.0%) |
| 35 to 44 Years | 23 (92.0%) | 0 (0.0%) |
| 45 to 54 Years | 34 (100.0%) | 4 (11.8%) |
| 55 to 59 Years | 12 (52.2%) | 0 (0.0%) |
| 60 to 64 Years | 8 (47.1%) | 0 (0.0%) |
| 65 to 74 Years | 4 (28.6%) | 0 (0.0%) |
| 75 Years and over | 0 (0.0%) | 0 (0.0%) |
| Total | 88 (59.5%) | 5 (5.7%) |
Employment Status by Educational Attainment in De Witt
According to labor force statistics for De Witt, 78.2% of individuals (79) out of the total population between 25 and 64 years of age (101) are in the labor force, with 6.3% or 5 of them being unemployed. The group with the highest labor force participation rate are those with the educational attainment of college / associate degree, with 93.1% or 27 individuals in the labor force. Within the labor force, individuals with high school diploma education have the highest percentage of unemployment, with 10.6% or 5 of them being unemployed.
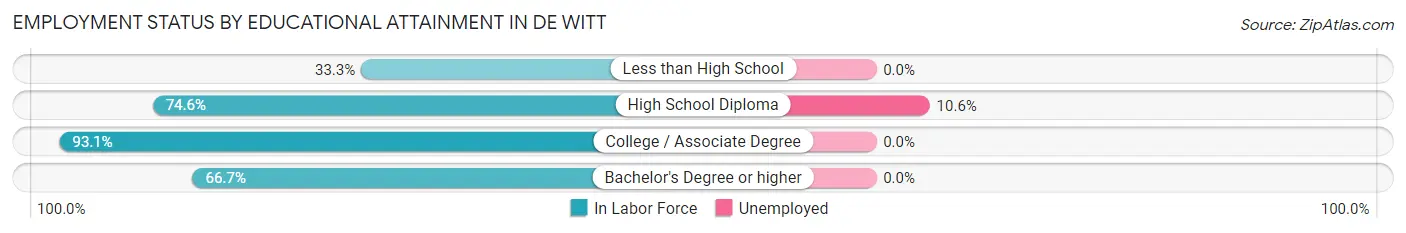
| Educational Attainment | In Labor Force | Unemployed |
| Less than High School | 1 (33.3%) | 0 (0.0%) |
| High School Diploma | 47 (74.6%) | 7 (10.6%) |
| College / Associate Degree | 27 (93.1%) | 0 (0.0%) |
| Bachelor's Degree or higher | 4 (66.7%) | 0 (0.0%) |
| Total | 79 (78.2%) | 6 (6.3%) |
Employment Occupations by Sex in De Witt
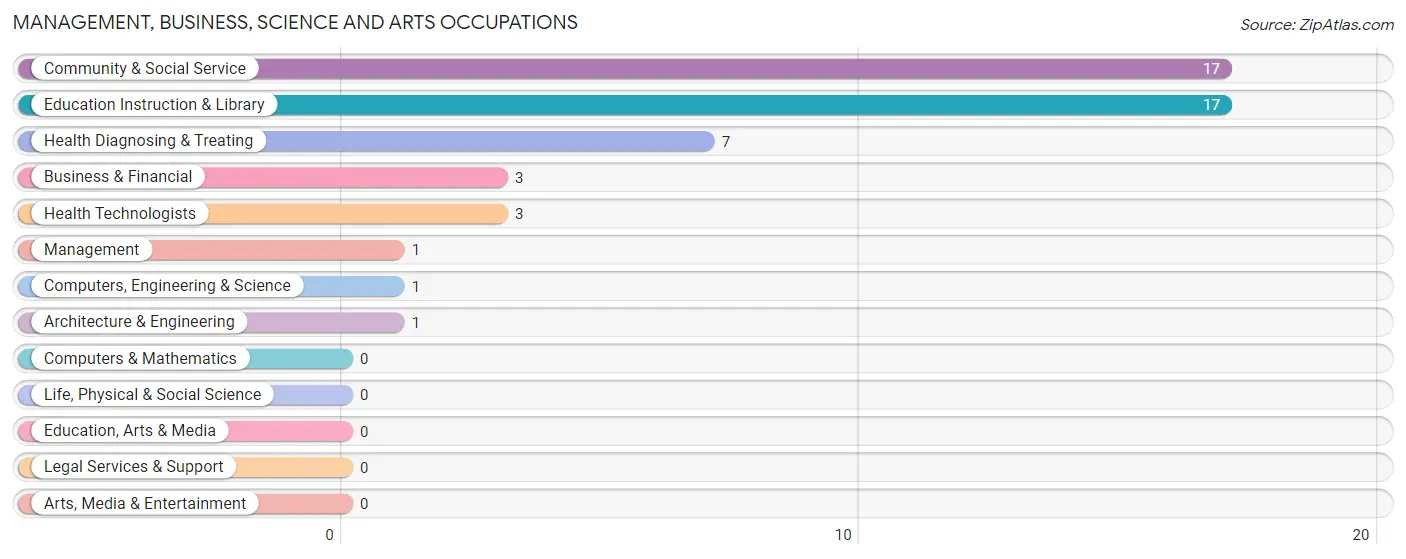
Management, Business, Science and Arts Occupations
The most common Management, Business, Science and Arts occupations in De Witt are Community & Social Service (17 | 20.5%), Education Instruction & Library (17 | 20.5%), Health Diagnosing & Treating (7 | 8.4%), Business & Financial (3 | 3.6%), and Health Technologists (3 | 3.6%).
Management, Business, Science and Arts Occupations by Sex
Within the Management, Business, Science and Arts occupations in De Witt, the most male-oriented occupations are Computers, Engineering & Science (100.0%), Architecture & Engineering (100.0%), and Health Diagnosing & Treating (14.3%), while the most female-oriented occupations are Management (100.0%), Business & Financial (100.0%), and Community & Social Service (100.0%).
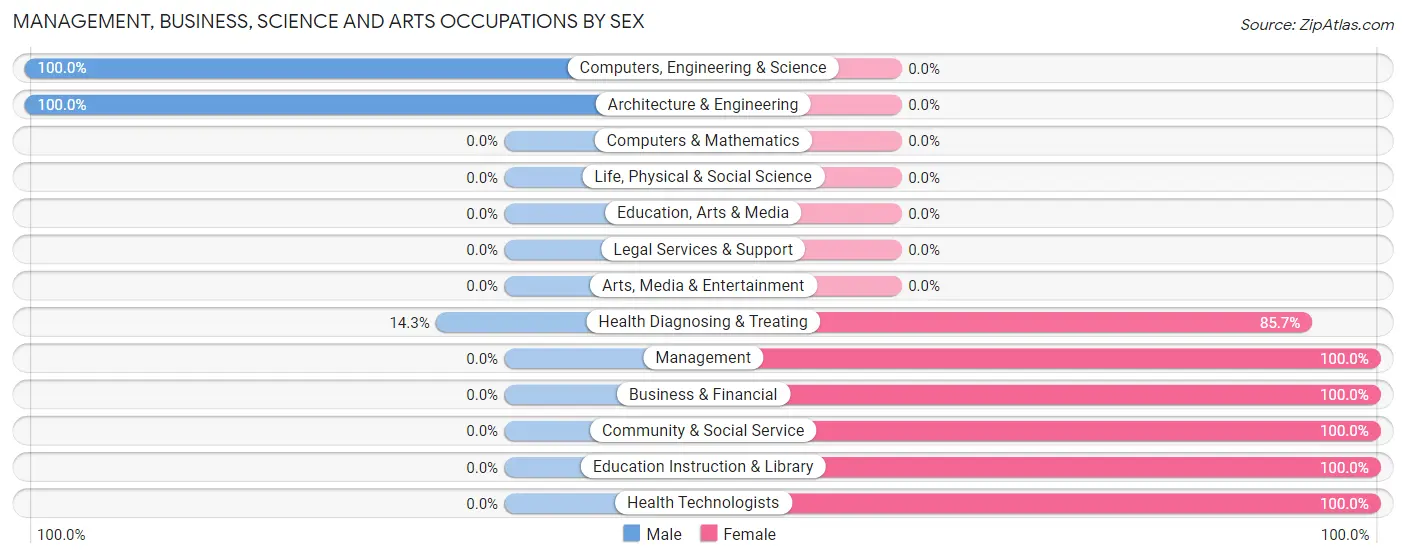
| Occupation | Male | Female |
| Management | 0 (0.0%) | 1 (100.0%) |
| Business & Financial | 0 (0.0%) | 3 (100.0%) |
| Computers, Engineering & Science | 1 (100.0%) | 0 (0.0%) |
| Computers & Mathematics | 0 (0.0%) | 0 (0.0%) |
| Architecture & Engineering | 1 (100.0%) | 0 (0.0%) |
| Life, Physical & Social Science | 0 (0.0%) | 0 (0.0%) |
| Community & Social Service | 0 (0.0%) | 17 (100.0%) |
| Education, Arts & Media | 0 (0.0%) | 0 (0.0%) |
| Legal Services & Support | 0 (0.0%) | 0 (0.0%) |
| Education Instruction & Library | 0 (0.0%) | 17 (100.0%) |
| Arts, Media & Entertainment | 0 (0.0%) | 0 (0.0%) |
| Health Diagnosing & Treating | 1 (14.3%) | 6 (85.7%) |
| Health Technologists | 0 (0.0%) | 3 (100.0%) |
| Total (Category) | 2 (6.9%) | 27 (93.1%) |
| Total (Overall) | 45 (54.2%) | 38 (45.8%) |
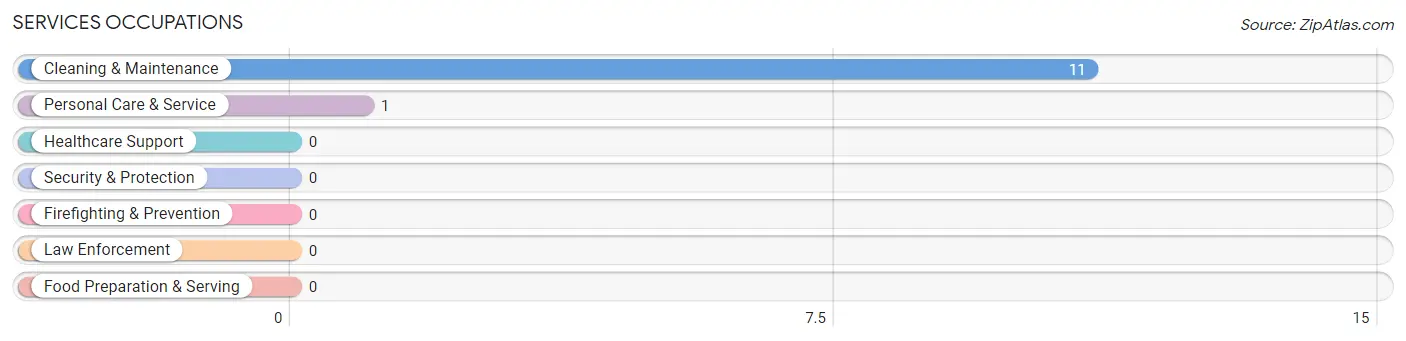
Services Occupations
The most common Services occupations in De Witt are Cleaning & Maintenance (11 | 13.3%), and Personal Care & Service (1 | 1.2%).
Services Occupations by Sex
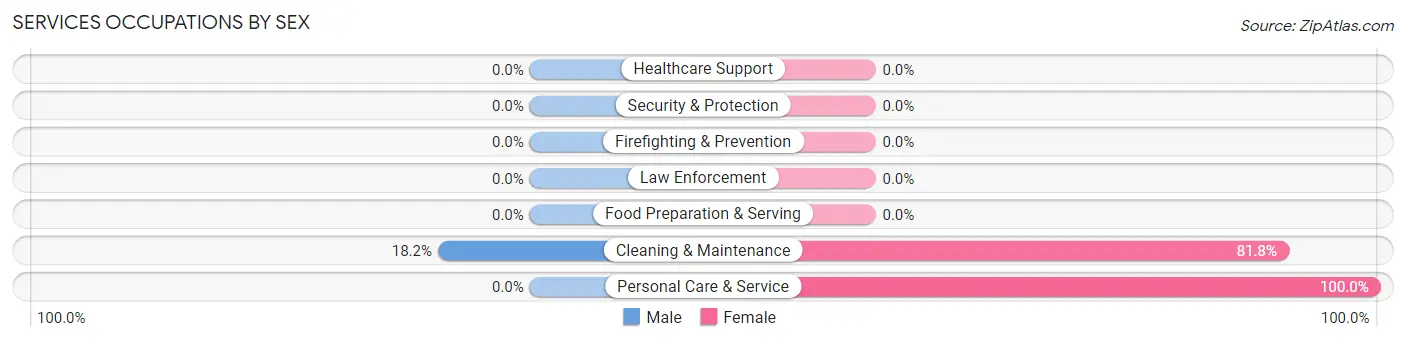
| Occupation | Male | Female |
| Healthcare Support | 0 (0.0%) | 0 (0.0%) |
| Security & Protection | 0 (0.0%) | 0 (0.0%) |
| Firefighting & Prevention | 0 (0.0%) | 0 (0.0%) |
| Law Enforcement | 0 (0.0%) | 0 (0.0%) |
| Food Preparation & Serving | 0 (0.0%) | 0 (0.0%) |
| Cleaning & Maintenance | 2 (18.2%) | 9 (81.8%) |
| Personal Care & Service | 0 (0.0%) | 1 (100.0%) |
| Total (Category) | 2 (16.7%) | 10 (83.3%) |
| Total (Overall) | 45 (54.2%) | 38 (45.8%) |
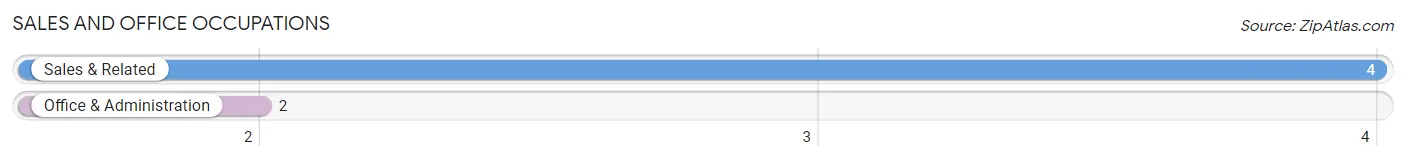
Sales and Office Occupations
The most common Sales and Office occupations in De Witt are Sales & Related (4 | 4.8%), and Office & Administration (2 | 2.4%).
Sales and Office Occupations by Sex

| Occupation | Male | Female |
| Sales & Related | 4 (100.0%) | 0 (0.0%) |
| Office & Administration | 1 (50.0%) | 1 (50.0%) |
| Total (Category) | 5 (83.3%) | 1 (16.7%) |
| Total (Overall) | 45 (54.2%) | 38 (45.8%) |
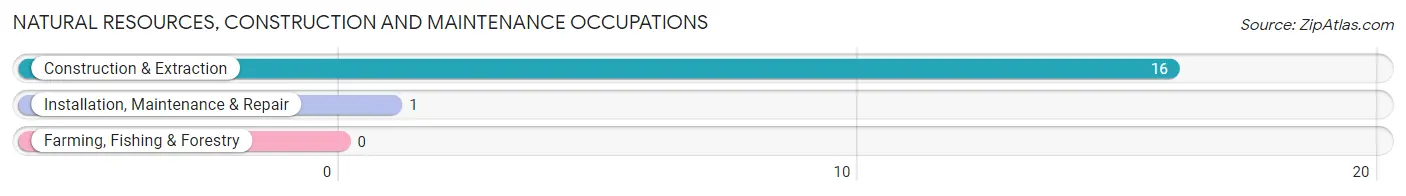
Natural Resources, Construction and Maintenance Occupations
The most common Natural Resources, Construction and Maintenance occupations in De Witt are Construction & Extraction (16 | 19.3%), and Installation, Maintenance & Repair (1 | 1.2%).
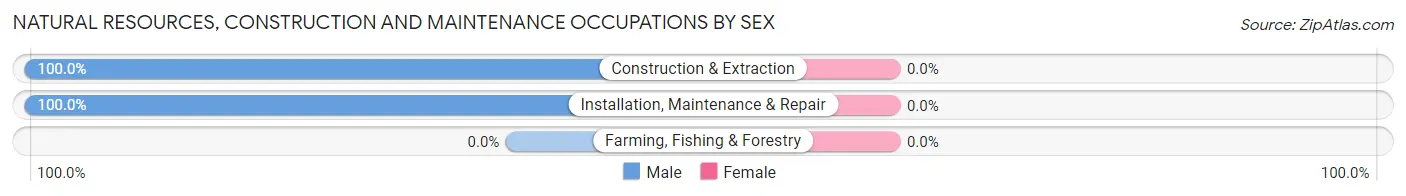
Natural Resources, Construction and Maintenance Occupations by Sex
| Occupation | Male | Female |
| Farming, Fishing & Forestry | 0 (0.0%) | 0 (0.0%) |
| Construction & Extraction | 16 (100.0%) | 0 (0.0%) |
| Installation, Maintenance & Repair | 1 (100.0%) | 0 (0.0%) |
| Total (Category) | 17 (100.0%) | 0 (0.0%) |
| Total (Overall) | 45 (54.2%) | 38 (45.8%) |
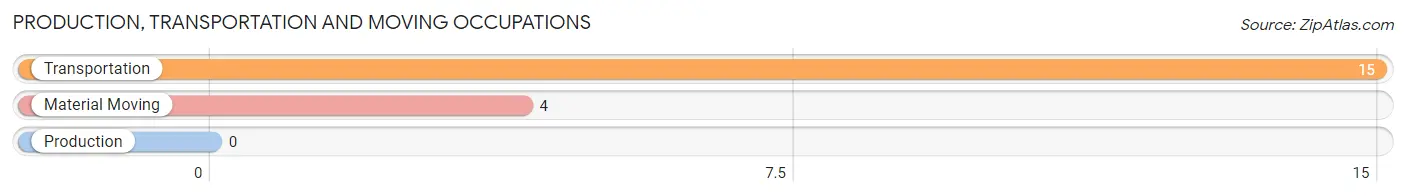
Production, Transportation and Moving Occupations
The most common Production, Transportation and Moving occupations in De Witt are Transportation (15 | 18.1%), and Material Moving (4 | 4.8%).
Production, Transportation and Moving Occupations by Sex
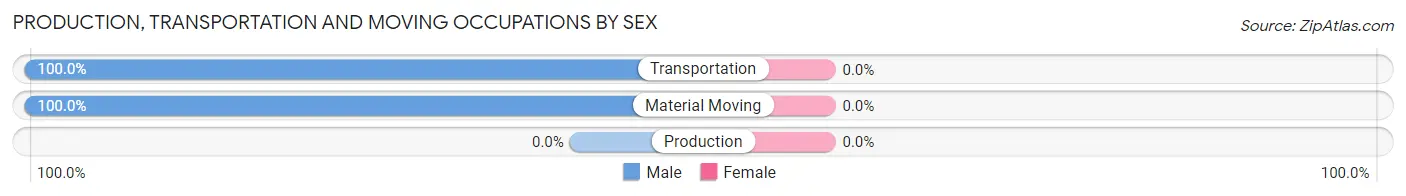
| Occupation | Male | Female |
| Production | 0 (0.0%) | 0 (0.0%) |
| Transportation | 15 (100.0%) | 0 (0.0%) |
| Material Moving | 4 (100.0%) | 0 (0.0%) |
| Total (Category) | 19 (100.0%) | 0 (0.0%) |
| Total (Overall) | 45 (54.2%) | 38 (45.8%) |
Employment Industries by Sex in De Witt
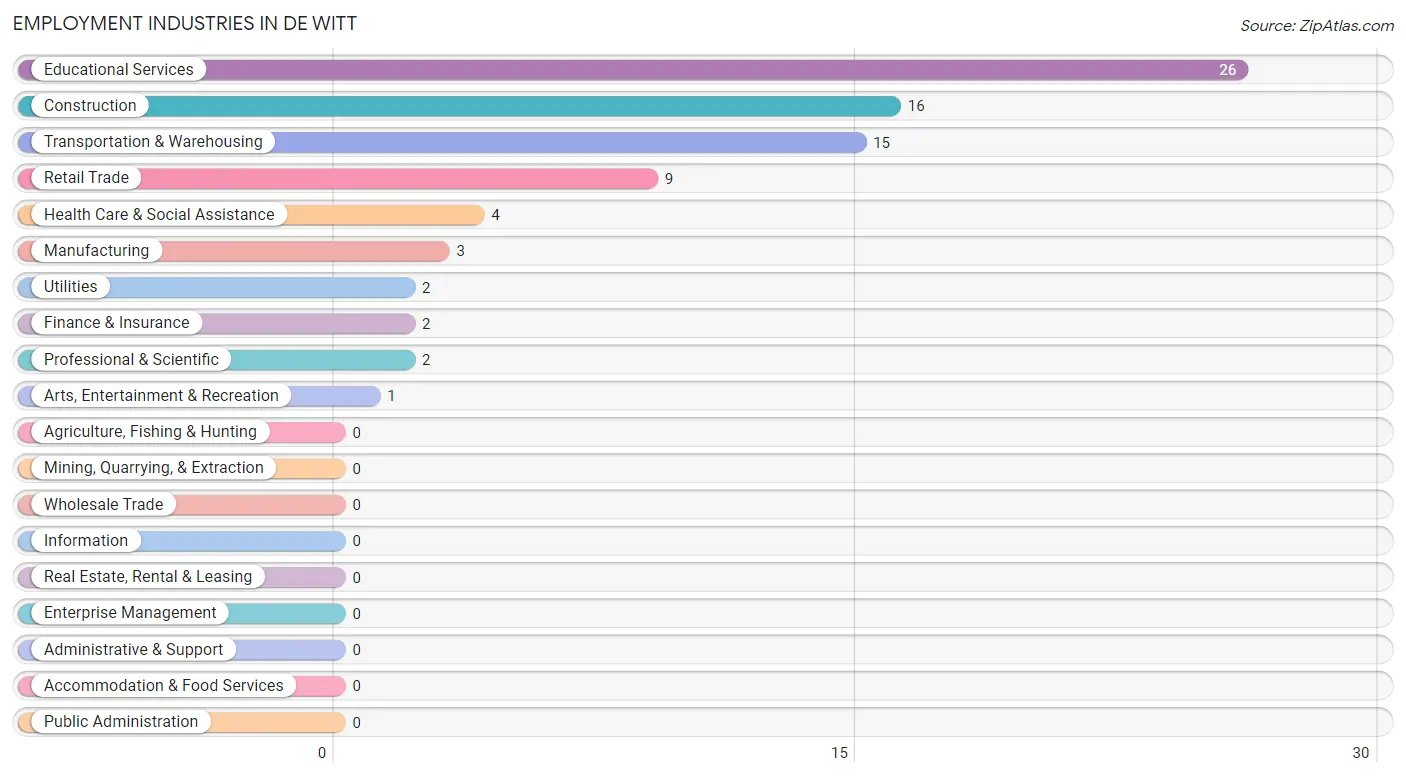
Employment Industries in De Witt
The major employment industries in De Witt include Educational Services (26 | 31.3%), Construction (16 | 19.3%), Transportation & Warehousing (15 | 18.1%), Retail Trade (9 | 10.8%), and Health Care & Social Assistance (4 | 4.8%).
Employment Industries by Sex in De Witt
The De Witt industries that see more men than women are Construction (100.0%), Manufacturing (100.0%), and Utilities (100.0%), whereas the industries that tend to have a higher number of women are Finance & Insurance (100.0%), Professional & Scientific (100.0%), and Educational Services (100.0%).
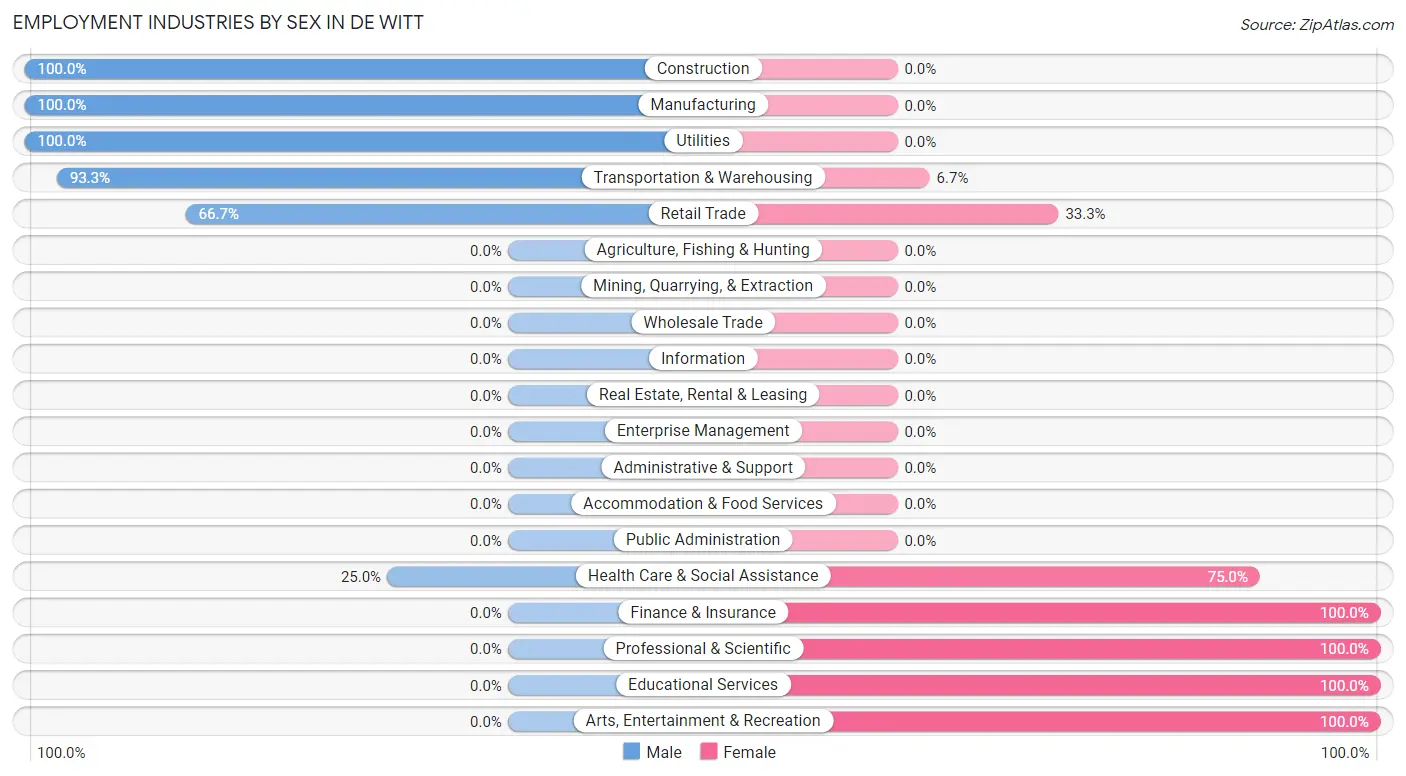
| Industry | Male | Female |
| Agriculture, Fishing & Hunting | 0 (0.0%) | 0 (0.0%) |
| Mining, Quarrying, & Extraction | 0 (0.0%) | 0 (0.0%) |
| Construction | 16 (100.0%) | 0 (0.0%) |
| Manufacturing | 3 (100.0%) | 0 (0.0%) |
| Wholesale Trade | 0 (0.0%) | 0 (0.0%) |
| Retail Trade | 6 (66.7%) | 3 (33.3%) |
| Transportation & Warehousing | 14 (93.3%) | 1 (6.7%) |
| Utilities | 2 (100.0%) | 0 (0.0%) |
| Information | 0 (0.0%) | 0 (0.0%) |
| Finance & Insurance | 0 (0.0%) | 2 (100.0%) |
| Real Estate, Rental & Leasing | 0 (0.0%) | 0 (0.0%) |
| Professional & Scientific | 0 (0.0%) | 2 (100.0%) |
| Enterprise Management | 0 (0.0%) | 0 (0.0%) |
| Administrative & Support | 0 (0.0%) | 0 (0.0%) |
| Educational Services | 0 (0.0%) | 26 (100.0%) |
| Health Care & Social Assistance | 1 (25.0%) | 3 (75.0%) |
| Arts, Entertainment & Recreation | 0 (0.0%) | 1 (100.0%) |
| Accommodation & Food Services | 0 (0.0%) | 0 (0.0%) |
| Public Administration | 0 (0.0%) | 0 (0.0%) |
| Total | 45 (54.2%) | 38 (45.8%) |
Education in De Witt
School Enrollment in De Witt
The most common levels of schooling among the 50 students in De Witt are nursery / preschool (18 | 36.0%), elementary school (17 | 34.0%), and high school (7 | 14.0%).
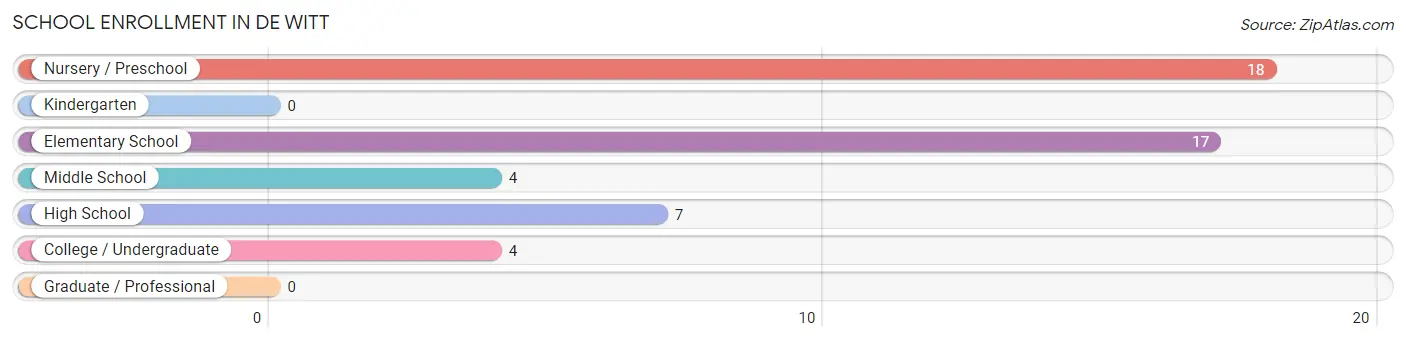
| School Level | # Students | % Students |
| Nursery / Preschool | 18 | 36.0% |
| Kindergarten | 0 | 0.0% |
| Elementary School | 17 | 34.0% |
| Middle School | 4 | 8.0% |
| High School | 7 | 14.0% |
| College / Undergraduate | 4 | 8.0% |
| Graduate / Professional | 0 | 0.0% |
| Total | 50 | 100.0% |
School Enrollment by Age by Funding Source in De Witt
Out of a total of 50 students who are enrolled in schools in De Witt, 1 (2.0%) attend a private institution, while the remaining 49 (98.0%) are enrolled in public schools. The age group of 5 to 9 year old has the highest likelihood of being enrolled in private schools, with 1 (2.9% in the age bracket) enrolled. Conversely, the age group of 10 to 14 year olds has the lowest likelihood of being enrolled in a private school, with 4 (100.0% in the age bracket) attending a public institution.
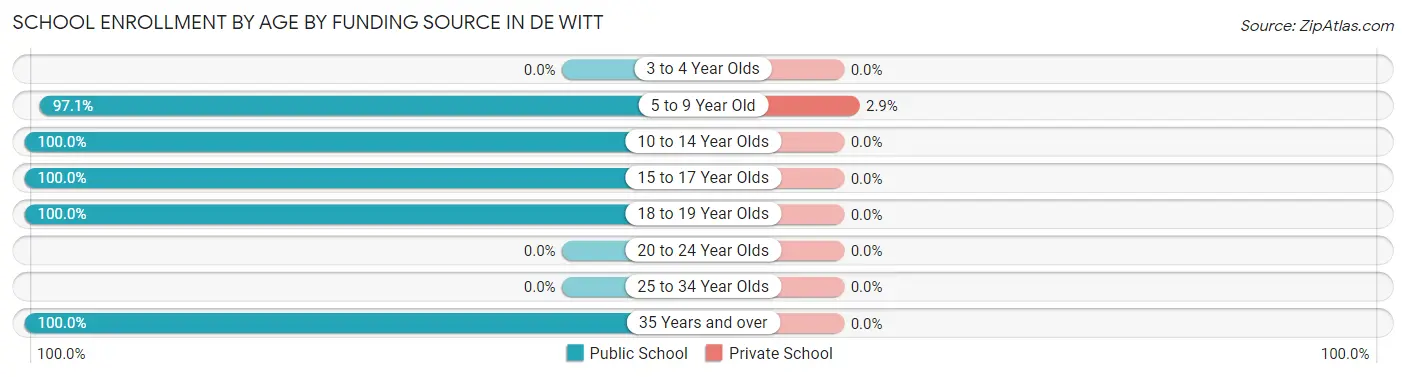
| Age Bracket | Public School | Private School |
| 3 to 4 Year Olds | 0 (0.0%) | 0 (0.0%) |
| 5 to 9 Year Old | 34 (97.1%) | 1 (2.9%) |
| 10 to 14 Year Olds | 4 (100.0%) | 0 (0.0%) |
| 15 to 17 Year Olds | 7 (100.0%) | 0 (0.0%) |
| 18 to 19 Year Olds | 3 (100.0%) | 0 (0.0%) |
| 20 to 24 Year Olds | 0 (0.0%) | 0 (0.0%) |
| 25 to 34 Year Olds | 0 (0.0%) | 0 (0.0%) |
| 35 Years and over | 1 (100.0%) | 0 (0.0%) |
| Total | 49 (98.0%) | 1 (2.0%) |
Educational Attainment by Field of Study in De Witt
Education (3 | 30.0%), computers & mathematics (2 | 20.0%), physical & health sciences (1 | 10.0%), psychology (1 | 10.0%), and social sciences (1 | 10.0%) are the most common fields of study among 10 individuals in De Witt who have obtained a bachelor's degree or higher.
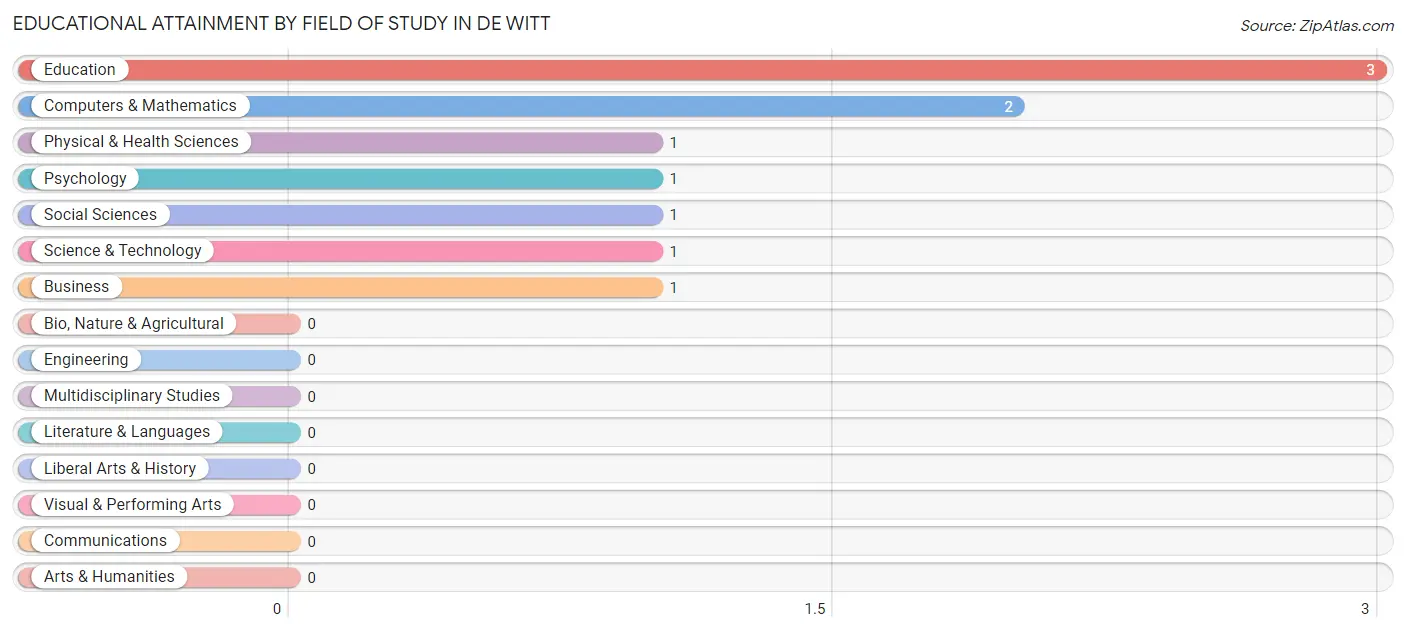
| Field of Study | # Graduates | % Graduates |
| Computers & Mathematics | 2 | 20.0% |
| Bio, Nature & Agricultural | 0 | 0.0% |
| Physical & Health Sciences | 1 | 10.0% |
| Psychology | 1 | 10.0% |
| Social Sciences | 1 | 10.0% |
| Engineering | 0 | 0.0% |
| Multidisciplinary Studies | 0 | 0.0% |
| Science & Technology | 1 | 10.0% |
| Business | 1 | 10.0% |
| Education | 3 | 30.0% |
| Literature & Languages | 0 | 0.0% |
| Liberal Arts & History | 0 | 0.0% |
| Visual & Performing Arts | 0 | 0.0% |
| Communications | 0 | 0.0% |
| Arts & Humanities | 0 | 0.0% |
| Total | 10 | 100.0% |
Transportation & Commute in De Witt
Vehicle Availability by Sex in De Witt
The most prevalent vehicle ownership categories in De Witt are males with 3 vehicles (29, accounting for 64.4%) and females with 3 vehicles (20, making up 76.3%).
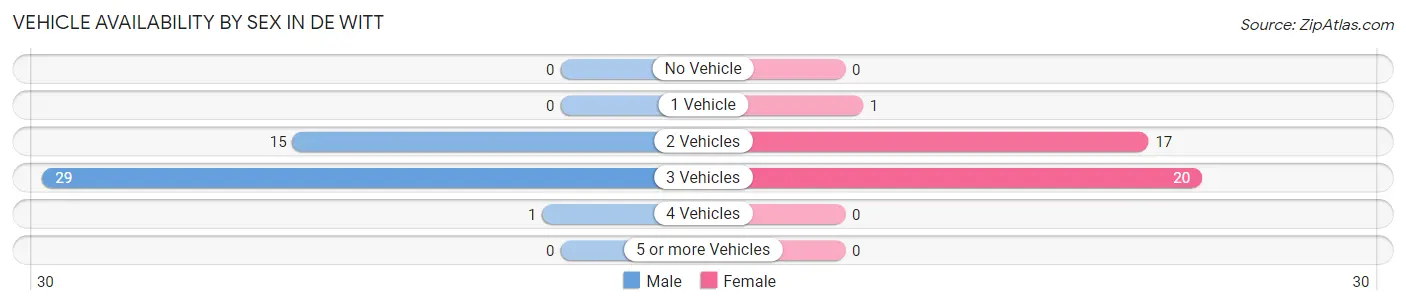
| Vehicles Available | Male | Female |
| No Vehicle | 0 (0.0%) | 0 (0.0%) |
| 1 Vehicle | 0 (0.0%) | 1 (2.6%) |
| 2 Vehicles | 15 (33.3%) | 17 (44.7%) |
| 3 Vehicles | 29 (64.4%) | 20 (52.6%) |
| 4 Vehicles | 1 (2.2%) | 0 (0.0%) |
| 5 or more Vehicles | 0 (0.0%) | 0 (0.0%) |
| Total | 45 (100.0%) | 38 (100.0%) |
Commute Time in De Witt
The most frequently occuring commute durations in De Witt are 15 to 19 minutes (26 commuters, 31.3%), 90 or more minutes (21 commuters, 25.3%), and 20 to 24 minutes (10 commuters, 12.0%).
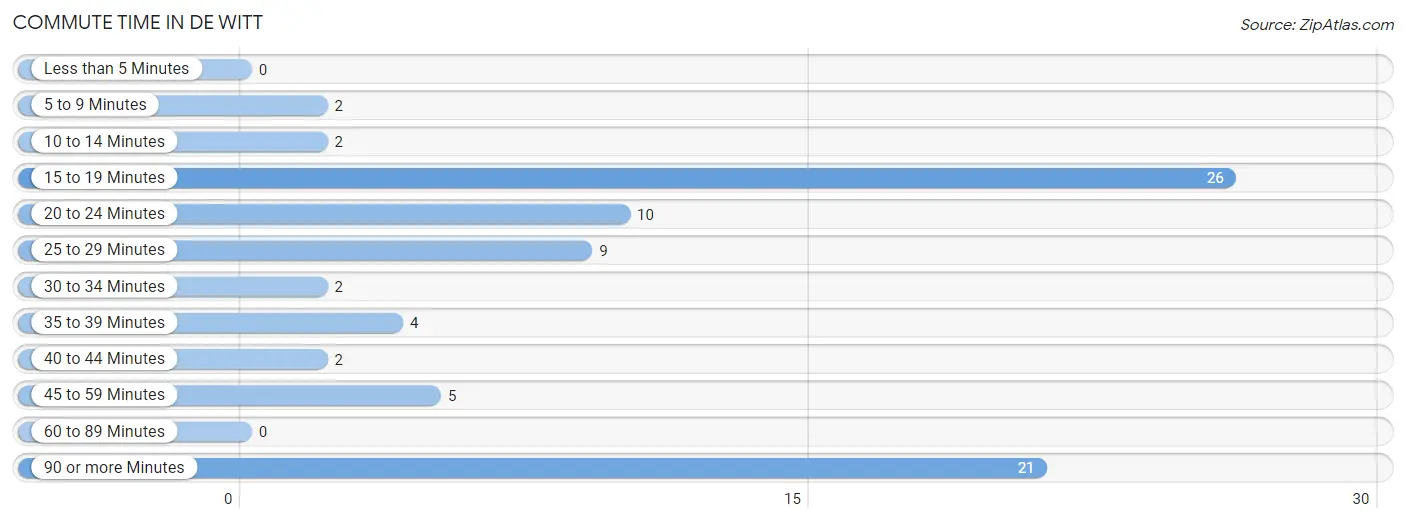
| Commute Time | # Commuters | % Commuters |
| Less than 5 Minutes | 0 | 0.0% |
| 5 to 9 Minutes | 2 | 2.4% |
| 10 to 14 Minutes | 2 | 2.4% |
| 15 to 19 Minutes | 26 | 31.3% |
| 20 to 24 Minutes | 10 | 12.0% |
| 25 to 29 Minutes | 9 | 10.8% |
| 30 to 34 Minutes | 2 | 2.4% |
| 35 to 39 Minutes | 4 | 4.8% |
| 40 to 44 Minutes | 2 | 2.4% |
| 45 to 59 Minutes | 5 | 6.0% |
| 60 to 89 Minutes | 0 | 0.0% |
| 90 or more Minutes | 21 | 25.3% |
Commute Time by Sex in De Witt
The most common commute times in De Witt are 90 or more minutes (17 commuters, 37.8%) for males and 15 to 19 minutes (19 commuters, 50.0%) for females.
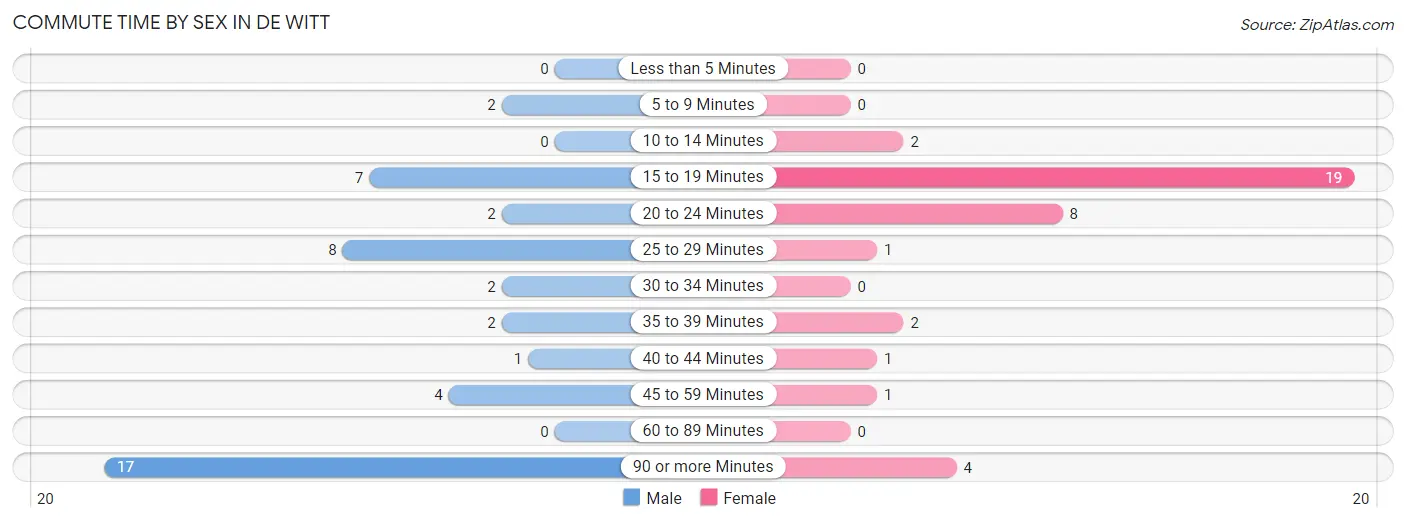
| Commute Time | Male | Female |
| Less than 5 Minutes | 0 (0.0%) | 0 (0.0%) |
| 5 to 9 Minutes | 2 (4.4%) | 0 (0.0%) |
| 10 to 14 Minutes | 0 (0.0%) | 2 (5.3%) |
| 15 to 19 Minutes | 7 (15.6%) | 19 (50.0%) |
| 20 to 24 Minutes | 2 (4.4%) | 8 (21.0%) |
| 25 to 29 Minutes | 8 (17.8%) | 1 (2.6%) |
| 30 to 34 Minutes | 2 (4.4%) | 0 (0.0%) |
| 35 to 39 Minutes | 2 (4.4%) | 2 (5.3%) |
| 40 to 44 Minutes | 1 (2.2%) | 1 (2.6%) |
| 45 to 59 Minutes | 4 (8.9%) | 1 (2.6%) |
| 60 to 89 Minutes | 0 (0.0%) | 0 (0.0%) |
| 90 or more Minutes | 17 (37.8%) | 4 (10.5%) |
Time of Departure to Work by Sex in De Witt
The most frequent times of departure to work in De Witt are 12:00 AM to 4:59 AM (14, 31.1%) for males and 7:00 AM to 7:29 AM (17, 44.7%) for females.
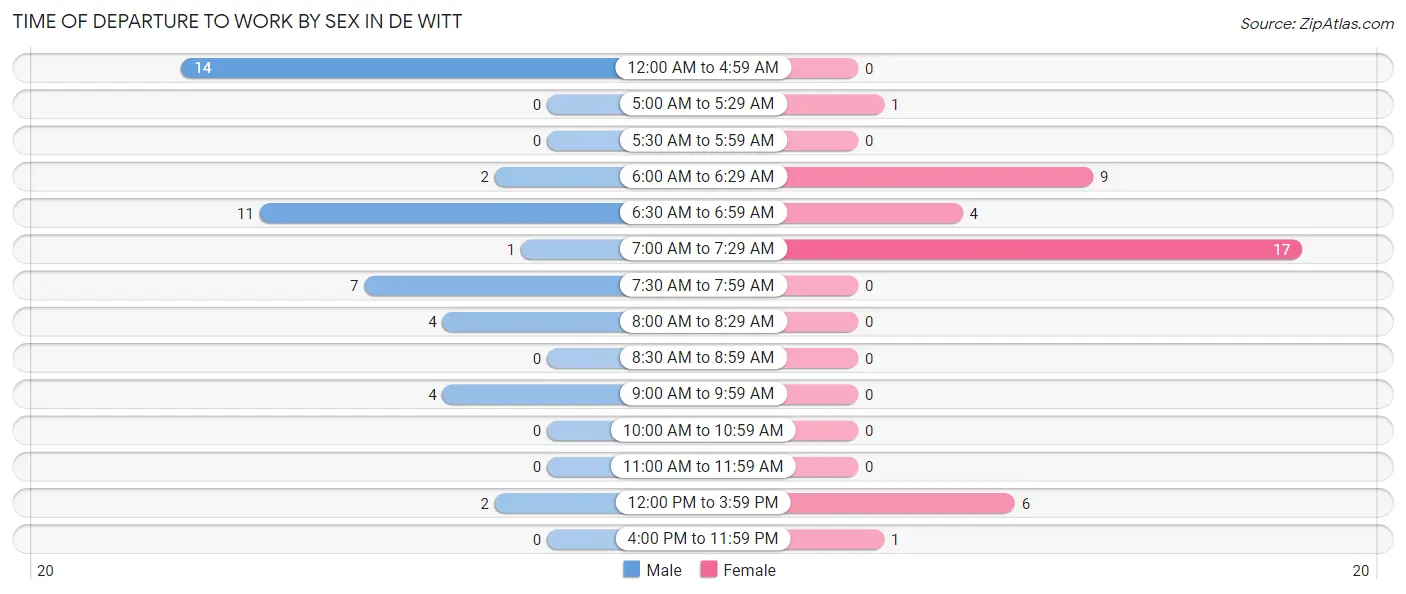
| Time of Departure | Male | Female |
| 12:00 AM to 4:59 AM | 14 (31.1%) | 0 (0.0%) |
| 5:00 AM to 5:29 AM | 0 (0.0%) | 1 (2.6%) |
| 5:30 AM to 5:59 AM | 0 (0.0%) | 0 (0.0%) |
| 6:00 AM to 6:29 AM | 2 (4.4%) | 9 (23.7%) |
| 6:30 AM to 6:59 AM | 11 (24.4%) | 4 (10.5%) |
| 7:00 AM to 7:29 AM | 1 (2.2%) | 17 (44.7%) |
| 7:30 AM to 7:59 AM | 7 (15.6%) | 0 (0.0%) |
| 8:00 AM to 8:29 AM | 4 (8.9%) | 0 (0.0%) |
| 8:30 AM to 8:59 AM | 0 (0.0%) | 0 (0.0%) |
| 9:00 AM to 9:59 AM | 4 (8.9%) | 0 (0.0%) |
| 10:00 AM to 10:59 AM | 0 (0.0%) | 0 (0.0%) |
| 11:00 AM to 11:59 AM | 0 (0.0%) | 0 (0.0%) |
| 12:00 PM to 3:59 PM | 2 (4.4%) | 6 (15.8%) |
| 4:00 PM to 11:59 PM | 0 (0.0%) | 1 (2.6%) |
| Total | 45 (100.0%) | 38 (100.0%) |
Housing Occupancy in De Witt
Occupancy by Ownership in De Witt
Of the total 74 dwellings in De Witt, owner-occupied units account for 64 (86.5%), while renter-occupied units make up 10 (13.5%).
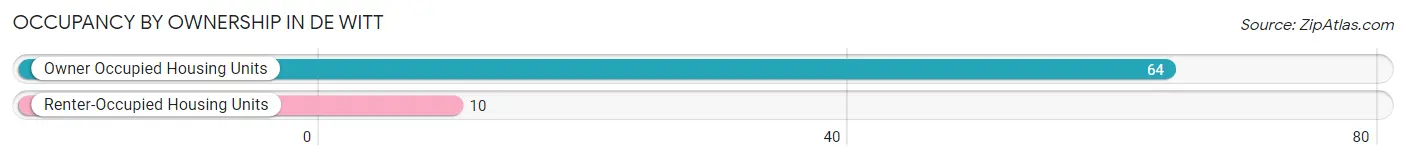
| Occupancy | # Housing Units | % Housing Units |
| Owner Occupied Housing Units | 64 | 86.5% |
| Renter-Occupied Housing Units | 10 | 13.5% |
| Total Occupied Housing Units | 74 | 100.0% |
Occupancy by Household Size in De Witt
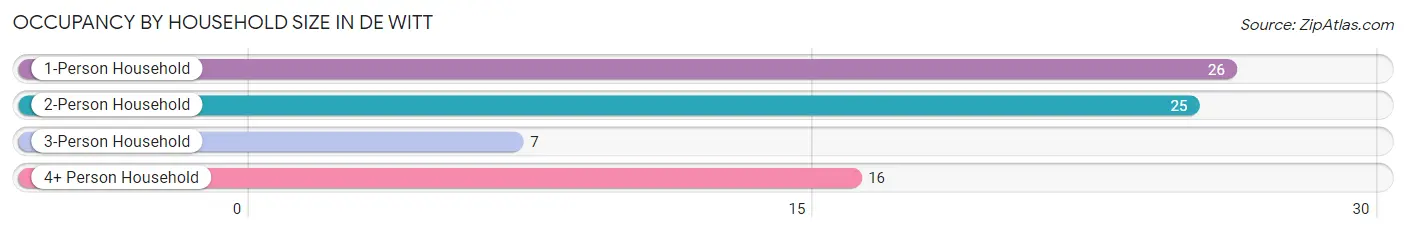
| Household Size | # Housing Units | % Housing Units |
| 1-Person Household | 26 | 35.1% |
| 2-Person Household | 25 | 33.8% |
| 3-Person Household | 7 | 9.5% |
| 4+ Person Household | 16 | 21.6% |
| Total Housing Units | 74 | 100.0% |
Occupancy by Ownership by Household Size in De Witt
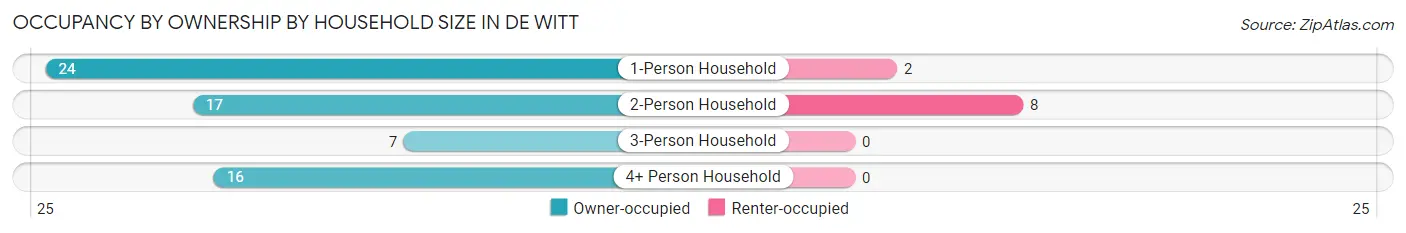
| Household Size | Owner-occupied | Renter-occupied |
| 1-Person Household | 24 (92.3%) | 2 (7.7%) |
| 2-Person Household | 17 (68.0%) | 8 (32.0%) |
| 3-Person Household | 7 (100.0%) | 0 (0.0%) |
| 4+ Person Household | 16 (100.0%) | 0 (0.0%) |
| Total Housing Units | 64 (86.5%) | 10 (13.5%) |
Occupancy by Educational Attainment in De Witt
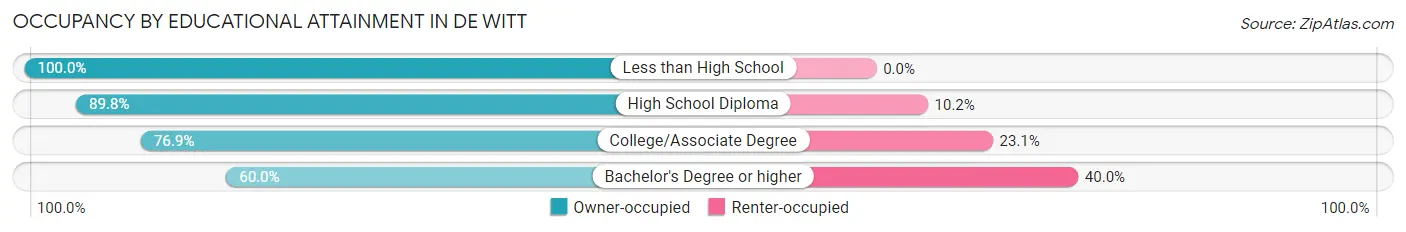
| Household Size | Owner-occupied | Renter-occupied |
| Less than High School | 7 (100.0%) | 0 (0.0%) |
| High School Diploma | 44 (89.8%) | 5 (10.2%) |
| College/Associate Degree | 10 (76.9%) | 3 (23.1%) |
| Bachelor's Degree or higher | 3 (60.0%) | 2 (40.0%) |
Occupancy by Age of Householder in De Witt
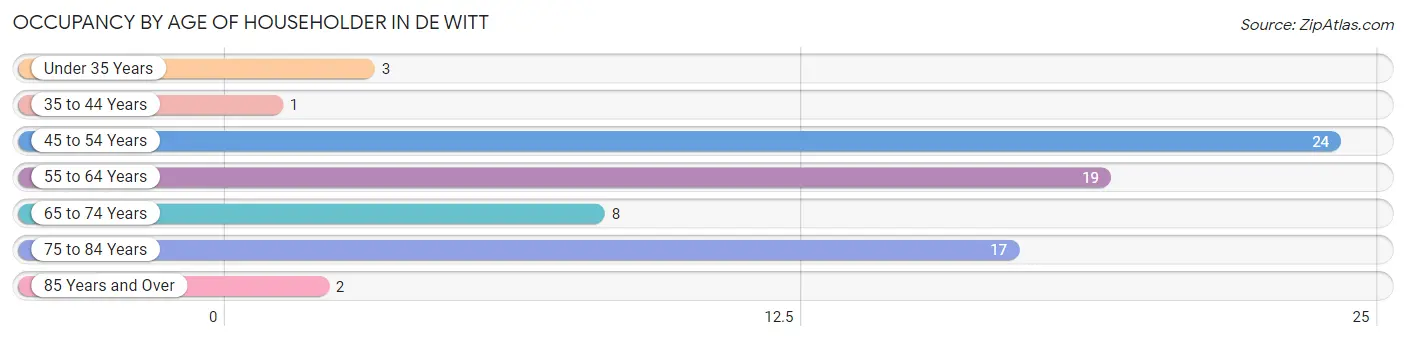
| Age Bracket | # Households | % Households |
| Under 35 Years | 3 | 4.1% |
| 35 to 44 Years | 1 | 1.3% |
| 45 to 54 Years | 24 | 32.4% |
| 55 to 64 Years | 19 | 25.7% |
| 65 to 74 Years | 8 | 10.8% |
| 75 to 84 Years | 17 | 23.0% |
| 85 Years and Over | 2 | 2.7% |
| Total | 74 | 100.0% |
Housing Finances in De Witt
Median Income by Occupancy in De Witt
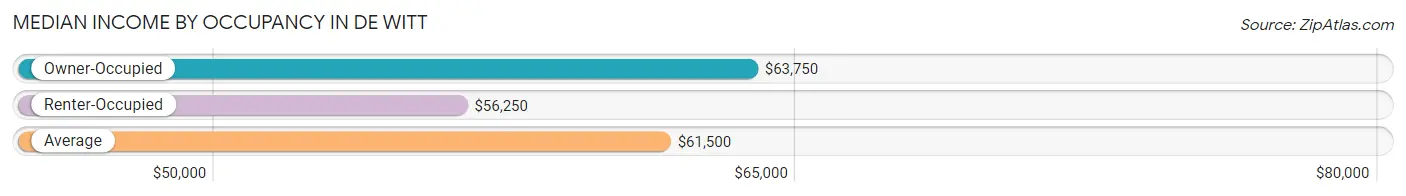
| Occupancy Type | # Households | Median Income |
| Owner-Occupied | 64 (86.5%) | $63,750 |
| Renter-Occupied | 10 (13.5%) | $56,250 |
| Average | 74 (100.0%) | $61,500 |
Occupancy by Householder Income Bracket in De Witt
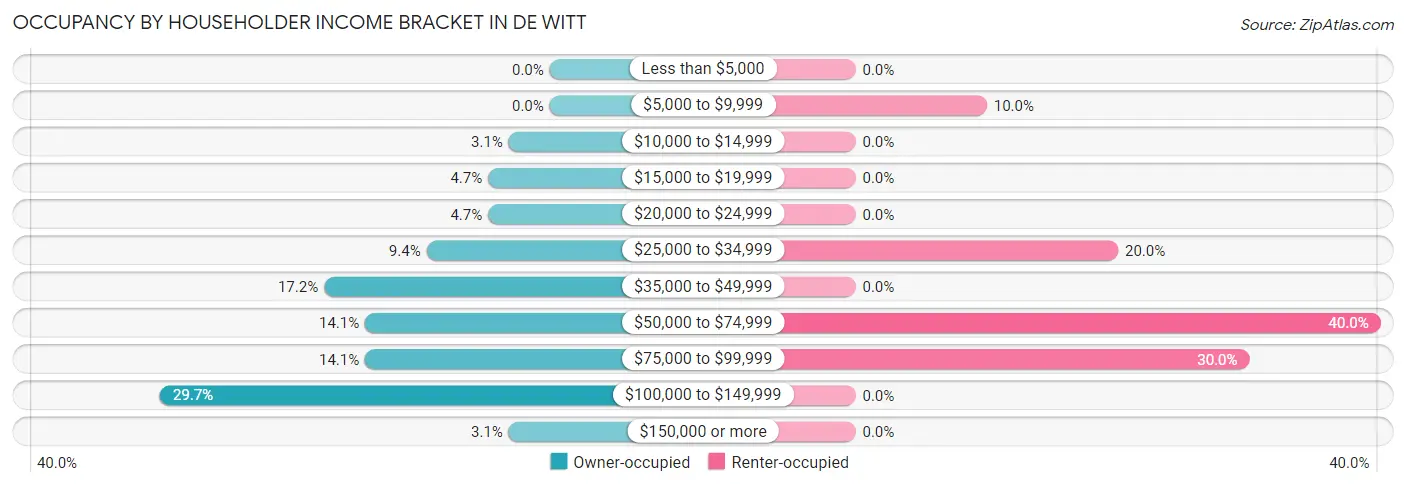
| Income Bracket | Owner-occupied | Renter-occupied |
| Less than $5,000 | 0 (0.0%) | 0 (0.0%) |
| $5,000 to $9,999 | 0 (0.0%) | 1 (10.0%) |
| $10,000 to $14,999 | 2 (3.1%) | 0 (0.0%) |
| $15,000 to $19,999 | 3 (4.7%) | 0 (0.0%) |
| $20,000 to $24,999 | 3 (4.7%) | 0 (0.0%) |
| $25,000 to $34,999 | 6 (9.4%) | 2 (20.0%) |
| $35,000 to $49,999 | 11 (17.2%) | 0 (0.0%) |
| $50,000 to $74,999 | 9 (14.1%) | 4 (40.0%) |
| $75,000 to $99,999 | 9 (14.1%) | 3 (30.0%) |
| $100,000 to $149,999 | 19 (29.7%) | 0 (0.0%) |
| $150,000 or more | 2 (3.1%) | 0 (0.0%) |
| Total | 64 (100.0%) | 10 (100.0%) |
Monthly Housing Cost Tiers in De Witt
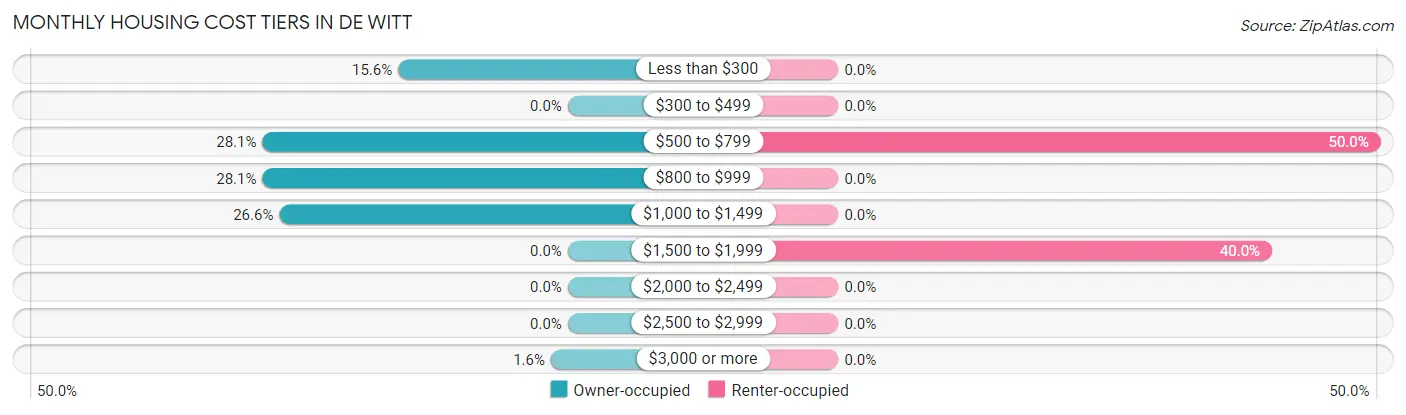
| Monthly Cost | Owner-occupied | Renter-occupied |
| Less than $300 | 10 (15.6%) | 0 (0.0%) |
| $300 to $499 | 0 (0.0%) | 0 (0.0%) |
| $500 to $799 | 18 (28.1%) | 5 (50.0%) |
| $800 to $999 | 18 (28.1%) | 0 (0.0%) |
| $1,000 to $1,499 | 17 (26.6%) | 0 (0.0%) |
| $1,500 to $1,999 | 0 (0.0%) | 4 (40.0%) |
| $2,000 to $2,499 | 0 (0.0%) | 0 (0.0%) |
| $2,500 to $2,999 | 0 (0.0%) | 0 (0.0%) |
| $3,000 or more | 1 (1.6%) | 0 (0.0%) |
| Total | 64 (100.0%) | 10 (100.0%) |
Physical Housing Characteristics in De Witt
Housing Structures in De Witt
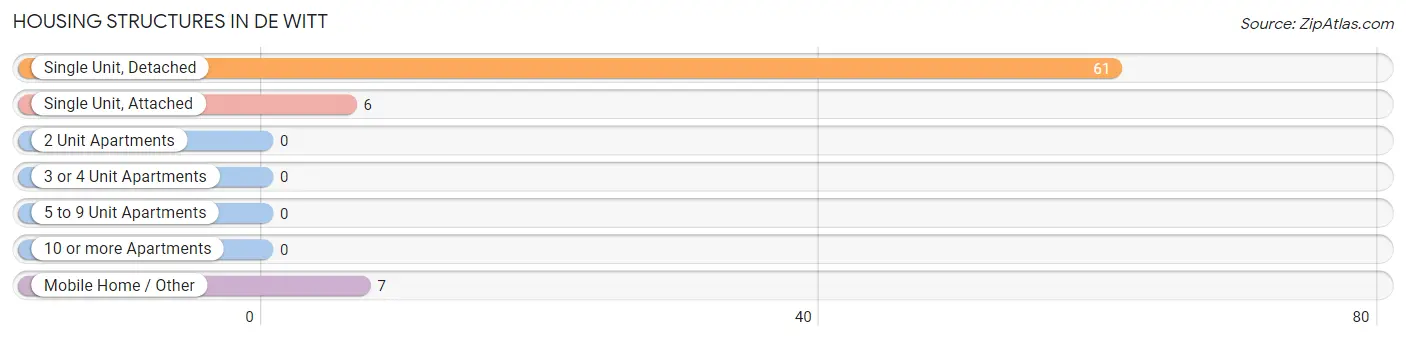
| Structure Type | # Housing Units | % Housing Units |
| Single Unit, Detached | 61 | 82.4% |
| Single Unit, Attached | 6 | 8.1% |
| 2 Unit Apartments | 0 | 0.0% |
| 3 or 4 Unit Apartments | 0 | 0.0% |
| 5 to 9 Unit Apartments | 0 | 0.0% |
| 10 or more Apartments | 0 | 0.0% |
| Mobile Home / Other | 7 | 9.5% |
| Total | 74 | 100.0% |
Housing Structures by Occupancy in De Witt
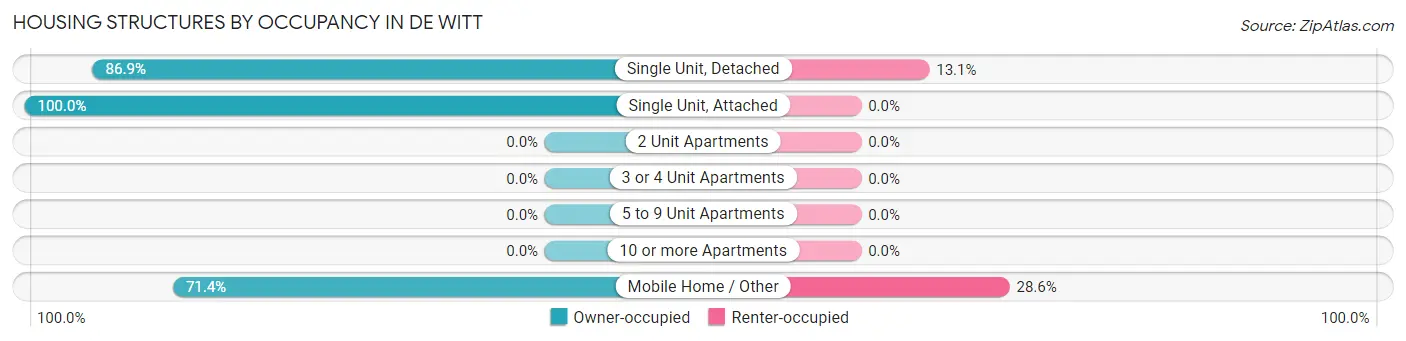
| Structure Type | Owner-occupied | Renter-occupied |
| Single Unit, Detached | 53 (86.9%) | 8 (13.1%) |
| Single Unit, Attached | 6 (100.0%) | 0 (0.0%) |
| 2 Unit Apartments | 0 (0.0%) | 0 (0.0%) |
| 3 or 4 Unit Apartments | 0 (0.0%) | 0 (0.0%) |
| 5 to 9 Unit Apartments | 0 (0.0%) | 0 (0.0%) |
| 10 or more Apartments | 0 (0.0%) | 0 (0.0%) |
| Mobile Home / Other | 5 (71.4%) | 2 (28.6%) |
| Total | 64 (86.5%) | 10 (13.5%) |
Housing Structures by Number of Rooms in De Witt
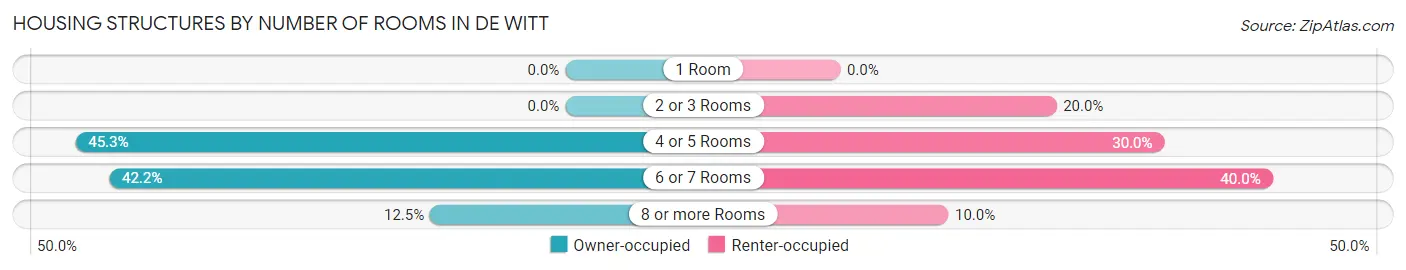
| Number of Rooms | Owner-occupied | Renter-occupied |
| 1 Room | 0 (0.0%) | 0 (0.0%) |
| 2 or 3 Rooms | 0 (0.0%) | 2 (20.0%) |
| 4 or 5 Rooms | 29 (45.3%) | 3 (30.0%) |
| 6 or 7 Rooms | 27 (42.2%) | 4 (40.0%) |
| 8 or more Rooms | 8 (12.5%) | 1 (10.0%) |
| Total | 64 (100.0%) | 10 (100.0%) |
Housing Structure by Heating Type in De Witt
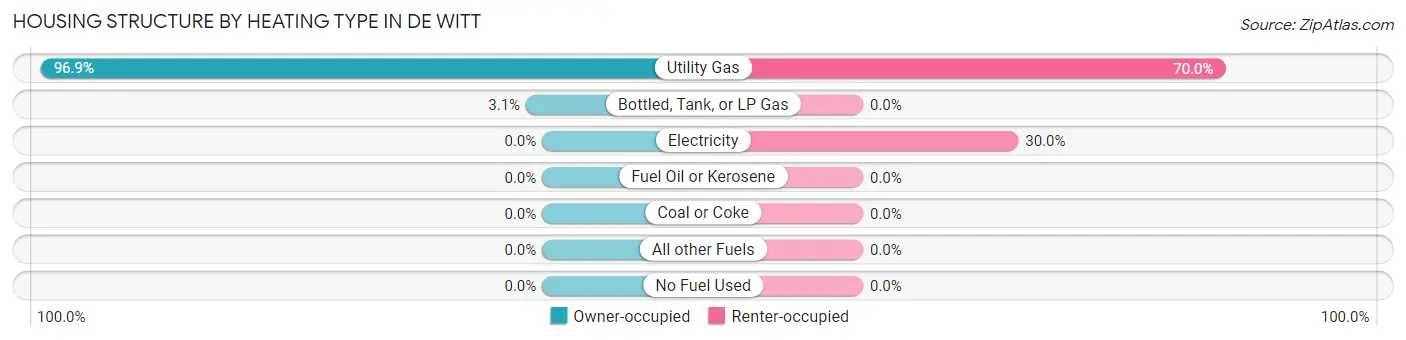
| Heating Type | Owner-occupied | Renter-occupied |
| Utility Gas | 62 (96.9%) | 7 (70.0%) |
| Bottled, Tank, or LP Gas | 2 (3.1%) | 0 (0.0%) |
| Electricity | 0 (0.0%) | 3 (30.0%) |
| Fuel Oil or Kerosene | 0 (0.0%) | 0 (0.0%) |
| Coal or Coke | 0 (0.0%) | 0 (0.0%) |
| All other Fuels | 0 (0.0%) | 0 (0.0%) |
| No Fuel Used | 0 (0.0%) | 0 (0.0%) |
| Total | 64 (100.0%) | 10 (100.0%) |
Household Vehicle Usage in De Witt
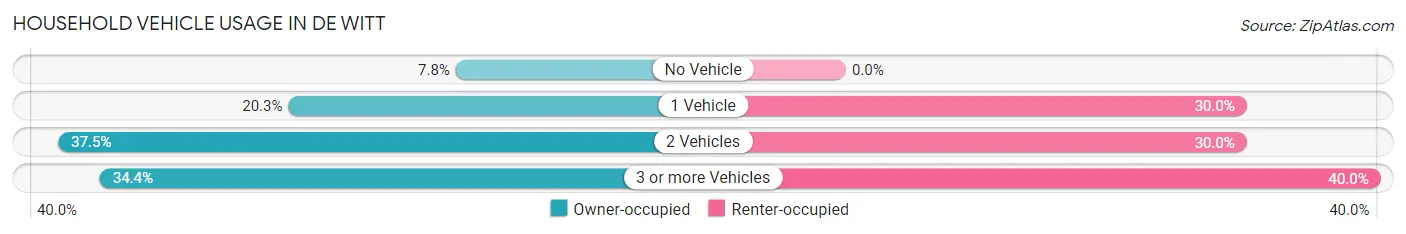
| Vehicles per Household | Owner-occupied | Renter-occupied |
| No Vehicle | 5 (7.8%) | 0 (0.0%) |
| 1 Vehicle | 13 (20.3%) | 3 (30.0%) |
| 2 Vehicles | 24 (37.5%) | 3 (30.0%) |
| 3 or more Vehicles | 22 (34.4%) | 4 (40.0%) |
| Total | 64 (100.0%) | 10 (100.0%) |
Real Estate & Mortgages in De Witt
Real Estate and Mortgage Overview in De Witt
| Characteristic | Without Mortgage | With Mortgage |
| Housing Units | 19 | 45 |
| Median Property Value | $106,300 | $92,500 |
| Median Household Income | $46,250 | $0 |
| Monthly Housing Costs | - | - |
| Real Estate Taxes | - | - |
Property Value by Mortgage Status in De Witt
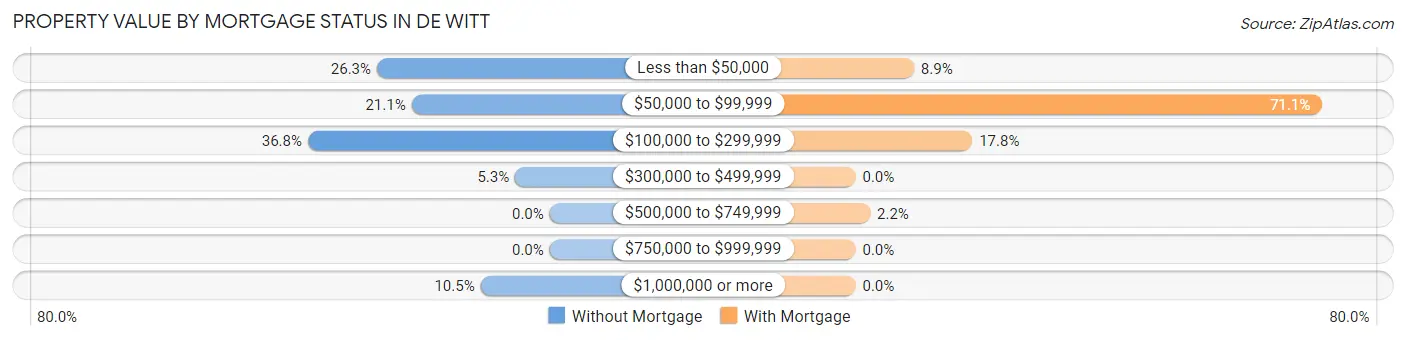
| Property Value | Without Mortgage | With Mortgage |
| Less than $50,000 | 5 (26.3%) | 4 (8.9%) |
| $50,000 to $99,999 | 4 (21.0%) | 32 (71.1%) |
| $100,000 to $299,999 | 7 (36.8%) | 8 (17.8%) |
| $300,000 to $499,999 | 1 (5.3%) | 0 (0.0%) |
| $500,000 to $749,999 | 0 (0.0%) | 1 (2.2%) |
| $750,000 to $999,999 | 0 (0.0%) | 0 (0.0%) |
| $1,000,000 or more | 2 (10.5%) | 0 (0.0%) |
| Total | 19 (100.0%) | 45 (100.0%) |
Household Income by Mortgage Status in De Witt
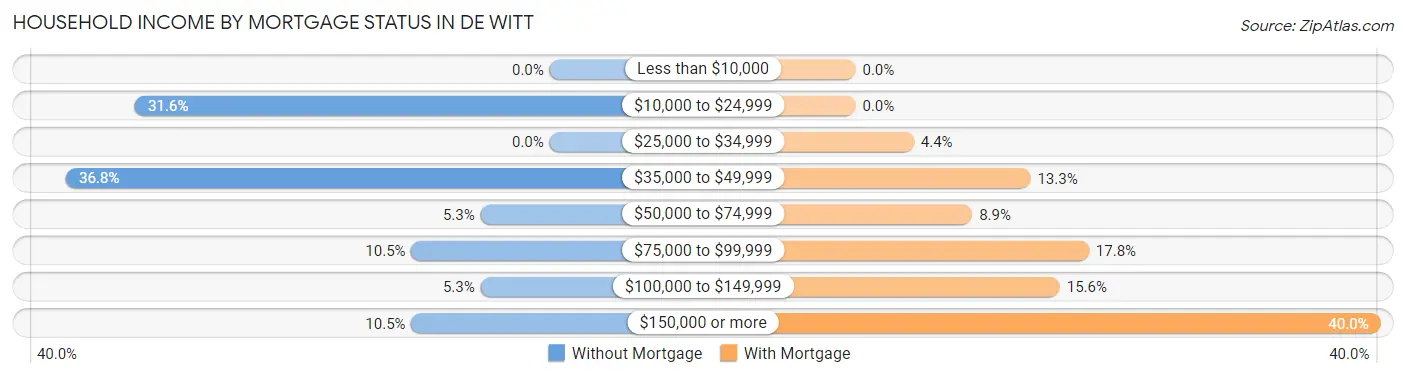
| Household Income | Without Mortgage | With Mortgage |
| Less than $10,000 | 0 (0.0%) | 0 (0.0%) |
| $10,000 to $24,999 | 6 (31.6%) | 0 (0.0%) |
| $25,000 to $34,999 | 0 (0.0%) | 2 (4.4%) |
| $35,000 to $49,999 | 7 (36.8%) | 6 (13.3%) |
| $50,000 to $74,999 | 1 (5.3%) | 4 (8.9%) |
| $75,000 to $99,999 | 2 (10.5%) | 8 (17.8%) |
| $100,000 to $149,999 | 1 (5.3%) | 7 (15.6%) |
| $150,000 or more | 2 (10.5%) | 18 (40.0%) |
| Total | 19 (100.0%) | 45 (100.0%) |
Property Value to Household Income Ratio in De Witt
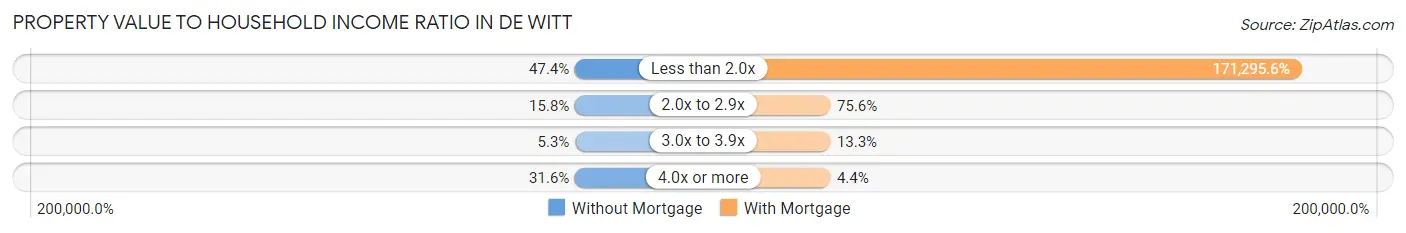
| Value-to-Income Ratio | Without Mortgage | With Mortgage |
| Less than 2.0x | 9 (47.4%) | 77,083 (171,295.6%) |
| 2.0x to 2.9x | 3 (15.8%) | 34 (75.6%) |
| 3.0x to 3.9x | 1 (5.3%) | 6 (13.3%) |
| 4.0x or more | 6 (31.6%) | 2 (4.4%) |
| Total | 19 (100.0%) | 45 (100.0%) |
Real Estate Taxes by Mortgage Status in De Witt
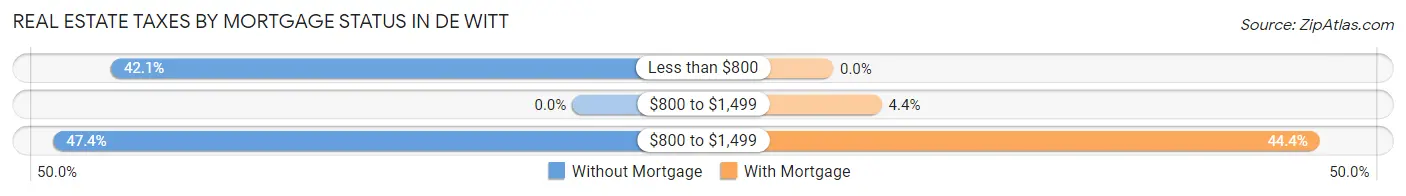
| Property Taxes | Without Mortgage | With Mortgage |
| Less than $800 | 8 (42.1%) | 0 (0.0%) |
| $800 to $1,499 | 0 (0.0%) | 2 (4.4%) |
| $800 to $1,499 | 9 (47.4%) | 20 (44.4%) |
| Total | 19 (100.0%) | 45 (100.0%) |
Health & Disability in De Witt
Health Insurance Coverage by Age in De Witt
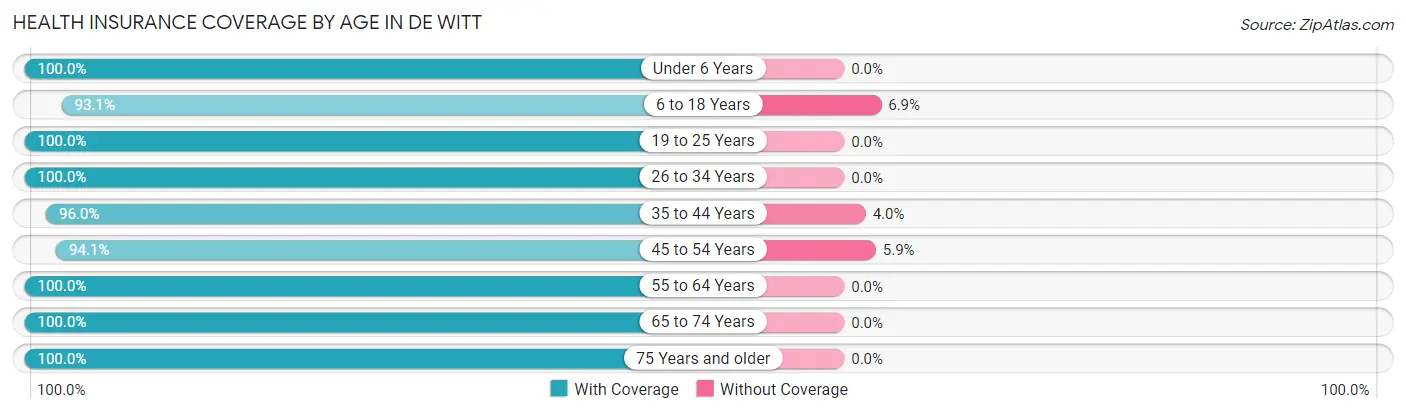
| Age Bracket | With Coverage | Without Coverage |
| Under 6 Years | 18 (100.0%) | 0 (0.0%) |
| 6 to 18 Years | 27 (93.1%) | 2 (6.9%) |
| 19 to 25 Years | 5 (100.0%) | 0 (0.0%) |
| 26 to 34 Years | 2 (100.0%) | 0 (0.0%) |
| 35 to 44 Years | 24 (96.0%) | 1 (4.0%) |
| 45 to 54 Years | 32 (94.1%) | 2 (5.9%) |
| 55 to 64 Years | 40 (100.0%) | 0 (0.0%) |
| 65 to 74 Years | 14 (100.0%) | 0 (0.0%) |
| 75 Years and older | 20 (100.0%) | 0 (0.0%) |
| Total | 182 (97.3%) | 5 (2.7%) |
Health Insurance Coverage by Citizenship Status in De Witt
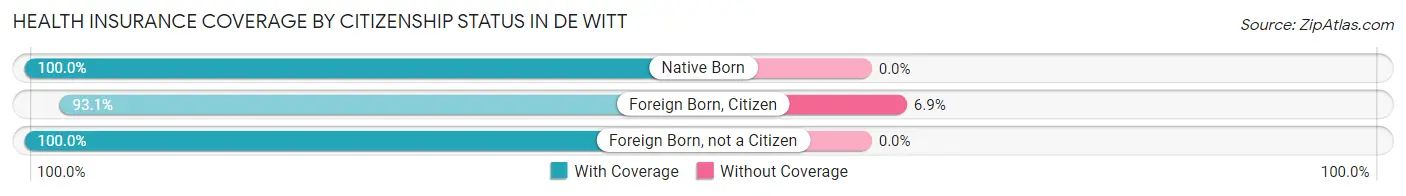
| Citizenship Status | With Coverage | Without Coverage |
| Native Born | 18 (100.0%) | 0 (0.0%) |
| Foreign Born, Citizen | 27 (93.1%) | 2 (6.9%) |
| Foreign Born, not a Citizen | 5 (100.0%) | 0 (0.0%) |
Health Insurance Coverage by Household Income in De Witt
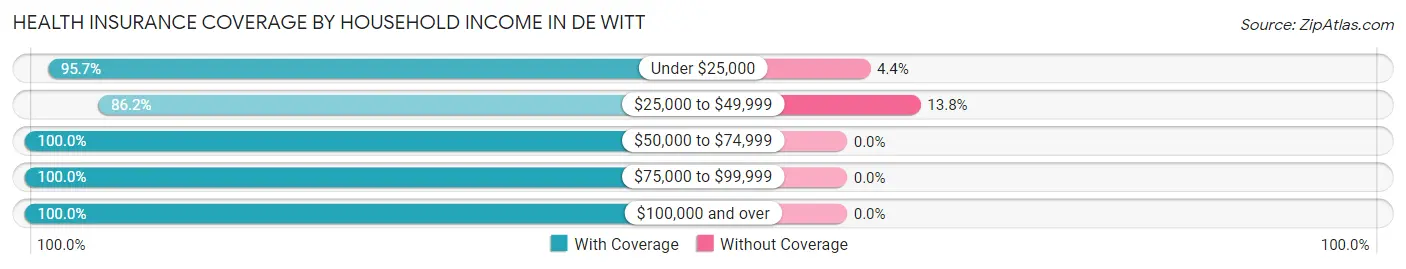
| Household Income | With Coverage | Without Coverage |
| Under $25,000 | 22 (95.7%) | 1 (4.3%) |
| $25,000 to $49,999 | 25 (86.2%) | 4 (13.8%) |
| $50,000 to $74,999 | 21 (100.0%) | 0 (0.0%) |
| $75,000 to $99,999 | 34 (100.0%) | 0 (0.0%) |
| $100,000 and over | 80 (100.0%) | 0 (0.0%) |
Public vs Private Health Insurance Coverage by Age in De Witt
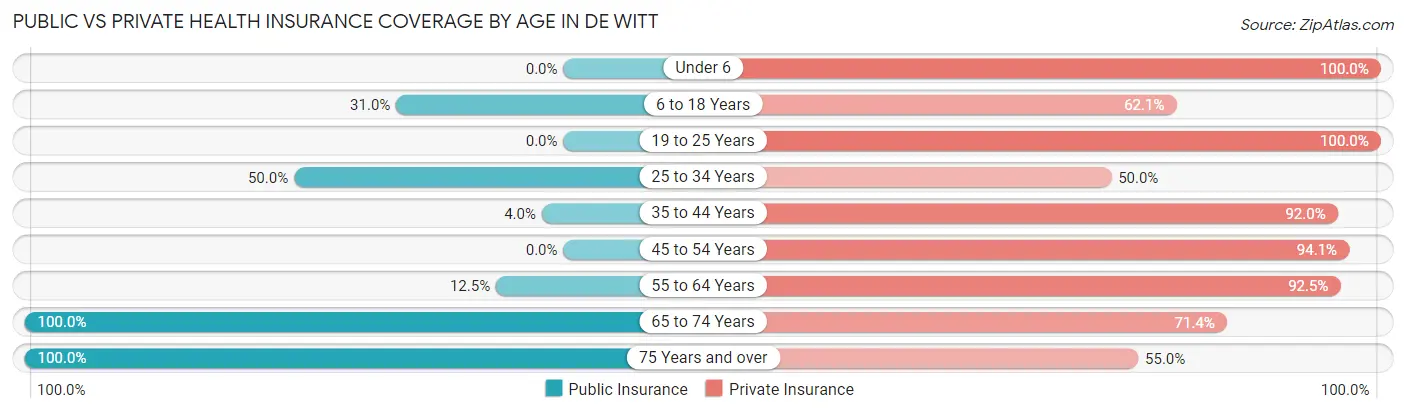
| Age Bracket | Public Insurance | Private Insurance |
| Under 6 | 0 (0.0%) | 18 (100.0%) |
| 6 to 18 Years | 9 (31.0%) | 18 (62.1%) |
| 19 to 25 Years | 0 (0.0%) | 5 (100.0%) |
| 25 to 34 Years | 1 (50.0%) | 1 (50.0%) |
| 35 to 44 Years | 1 (4.0%) | 23 (92.0%) |
| 45 to 54 Years | 0 (0.0%) | 32 (94.1%) |
| 55 to 64 Years | 5 (12.5%) | 37 (92.5%) |
| 65 to 74 Years | 14 (100.0%) | 10 (71.4%) |
| 75 Years and over | 20 (100.0%) | 11 (55.0%) |
| Total | 50 (26.7%) | 155 (82.9%) |
Disability Status by Sex by Age in De Witt
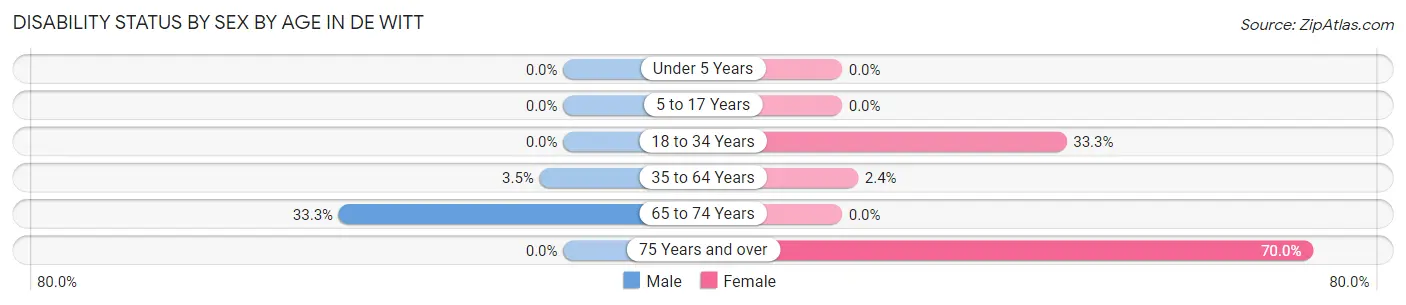
| Age Bracket | Male | Female |
| Under 5 Years | 0 (0.0%) | 0 (0.0%) |
| 5 to 17 Years | 0 (0.0%) | 0 (0.0%) |
| 18 to 34 Years | 0 (0.0%) | 1 (33.3%) |
| 35 to 64 Years | 2 (3.5%) | 1 (2.4%) |
| 65 to 74 Years | 4 (33.3%) | 0 (0.0%) |
| 75 Years and over | 0 (0.0%) | 7 (70.0%) |
Disability Class by Sex by Age in De Witt
Disability Class: Hearing Difficulty
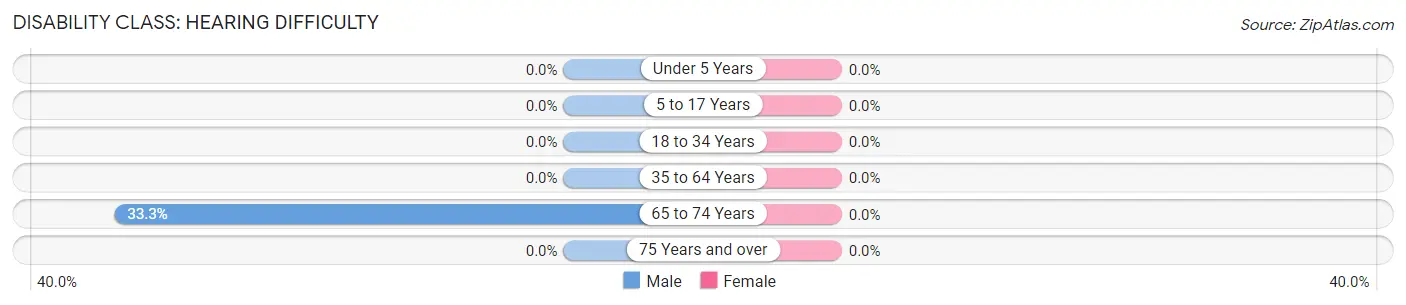
| Age Bracket | Male | Female |
| Under 5 Years | 0 (0.0%) | 0 (0.0%) |
| 5 to 17 Years | 0 (0.0%) | 0 (0.0%) |
| 18 to 34 Years | 0 (0.0%) | 0 (0.0%) |
| 35 to 64 Years | 0 (0.0%) | 0 (0.0%) |
| 65 to 74 Years | 4 (33.3%) | 0 (0.0%) |
| 75 Years and over | 0 (0.0%) | 0 (0.0%) |
Disability Class: Vision Difficulty
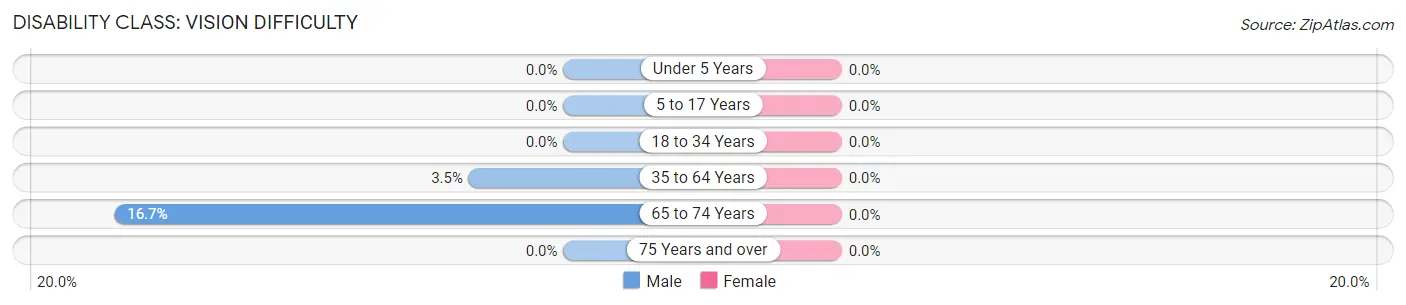
| Age Bracket | Male | Female |
| Under 5 Years | 0 (0.0%) | 0 (0.0%) |
| 5 to 17 Years | 0 (0.0%) | 0 (0.0%) |
| 18 to 34 Years | 0 (0.0%) | 0 (0.0%) |
| 35 to 64 Years | 2 (3.5%) | 0 (0.0%) |
| 65 to 74 Years | 2 (16.7%) | 0 (0.0%) |
| 75 Years and over | 0 (0.0%) | 0 (0.0%) |
Disability Class: Cognitive Difficulty
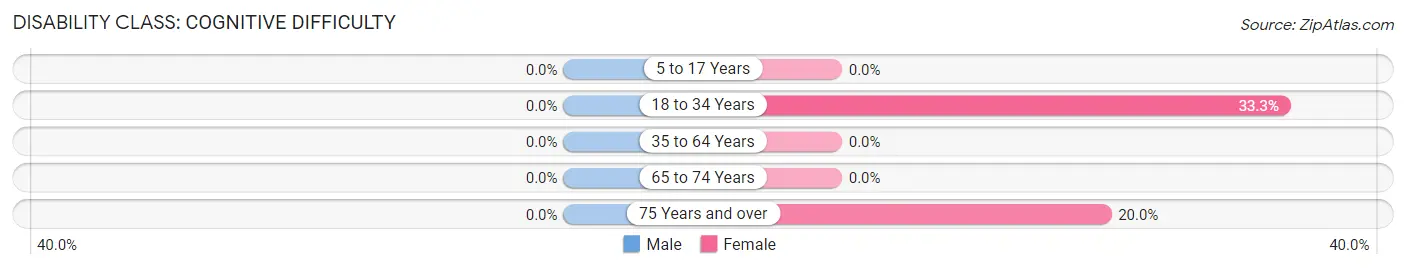
| Age Bracket | Male | Female |
| 5 to 17 Years | 0 (0.0%) | 0 (0.0%) |
| 18 to 34 Years | 0 (0.0%) | 1 (33.3%) |
| 35 to 64 Years | 0 (0.0%) | 0 (0.0%) |
| 65 to 74 Years | 0 (0.0%) | 0 (0.0%) |
| 75 Years and over | 0 (0.0%) | 2 (20.0%) |
Disability Class: Ambulatory Difficulty
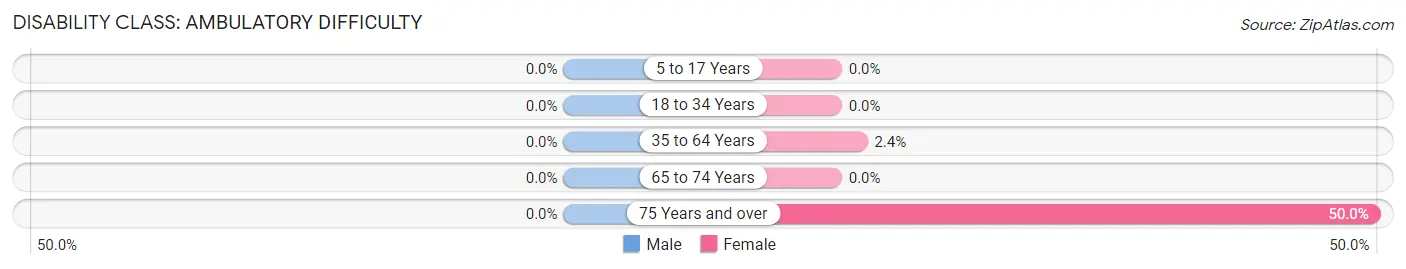
| Age Bracket | Male | Female |
| 5 to 17 Years | 0 (0.0%) | 0 (0.0%) |
| 18 to 34 Years | 0 (0.0%) | 0 (0.0%) |
| 35 to 64 Years | 0 (0.0%) | 1 (2.4%) |
| 65 to 74 Years | 0 (0.0%) | 0 (0.0%) |
| 75 Years and over | 0 (0.0%) | 5 (50.0%) |
Disability Class: Self-Care Difficulty
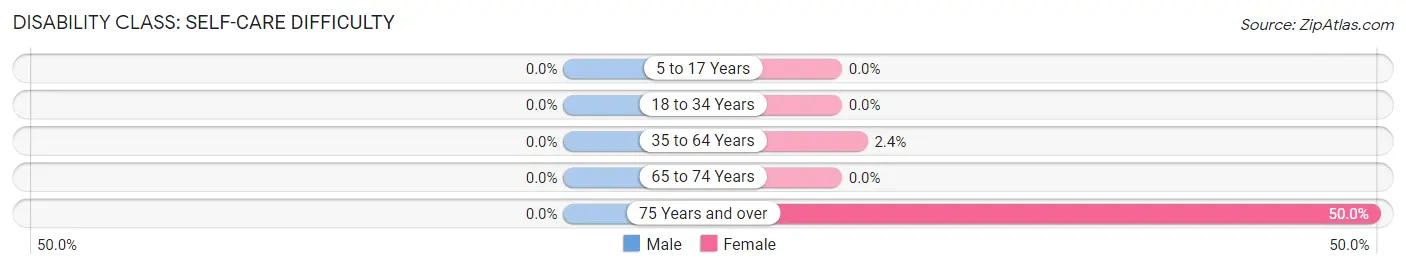
| Age Bracket | Male | Female |
| 5 to 17 Years | 0 (0.0%) | 0 (0.0%) |
| 18 to 34 Years | 0 (0.0%) | 0 (0.0%) |
| 35 to 64 Years | 0 (0.0%) | 1 (2.4%) |
| 65 to 74 Years | 0 (0.0%) | 0 (0.0%) |
| 75 Years and over | 0 (0.0%) | 5 (50.0%) |
Technology Access in De Witt
Computing Device Access in De Witt
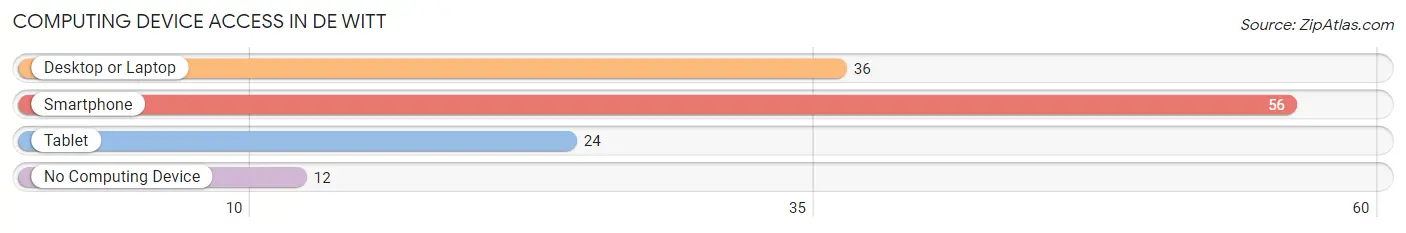
| Device Type | # Households | % Households |
| Desktop or Laptop | 36 | 48.6% |
| Smartphone | 56 | 75.7% |
| Tablet | 24 | 32.4% |
| No Computing Device | 12 | 16.2% |
| Total | 74 | 100.0% |
Internet Access in De Witt
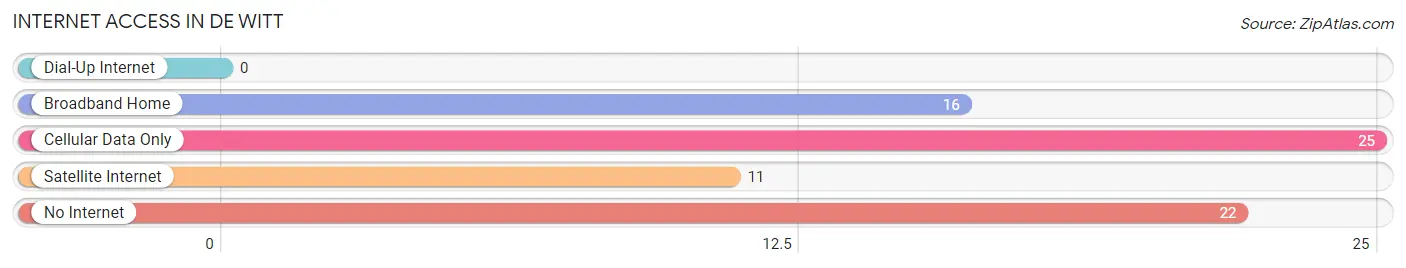
| Internet Type | # Households | % Households |
| Dial-Up Internet | 0 | 0.0% |
| Broadband Home | 16 | 21.6% |
| Cellular Data Only | 25 | 33.8% |
| Satellite Internet | 11 | 14.9% |
| No Internet | 22 | 29.7% |
| Total | 74 | 100.0% |
De Witt Summary
De Witt, Illinois is a small city located in the central part of the state, in De Witt County. It is situated on the banks of the Sangamon River, and is part of the Decatur Metropolitan Statistical Area. The city has a population of approximately 5,000 people, and is the county seat of De Witt County.
History
De Witt was founded in 1836 by a group of settlers from Kentucky, led by William De Witt. The town was named after him, and was incorporated in 1837. The town was originally a farming community, and the main crops grown were corn, wheat, and oats. The town was also known for its brickyards, which produced bricks for many of the buildings in the area.
In the late 19th century, the town began to grow and develop. The railroad arrived in 1871, and the town became a major shipping center for the surrounding area. The town also became a center for manufacturing, with several factories being built in the area.
In the early 20th century, the town continued to grow and develop. The population increased, and the town became a center for education, with several schools being built in the area. The town also became a center for the arts, with several theaters and art galleries being built in the area.
Geography
De Witt is located in the central part of the state, in De Witt County. It is situated on the banks of the Sangamon River, and is part of the Decatur Metropolitan Statistical Area. The city has a total area of 4.2 square miles, all of which is land. The city is located in a flat, open area, with no major hills or mountains.
The climate in De Witt is humid continental, with hot, humid summers and cold, snowy winters. The average temperature in the summer is around 75 degrees Fahrenheit, and the average temperature in the winter is around 25 degrees Fahrenheit.
Economy
The economy of De Witt is largely based on agriculture and manufacturing. The town is home to several large farms, which produce corn, wheat, and oats. The town is also home to several factories, which produce a variety of products, including furniture, clothing, and electronics.
The town is also home to several small businesses, including restaurants, shops, and other services. The town is also home to several banks, which provide financial services to the residents of the town.
Demographics
As of the 2010 census, the population of De Witt was 5,068. The racial makeup of the town was 97.2% White, 0.7% African American, 0.2% Native American, 0.3% Asian, 0.1% Pacific Islander, 0.7% from other races, and 0.9% from two or more races. Hispanic or Latino of any race were 2.2% of the population.
The median income for a household in the town was $45,938, and the median income for a family was $54,938. The per capita income for the town was $21,938. About 8.2% of families and 10.2% of the population were below the poverty line, including 14.2% of those under age 18 and 6.2% of those age 65 or over.
Common Questions
What is Per Capita Income in De Witt?
Per Capita income in De Witt is $29,001.
What is the Median Family Income in De Witt?
Median Family Income in De Witt is $79,583.
What is the Median Household income in De Witt?
Median Household Income in De Witt is $61,500.
What is Inequality or Gini Index in De Witt?
Inequality or Gini Index in De Witt is 0.31.
What is the Total Population of De Witt?
Total Population of De Witt is 187.
What is the Total Male Population of De Witt?
Total Male Population of De Witt is 90.
What is the Total Female Population of De Witt?
Total Female Population of De Witt is 97.
What is the Ratio of Males per 100 Females in De Witt?
There are 92.78 Males per 100 Females in De Witt.
What is the Ratio of Females per 100 Males in De Witt?
There are 107.78 Females per 100 Males in De Witt.
What is the Median Population Age in De Witt?
Median Population Age in De Witt is 49.7 Years.
What is the Average Family Size in De Witt
Average Family Size in De Witt is 3.3 People.
What is the Average Household Size in De Witt
Average Household Size in De Witt is 2.5 People.
How Large is the Labor Force in De Witt?
There are 88 People in the Labor Forcein in De Witt.
What is the Percentage of People in the Labor Force in De Witt?
59.5% of People are in the Labor Force in De Witt.
What is the Unemployment Rate in De Witt?
Unemployment Rate in De Witt is 5.7%.