Zip Codes with the Highest Percentage of Population Employed in Office & Administration in Warren, OH
RELATED REPORTS & OPTIONS
Office & Administration
Warren
Compare Zip Codes
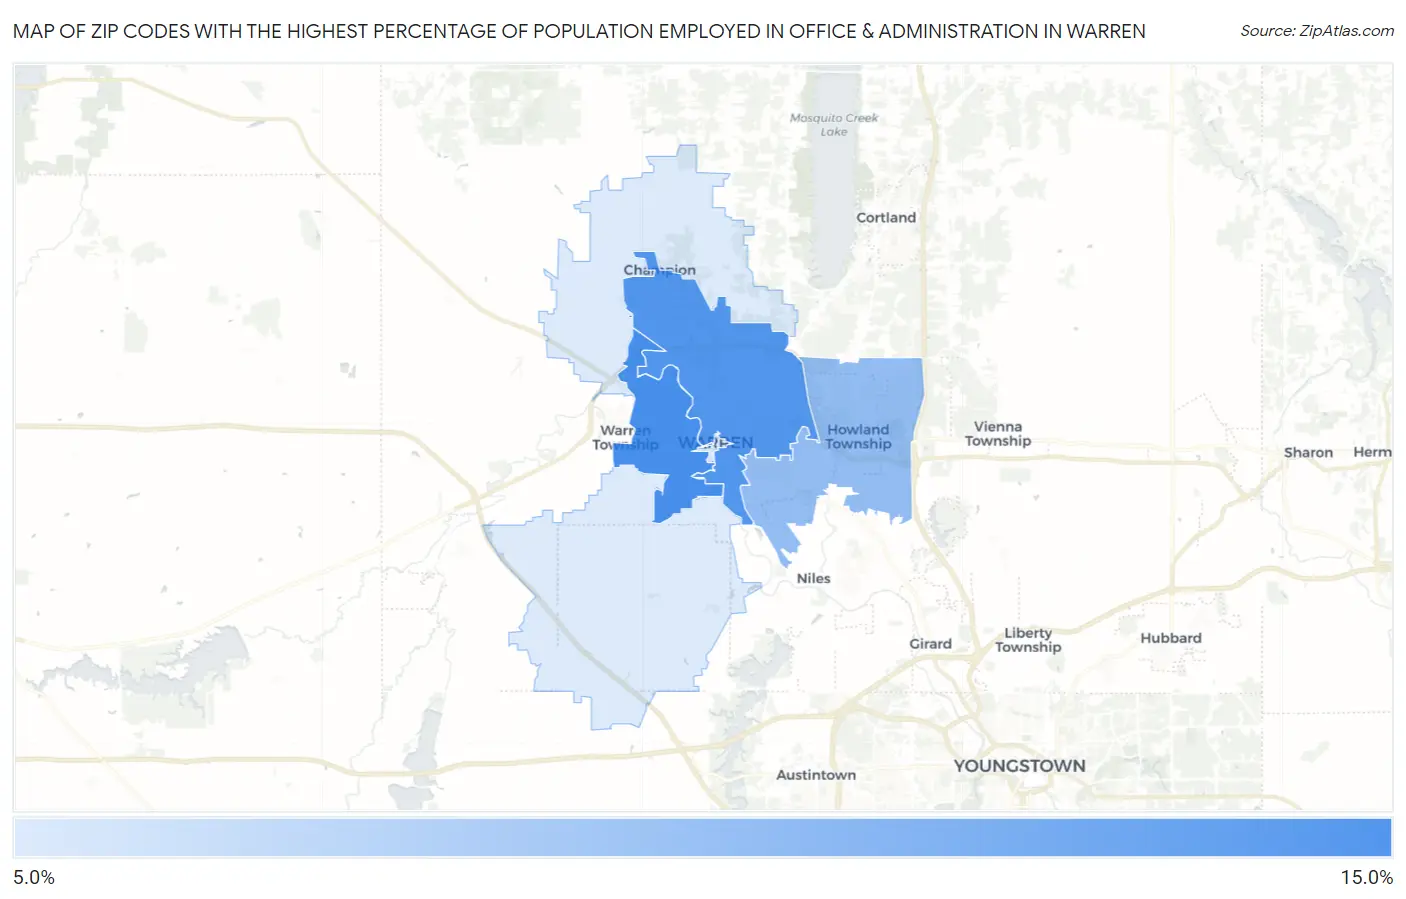
Map of Zip Codes with the Highest Percentage of Population Employed in Office & Administration in Warren
7.4%
14.0%
Zip Codes with the Highest Percentage of Population Employed in Office & Administration in Warren, OH
| Zip Code | % Employed | vs State | vs National | |
| 1. | 44485 | 14.0% | 11.3%(+2.75)#242 | 10.9%(+3.15)#6,006 |
| 2. | 44483 | 13.5% | 11.3%(+2.28)#279 | 10.9%(+2.68)#6,862 |
| 3. | 44484 | 10.6% | 11.3%(-0.687)#618 | 10.9%(-0.287)#15,238 |
| 4. | 44481 | 7.4% | 11.3%(-3.89)#937 | 10.9%(-3.49)#24,482 |
1
Common Questions
What are the Top 3 Zip Codes with the Highest Percentage of Population Employed in Office & Administration in Warren, OH?
Top 3 Zip Codes with the Highest Percentage of Population Employed in Office & Administration in Warren, OH are:
What zip code has the Highest Percentage of Population Employed in Office & Administration in Warren, OH?
44485 has the Highest Percentage of Population Employed in Office & Administration in Warren, OH with 14.0%.
What is the Percentage of Population Employed in Office & Administration in Warren, OH?
Percentage of Population Employed in Office & Administration in Warren is 12.5%.
What is the Percentage of Population Employed in Office & Administration in Ohio?
Percentage of Population Employed in Office & Administration in Ohio is 11.3%.
What is the Percentage of Population Employed in Office & Administration in the United States?
Percentage of Population Employed in Office & Administration in the United States is 10.9%.