Zip Codes with the Highest Percentage of Population Employed in Office & Administration in Youngstown, OH
RELATED REPORTS & OPTIONS
Office & Administration
Youngstown
Compare Zip Codes
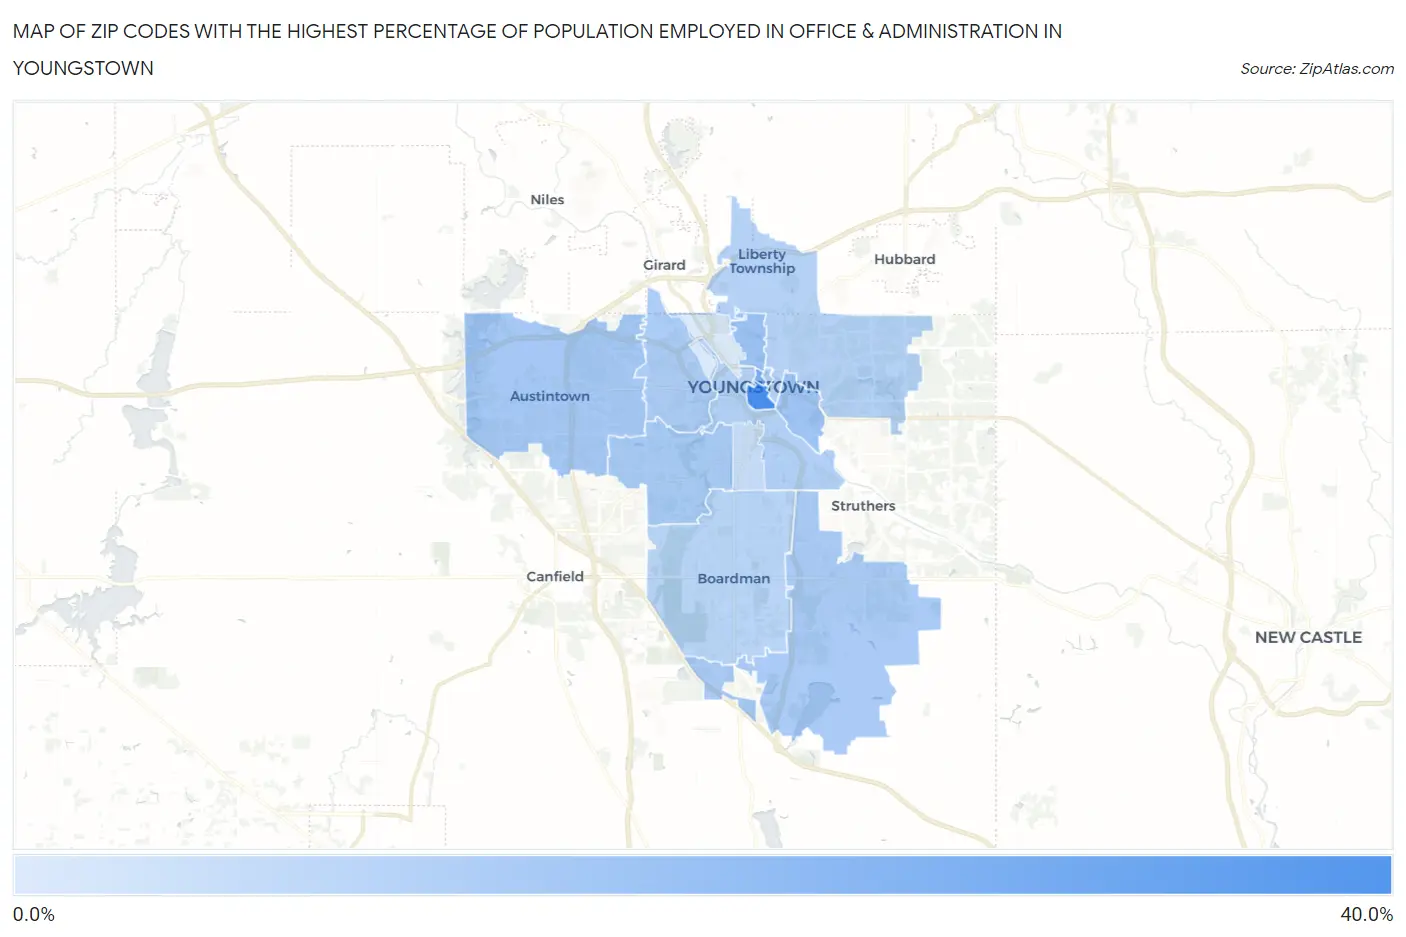
Map of Zip Codes with the Highest Percentage of Population Employed in Office & Administration in Youngstown
0.59%
38.7%
Zip Codes with the Highest Percentage of Population Employed in Office & Administration in Youngstown, OH
| Zip Code | % Employed | vs State | vs National | |
| 1. | 44503 | 38.7% | 11.3%(+27.4)#9 | 10.9%(+27.8)#290 |
| 2. | 44555 | 24.7% | 11.3%(+13.5)#28 | 10.9%(+13.9)#951 |
| 3. | 44504 | 16.1% | 11.3%(+4.82)#136 | 10.9%(+5.22)#3,500 |
| 4. | 44506 | 14.5% | 11.3%(+3.26)#204 | 10.9%(+3.66)#5,229 |
| 5. | 44515 | 13.4% | 11.3%(+2.15)#284 | 10.9%(+2.55)#7,134 |
| 6. | 44511 | 12.4% | 11.3%(+1.17)#362 | 10.9%(+1.57)#9,492 |
| 7. | 44514 | 12.1% | 11.3%(+0.826)#411 | 10.9%(+1.23)#10,489 |
| 8. | 44509 | 11.6% | 11.3%(+0.342)#471 | 10.9%(+0.742)#11,946 |
| 9. | 44502 | 10.1% | 11.3%(-1.12)#676 | 10.9%(-0.723)#16,692 |
| 10. | 44505 | 9.3% | 11.3%(-1.94)#766 | 10.9%(-1.54)#19,330 |
| 11. | 44512 | 8.2% | 11.3%(-3.01)#864 | 10.9%(-2.61)#22,385 |
| 12. | 44507 | 5.3% | 11.3%(-5.92)#1,067 | 10.9%(-5.52)#27,742 |
| 13. | 44510 | 0.59% | 11.3%(-10.7)#1,132 | 10.9%(-10.3)#30,432 |
1
Common Questions
What are the Top 10 Zip Codes with the Highest Percentage of Population Employed in Office & Administration in Youngstown, OH?
Top 10 Zip Codes with the Highest Percentage of Population Employed in Office & Administration in Youngstown, OH are:
What zip code has the Highest Percentage of Population Employed in Office & Administration in Youngstown, OH?
44503 has the Highest Percentage of Population Employed in Office & Administration in Youngstown, OH with 38.7%.
What is the Percentage of Population Employed in Office & Administration in Youngstown, OH?
Percentage of Population Employed in Office & Administration in Youngstown is 10.5%.
What is the Percentage of Population Employed in Office & Administration in Ohio?
Percentage of Population Employed in Office & Administration in Ohio is 11.3%.
What is the Percentage of Population Employed in Office & Administration in the United States?
Percentage of Population Employed in Office & Administration in the United States is 10.9%.