Mount Pleasant, OH Map & Demographics
Mount Pleasant Map
Mount Pleasant Overview
$33,134
PER CAPITA INCOME
$54,167
AVG FAMILY INCOME
$52,500
AVG HOUSEHOLD INCOME
53.2%
WAGE / INCOME GAP [ % ]
46.8¢/ $1
WAGE / INCOME GAP [ $ ]
0.46
INEQUALITY / GINI INDEX
291
TOTAL POPULATION
157
MALE POPULATION
134
FEMALE POPULATION
117.16
MALES / 100 FEMALES
85.35
FEMALES / 100 MALES
58.9
MEDIAN AGE
2.7
AVG FAMILY SIZE
2.1
AVG HOUSEHOLD SIZE
145
LABOR FORCE [ PEOPLE ]
54.7%
PERCENT IN LABOR FORCE
10.3%
UNEMPLOYMENT RATE
Mount Pleasant Zip Codes
Income in Mount Pleasant
Income Overview in Mount Pleasant
Per Capita Income in Mount Pleasant is $33,134, while median incomes of families and households are $54,167 and $52,500 respectively.
| Characteristic | Number | Measure |
| Per Capita Income | 291 | $33,134 |
| Median Family Income | 84 | $54,167 |
| Mean Family Income | 84 | $63,474 |
| Median Household Income | 140 | $52,500 |
| Mean Household Income | 140 | $67,111 |
| Income Deficit | 84 | $0 |
| Wage / Income Gap (%) | 291 | 53.17% |
| Wage / Income Gap ($) | 291 | 46.83¢ per $1 |
| Gini / Inequality Index | 291 | 0.46 |
Earnings by Sex in Mount Pleasant
Average Earnings in Mount Pleasant are $26,250, $42,708 for men and $20,000 for women, a difference of 53.2%.
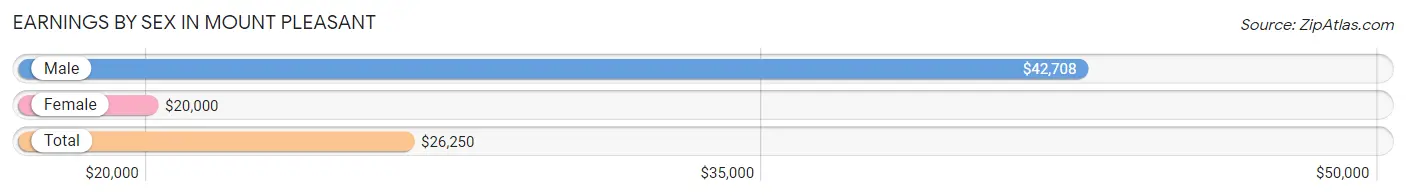
| Sex | Number | Average Earnings |
| Male | 89 (58.2%) | $42,708 |
| Female | 64 (41.8%) | $20,000 |
| Total | 153 (100.0%) | $26,250 |
Earnings by Sex by Income Bracket in Mount Pleasant
The most common earnings brackets in Mount Pleasant are $75,000 to $99,999 for men (15 | 16.9%) and $5,000 to $7,499 for women (8 | 12.5%).
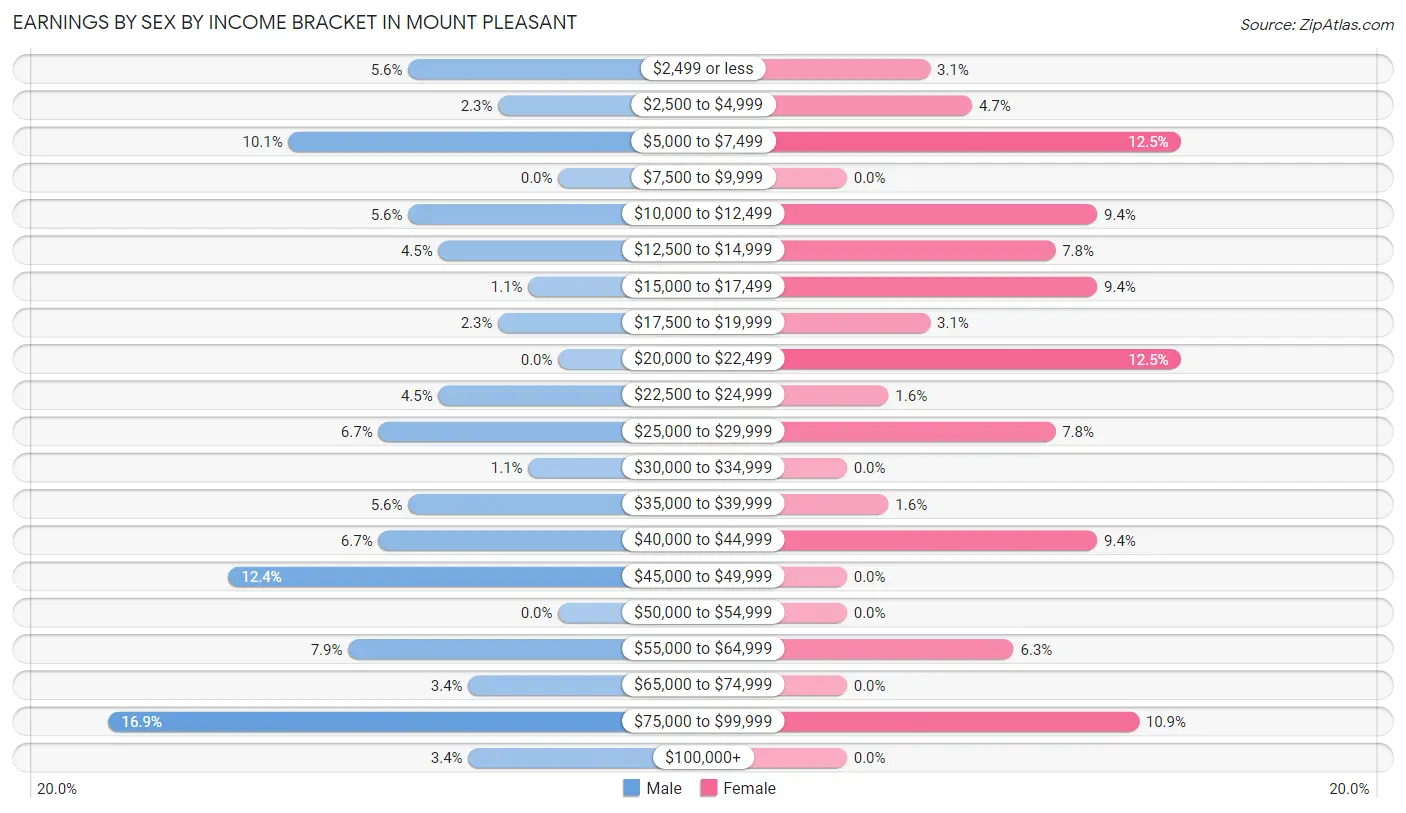
| Income | Male | Female |
| $2,499 or less | 5 (5.6%) | 2 (3.1%) |
| $2,500 to $4,999 | 2 (2.2%) | 3 (4.7%) |
| $5,000 to $7,499 | 9 (10.1%) | 8 (12.5%) |
| $7,500 to $9,999 | 0 (0.0%) | 0 (0.0%) |
| $10,000 to $12,499 | 5 (5.6%) | 6 (9.4%) |
| $12,500 to $14,999 | 4 (4.5%) | 5 (7.8%) |
| $15,000 to $17,499 | 1 (1.1%) | 6 (9.4%) |
| $17,500 to $19,999 | 2 (2.2%) | 2 (3.1%) |
| $20,000 to $22,499 | 0 (0.0%) | 8 (12.5%) |
| $22,500 to $24,999 | 4 (4.5%) | 1 (1.6%) |
| $25,000 to $29,999 | 6 (6.7%) | 5 (7.8%) |
| $30,000 to $34,999 | 1 (1.1%) | 0 (0.0%) |
| $35,000 to $39,999 | 5 (5.6%) | 1 (1.6%) |
| $40,000 to $44,999 | 6 (6.7%) | 6 (9.4%) |
| $45,000 to $49,999 | 11 (12.4%) | 0 (0.0%) |
| $50,000 to $54,999 | 0 (0.0%) | 0 (0.0%) |
| $55,000 to $64,999 | 7 (7.9%) | 4 (6.2%) |
| $65,000 to $74,999 | 3 (3.4%) | 0 (0.0%) |
| $75,000 to $99,999 | 15 (16.9%) | 7 (10.9%) |
| $100,000+ | 3 (3.4%) | 0 (0.0%) |
| Total | 89 (100.0%) | 64 (100.0%) |
Earnings by Sex by Educational Attainment in Mount Pleasant
Average earnings in Mount Pleasant are $45,227 for men and $20,938 for women, a difference of 53.7%. Men with an educational attainment of graduate degree enjoy the highest average annual earnings of $250,001, while those with high school diploma education earn the least with $43,500. Women with an educational attainment of graduate degree earn the most with the average annual earnings of $63,750, while those with college or associate's degree education have the smallest earnings of $11,667.
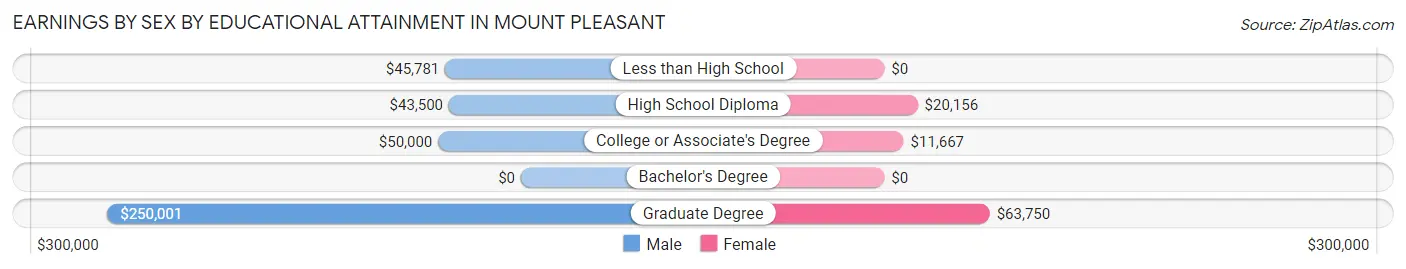
| Educational Attainment | Male Income | Female Income |
| Less than High School | $45,781 | $0 |
| High School Diploma | $43,500 | $20,156 |
| College or Associate's Degree | $50,000 | $11,667 |
| Bachelor's Degree | - | - |
| Graduate Degree | $250,001 | $63,750 |
| Total | $45,227 | $20,938 |
Family Income in Mount Pleasant
Family Income Brackets in Mount Pleasant
According to the Mount Pleasant family income data, there are 22 families falling into the $50,000 to $74,999 income range, which is the most common income bracket and makes up 26.2% of all families. Conversely, the $150,000 to $199,999 income bracket is the least frequent group with only 2 families (2.4%) belonging to this category.
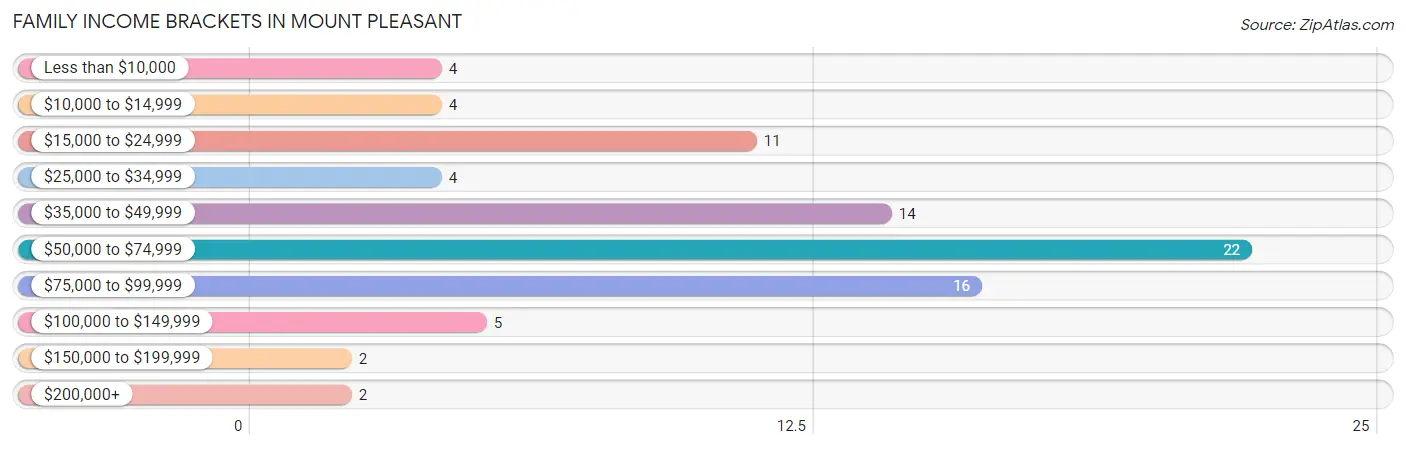
| Income Bracket | # Families | % Families |
| Less than $10,000 | 4 | 4.8% |
| $10,000 to $14,999 | 4 | 4.8% |
| $15,000 to $24,999 | 11 | 13.1% |
| $25,000 to $34,999 | 4 | 4.8% |
| $35,000 to $49,999 | 14 | 16.7% |
| $50,000 to $74,999 | 22 | 26.2% |
| $75,000 to $99,999 | 16 | 19.0% |
| $100,000 to $149,999 | 5 | 6.0% |
| $150,000 to $199,999 | 2 | 2.4% |
| $200,000+ | 2 | 2.4% |
Family Income by Famaliy Size in Mount Pleasant
4-person families (8 | 9.5%) account for the highest median family income in Mount Pleasant with $117,500 per family, while 4-person families (8 | 9.5%) have the highest median income of $29,375 per family member.
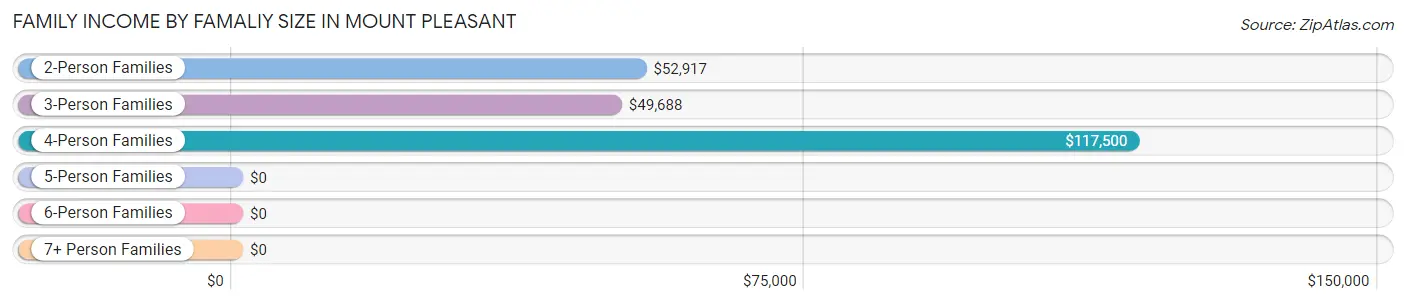
| Income Bracket | # Families | Median Income |
| 2-Person Families | 55 (65.5%) | $52,917 |
| 3-Person Families | 19 (22.6%) | $49,688 |
| 4-Person Families | 8 (9.5%) | $117,500 |
| 5-Person Families | 2 (2.4%) | $0 |
| 6-Person Families | 0 (0.0%) | $0 |
| 7+ Person Families | 0 (0.0%) | $0 |
| Total | 84 (100.0%) | $54,167 |
Family Income by Number of Earners in Mount Pleasant
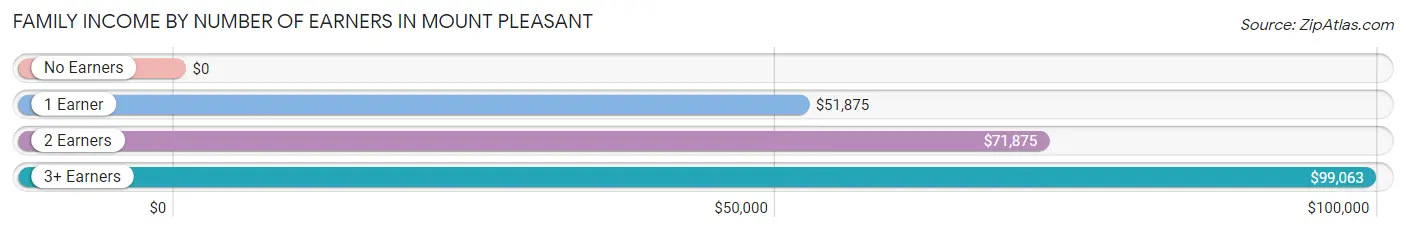
| Number of Earners | # Families | Median Income |
| No Earners | 26 (30.9%) | $0 |
| 1 Earner | 23 (27.4%) | $51,875 |
| 2 Earners | 26 (30.9%) | $71,875 |
| 3+ Earners | 9 (10.7%) | $99,063 |
| Total | 84 (100.0%) | $54,167 |
Household Income in Mount Pleasant
Household Income Brackets in Mount Pleasant
With 32 households falling in the category, the $75,000 to $99,999 income range is the most frequent in Mount Pleasant, accounting for 22.9% of all households.
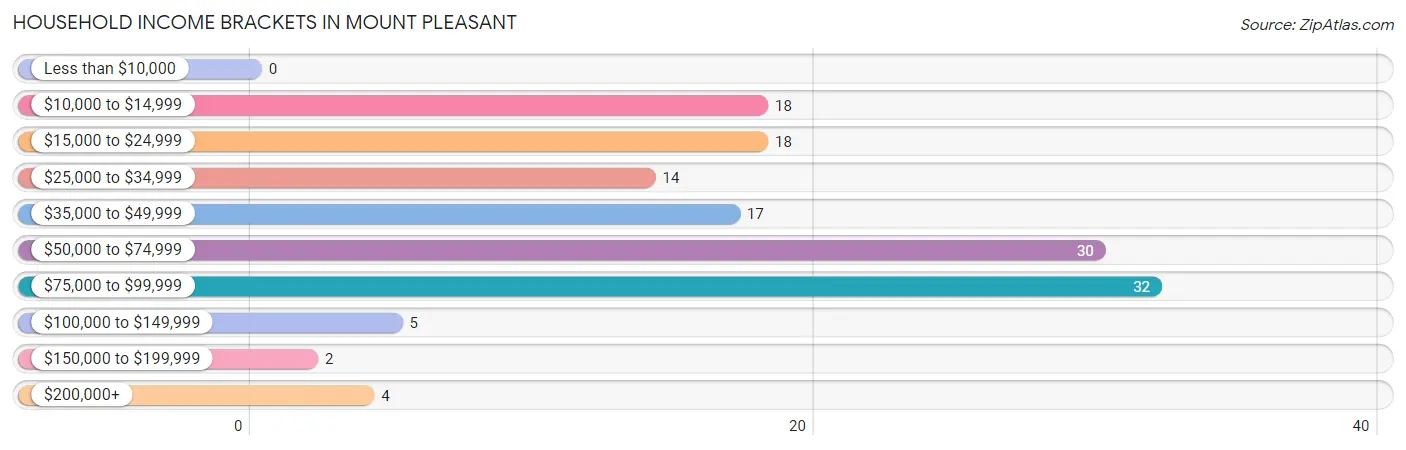
| Income Bracket | # Households | % Households |
| Less than $10,000 | 0 | 0.0% |
| $10,000 to $14,999 | 18 | 12.9% |
| $15,000 to $24,999 | 18 | 12.9% |
| $25,000 to $34,999 | 14 | 10.0% |
| $35,000 to $49,999 | 17 | 12.1% |
| $50,000 to $74,999 | 30 | 21.4% |
| $75,000 to $99,999 | 32 | 22.9% |
| $100,000 to $149,999 | 5 | 3.6% |
| $150,000 to $199,999 | 2 | 1.4% |
| $200,000+ | 4 | 2.9% |
Household Income by Householder Age in Mount Pleasant
The median household income in Mount Pleasant is $52,500, with the highest median household income of $71,250 found in the 25 to 44 years age bracket for the primary householder. A total of 15 households (10.7%) fall into this category. Meanwhile, the 15 to 24 years age bracket for the primary householder has the lowest median household income of $0, with 3 households (2.1%) in this group.
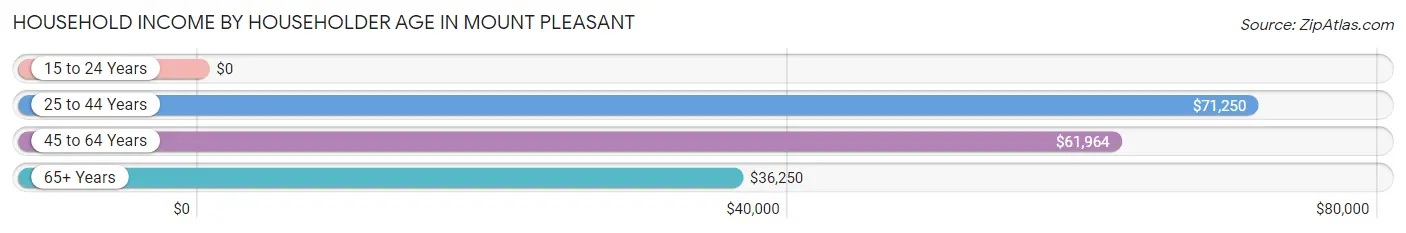
| Income Bracket | # Households | Median Income |
| 15 to 24 Years | 3 (2.1%) | $0 |
| 25 to 44 Years | 15 (10.7%) | $71,250 |
| 45 to 64 Years | 69 (49.3%) | $61,964 |
| 65+ Years | 53 (37.9%) | $36,250 |
| Total | 140 (100.0%) | $52,500 |
Poverty in Mount Pleasant
Income Below Poverty by Sex and Age in Mount Pleasant
With 19.8% poverty level for males and 13.4% for females among the residents of Mount Pleasant, under 5 year old males and 35 to 44 year old females are the most vulnerable to poverty, with 4 males (66.7%) and 4 females (40.0%) in their respective age groups living below the poverty level.
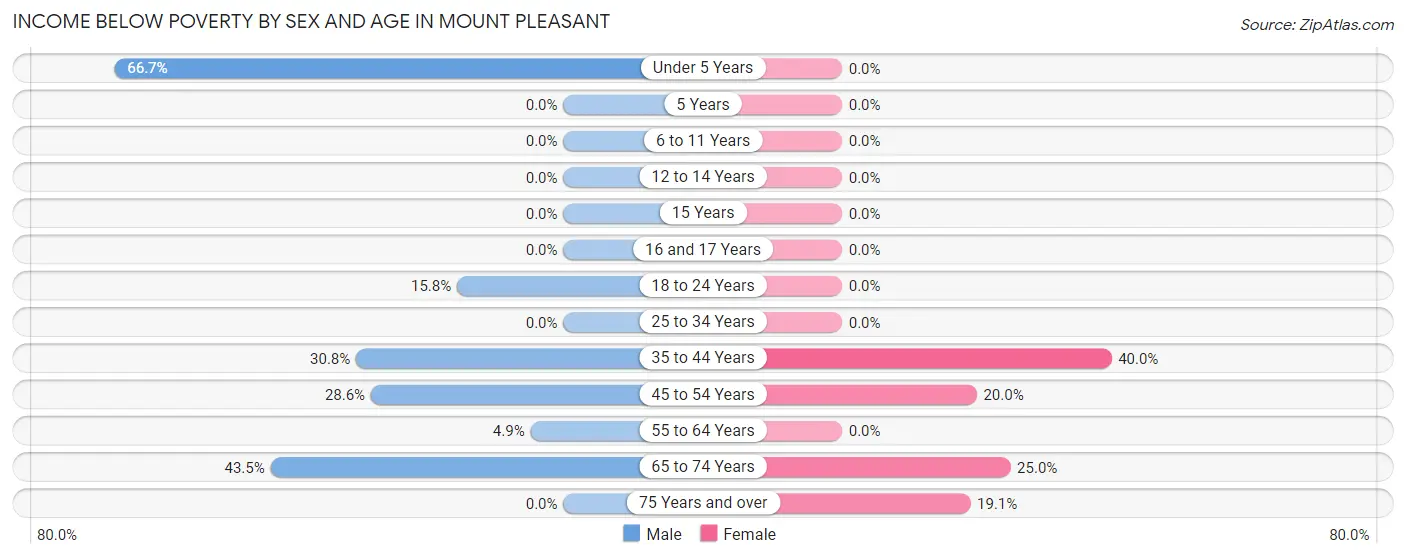
| Age Bracket | Male | Female |
| Under 5 Years | 4 (66.7%) | 0 (0.0%) |
| 5 Years | 0 (0.0%) | 0 (0.0%) |
| 6 to 11 Years | 0 (0.0%) | 0 (0.0%) |
| 12 to 14 Years | 0 (0.0%) | 0 (0.0%) |
| 15 Years | 0 (0.0%) | 0 (0.0%) |
| 16 and 17 Years | 0 (0.0%) | 0 (0.0%) |
| 18 to 24 Years | 3 (15.8%) | 0 (0.0%) |
| 25 to 34 Years | 0 (0.0%) | 0 (0.0%) |
| 35 to 44 Years | 4 (30.8%) | 4 (40.0%) |
| 45 to 54 Years | 8 (28.6%) | 2 (20.0%) |
| 55 to 64 Years | 2 (4.9%) | 0 (0.0%) |
| 65 to 74 Years | 10 (43.5%) | 8 (25.0%) |
| 75 Years and over | 0 (0.0%) | 4 (19.1%) |
| Total | 31 (19.8%) | 18 (13.4%) |
Income Above Poverty by Sex and Age in Mount Pleasant
According to the poverty statistics in Mount Pleasant, males aged 5 years and females aged under 5 years are the age groups that are most secure financially, with 100.0% of males and 100.0% of females in these age groups living above the poverty line.
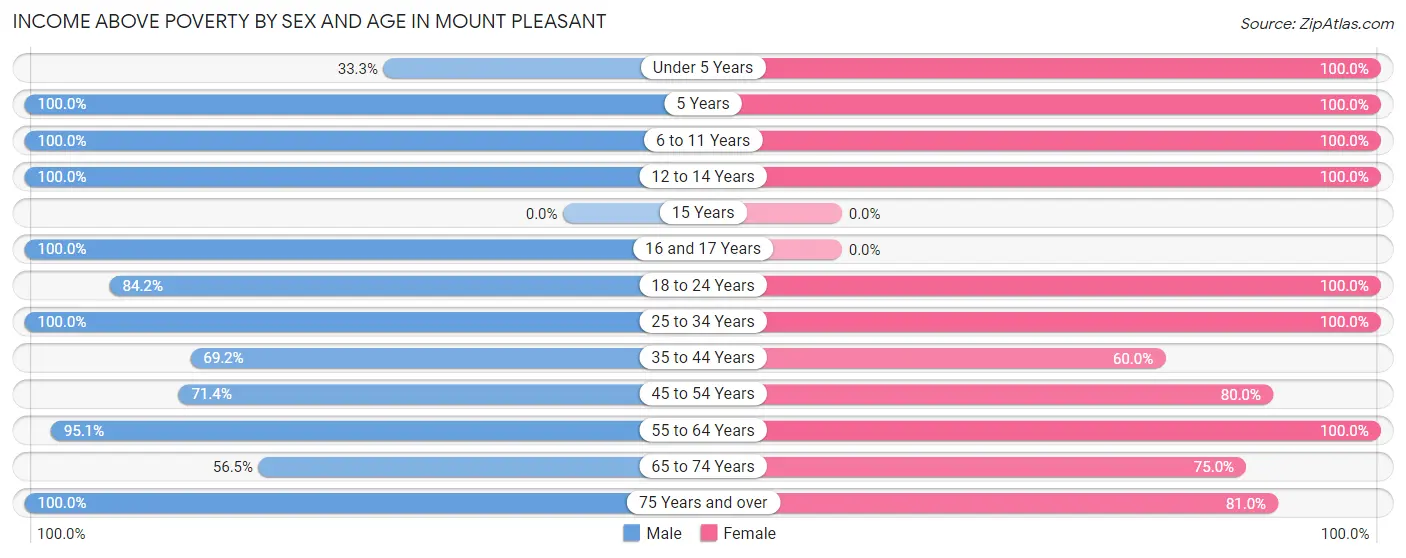
| Age Bracket | Male | Female |
| Under 5 Years | 2 (33.3%) | 3 (100.0%) |
| 5 Years | 1 (100.0%) | 1 (100.0%) |
| 6 to 11 Years | 2 (100.0%) | 4 (100.0%) |
| 12 to 14 Years | 3 (100.0%) | 6 (100.0%) |
| 15 Years | 0 (0.0%) | 0 (0.0%) |
| 16 and 17 Years | 2 (100.0%) | 0 (0.0%) |
| 18 to 24 Years | 16 (84.2%) | 6 (100.0%) |
| 25 to 34 Years | 11 (100.0%) | 8 (100.0%) |
| 35 to 44 Years | 9 (69.2%) | 6 (60.0%) |
| 45 to 54 Years | 20 (71.4%) | 8 (80.0%) |
| 55 to 64 Years | 39 (95.1%) | 33 (100.0%) |
| 65 to 74 Years | 13 (56.5%) | 24 (75.0%) |
| 75 Years and over | 8 (100.0%) | 17 (80.9%) |
| Total | 126 (80.2%) | 116 (86.6%) |
Income Below Poverty Among Married-Couple Families in Mount Pleasant
The poverty statistics for married-couple families in Mount Pleasant show that 18.5% or 10 of the total 54 families live below the poverty line. Families with no children have the highest poverty rate of 21.3%, comprising of 10 families. On the other hand, families with 1 or 2 children have the lowest poverty rate of 0.0%, which includes 0 families.
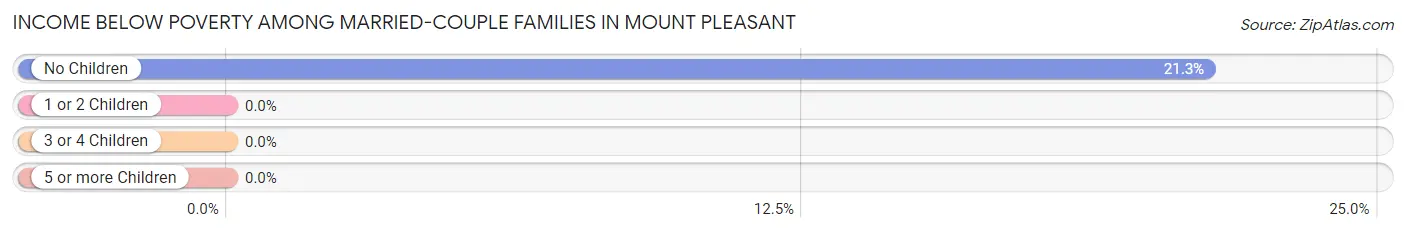
| Children | Above Poverty | Below Poverty |
| No Children | 37 (78.7%) | 10 (21.3%) |
| 1 or 2 Children | 7 (100.0%) | 0 (0.0%) |
| 3 or 4 Children | 0 (0.0%) | 0 (0.0%) |
| 5 or more Children | 0 (0.0%) | 0 (0.0%) |
| Total | 44 (81.5%) | 10 (18.5%) |
Income Below Poverty Among Single-Parent Households in Mount Pleasant
According to the poverty data in Mount Pleasant, 19.1% or 4 single-father households and 44.4% or 4 single-mother households are living below the poverty line. Among single-father households, those with no children have the highest poverty rate, with 4 households (20.0%) experiencing poverty. Likewise, among single-mother households, those with 1 or 2 children have the highest poverty rate, with 4 households (57.1%) falling below the poverty line.
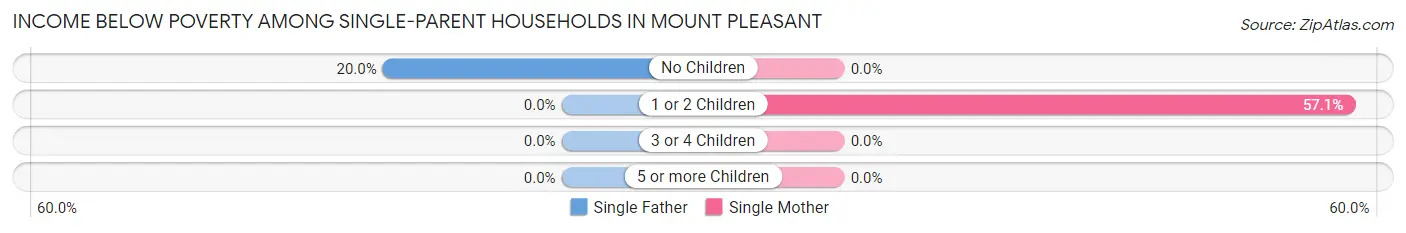
| Children | Single Father | Single Mother |
| No Children | 4 (20.0%) | 0 (0.0%) |
| 1 or 2 Children | 0 (0.0%) | 4 (57.1%) |
| 3 or 4 Children | 0 (0.0%) | 0 (0.0%) |
| 5 or more Children | 0 (0.0%) | 0 (0.0%) |
| Total | 4 (19.1%) | 4 (44.4%) |
Income Below Poverty Among Married-Couple vs Single-Parent Households in Mount Pleasant
The poverty data for Mount Pleasant shows that 10 of the married-couple family households (18.5%) and 8 of the single-parent households (26.7%) are living below the poverty level. Within the married-couple family households, those with no children have the highest poverty rate, with 10 households (21.3%) falling below the poverty line. Among the single-parent households, those with 1 or 2 children have the highest poverty rate, with 4 household (50.0%) living below poverty.
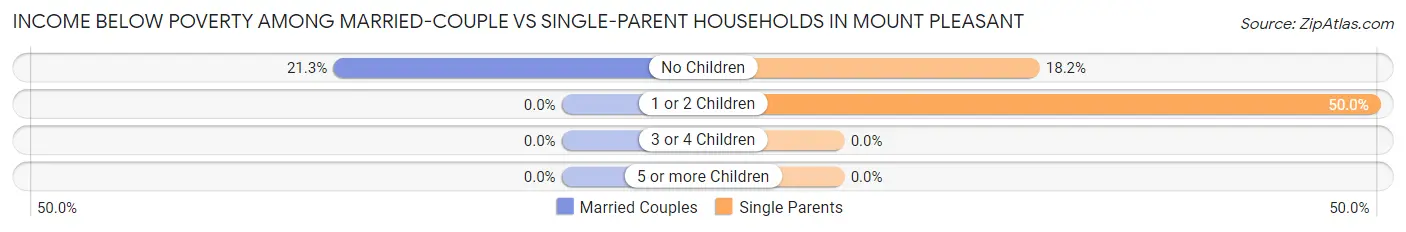
| Children | Married-Couple Families | Single-Parent Households |
| No Children | 10 (21.3%) | 4 (18.2%) |
| 1 or 2 Children | 0 (0.0%) | 4 (50.0%) |
| 3 or 4 Children | 0 (0.0%) | 0 (0.0%) |
| 5 or more Children | 0 (0.0%) | 0 (0.0%) |
| Total | 10 (18.5%) | 8 (26.7%) |
Race in Mount Pleasant
The most populous races in Mount Pleasant are White / Caucasian (279 | 95.9%), Black / African American (7 | 2.4%), and Two or more Races (5 | 1.7%).
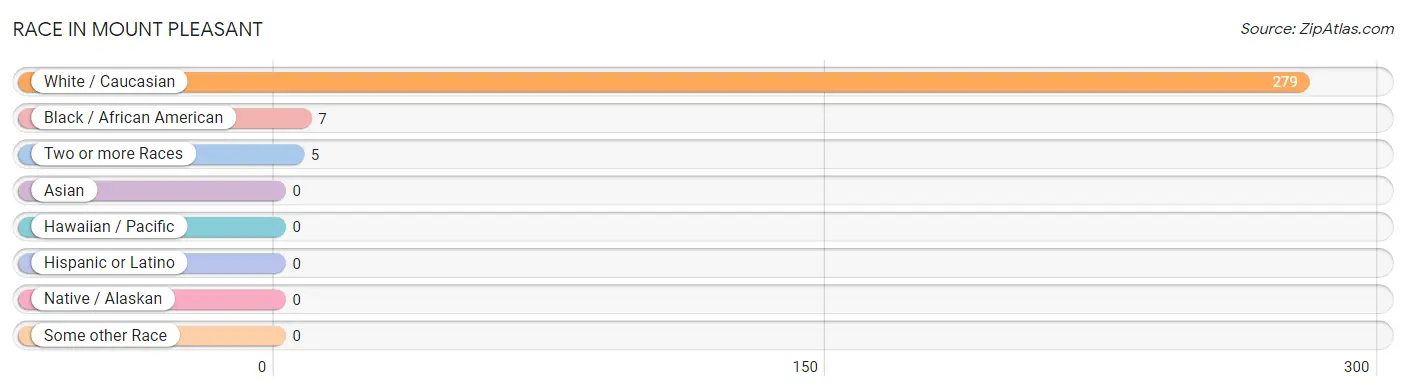
| Race | # Population | % Population |
| Asian | 0 | 0.0% |
| Black / African American | 7 | 2.4% |
| Hawaiian / Pacific | 0 | 0.0% |
| Hispanic or Latino | 0 | 0.0% |
| Native / Alaskan | 0 | 0.0% |
| White / Caucasian | 279 | 95.9% |
| Two or more Races | 5 | 1.7% |
| Some other Race | 0 | 0.0% |
| Total | 291 | 100.0% |
Ancestry in Mount Pleasant
The most populous ancestries reported in Mount Pleasant are Irish (53 | 18.2%), Italian (45 | 15.5%), Polish (44 | 15.1%), English (27 | 9.3%), and German (19 | 6.5%), together accounting for 64.6% of all Mount Pleasant residents.
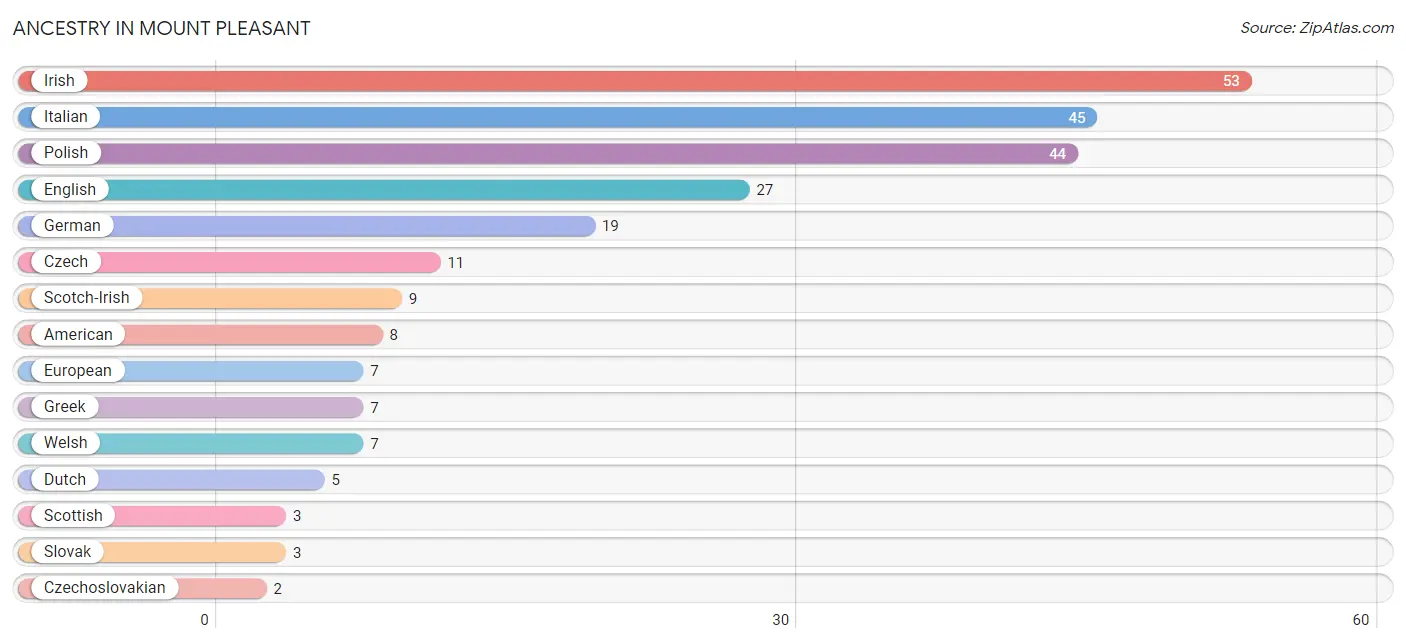
| Ancestry | # Population | % Population |
| American | 8 | 2.8% |
| Czech | 11 | 3.8% |
| Czechoslovakian | 2 | 0.7% |
| Dutch | 5 | 1.7% |
| English | 27 | 9.3% |
| European | 7 | 2.4% |
| French | 2 | 0.7% |
| German | 19 | 6.5% |
| Greek | 7 | 2.4% |
| Hungarian | 2 | 0.7% |
| Irish | 53 | 18.2% |
| Italian | 45 | 15.5% |
| Lithuanian | 1 | 0.3% |
| Polish | 44 | 15.1% |
| Scotch-Irish | 9 | 3.1% |
| Scottish | 3 | 1.0% |
| Slovak | 3 | 1.0% |
| Ukrainian | 2 | 0.7% |
| Welsh | 7 | 2.4% | View All 19 Rows |
Immigrants in Mount Pleasant

| Immigration Origin | # Population | % Population | View All 0 Rows |
Sex and Age in Mount Pleasant
Sex and Age in Mount Pleasant
The most populous age groups in Mount Pleasant are 60 to 64 Years (31 | 19.8%) for men and 60 to 64 Years (27 | 20.2%) for women.
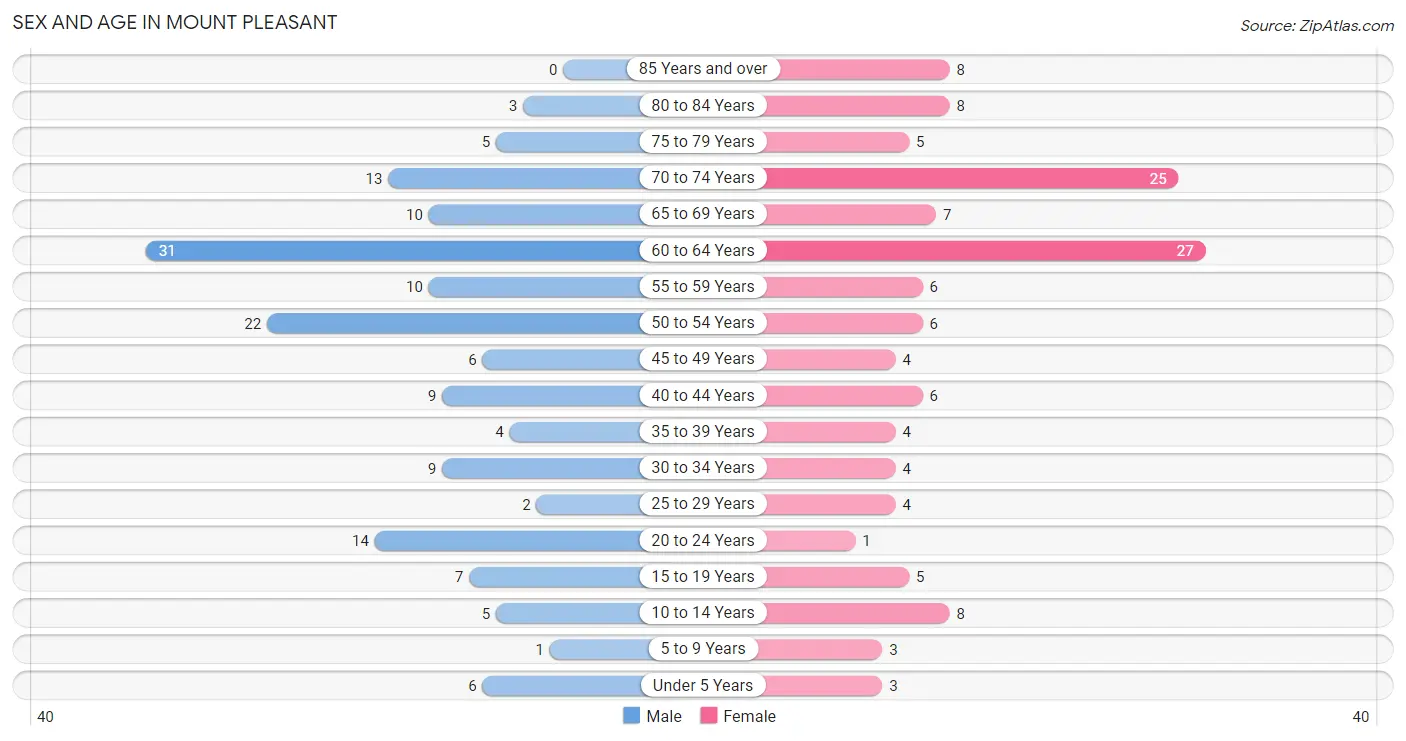
| Age Bracket | Male | Female |
| Under 5 Years | 6 (3.8%) | 3 (2.2%) |
| 5 to 9 Years | 1 (0.6%) | 3 (2.2%) |
| 10 to 14 Years | 5 (3.2%) | 8 (6.0%) |
| 15 to 19 Years | 7 (4.5%) | 5 (3.7%) |
| 20 to 24 Years | 14 (8.9%) | 1 (0.7%) |
| 25 to 29 Years | 2 (1.3%) | 4 (3.0%) |
| 30 to 34 Years | 9 (5.7%) | 4 (3.0%) |
| 35 to 39 Years | 4 (2.5%) | 4 (3.0%) |
| 40 to 44 Years | 9 (5.7%) | 6 (4.5%) |
| 45 to 49 Years | 6 (3.8%) | 4 (3.0%) |
| 50 to 54 Years | 22 (14.0%) | 6 (4.5%) |
| 55 to 59 Years | 10 (6.4%) | 6 (4.5%) |
| 60 to 64 Years | 31 (19.8%) | 27 (20.2%) |
| 65 to 69 Years | 10 (6.4%) | 7 (5.2%) |
| 70 to 74 Years | 13 (8.3%) | 25 (18.7%) |
| 75 to 79 Years | 5 (3.2%) | 5 (3.7%) |
| 80 to 84 Years | 3 (1.9%) | 8 (6.0%) |
| 85 Years and over | 0 (0.0%) | 8 (6.0%) |
| Total | 157 (100.0%) | 134 (100.0%) |
Families and Households in Mount Pleasant
Median Family Size in Mount Pleasant
The median family size in Mount Pleasant is 2.71 persons per family, with single female/mother families (9 | 10.7%) accounting for the largest median family size of 3 persons per family. On the other hand, single male/father families (21 | 25.0%) represent the smallest median family size with 2.62 persons per family.
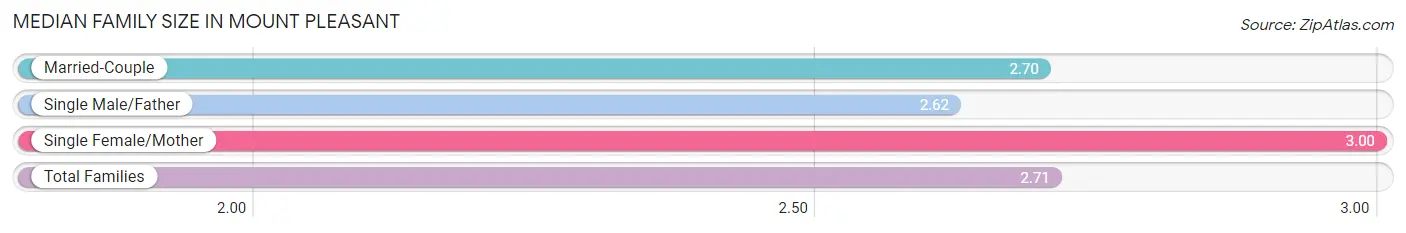
| Family Type | # Families | Family Size |
| Married-Couple | 54 (64.3%) | 2.70 |
| Single Male/Father | 21 (25.0%) | 2.62 |
| Single Female/Mother | 9 (10.7%) | 3.00 |
| Total Families | 84 (100.0%) | 2.71 |
Median Household Size in Mount Pleasant
The median household size in Mount Pleasant is 2.08 persons per household, with single female/mother households (9 | 6.4%) accounting for the largest median household size of 3 persons per household. non-family households (56 | 40.0%) represent the smallest median household size with 1.09 persons per household.
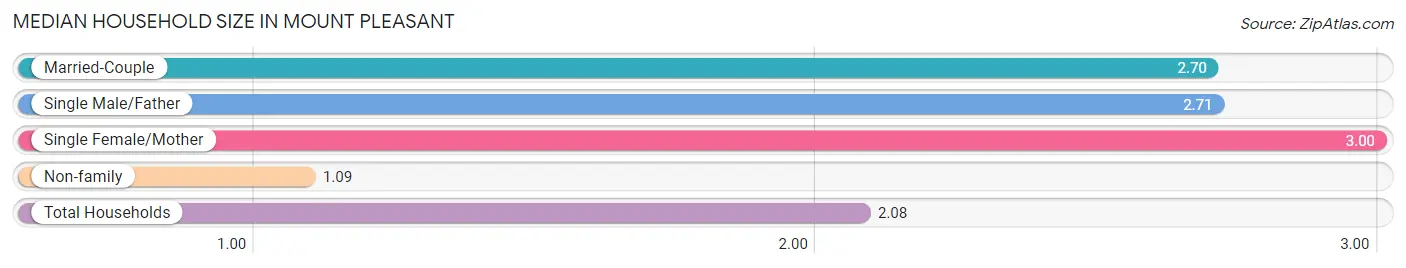
| Household Type | # Households | Household Size |
| Married-Couple | 54 (38.6%) | 2.70 |
| Single Male/Father | 21 (15.0%) | 2.71 |
| Single Female/Mother | 9 (6.4%) | 3.00 |
| Non-family | 56 (40.0%) | 1.09 |
| Total Households | 140 (100.0%) | 2.08 |
Household Size by Marriage Status in Mount Pleasant
Out of a total of 140 households in Mount Pleasant, 84 (60.0%) are family households, while 56 (40.0%) are nonfamily households. The most numerous type of family households are 2-person households, comprising 55, and the most common type of nonfamily households are 1-person households, comprising 51.
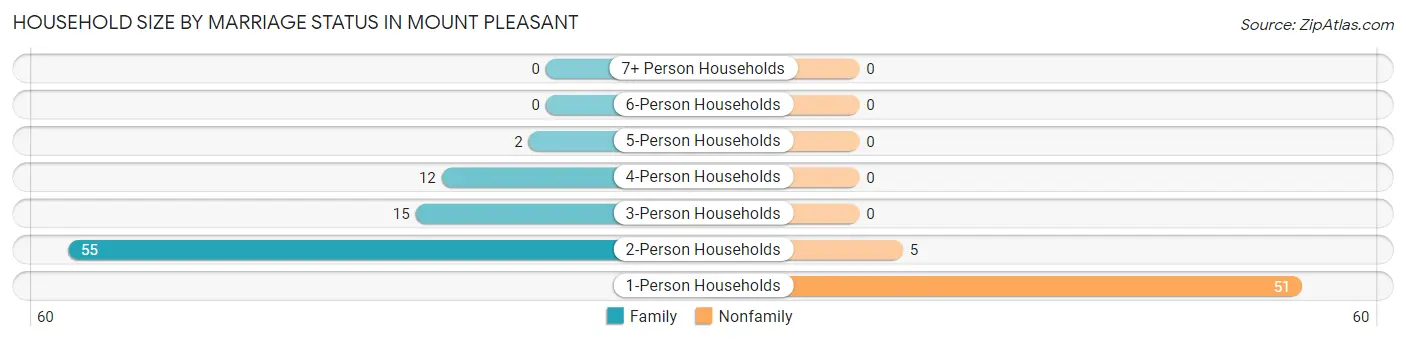
| Household Size | Family Households | Nonfamily Households |
| 1-Person Households | - | 51 (36.4%) |
| 2-Person Households | 55 (39.3%) | 5 (3.6%) |
| 3-Person Households | 15 (10.7%) | 0 (0.0%) |
| 4-Person Households | 12 (8.6%) | 0 (0.0%) |
| 5-Person Households | 2 (1.4%) | 0 (0.0%) |
| 6-Person Households | 0 (0.0%) | 0 (0.0%) |
| 7+ Person Households | 0 (0.0%) | 0 (0.0%) |
| Total | 84 (60.0%) | 56 (40.0%) |
Female Fertility in Mount Pleasant
Fertility by Age in Mount Pleasant
Average fertility rate in Mount Pleasant is 33.0 births per 1,000 women. Women in the age bracket of 20 to 34 years have the highest fertility rate with 111.0 births per 1,000 women. Women in the age bracket of 20 to 34 years acount for 100.0% of all women with births.
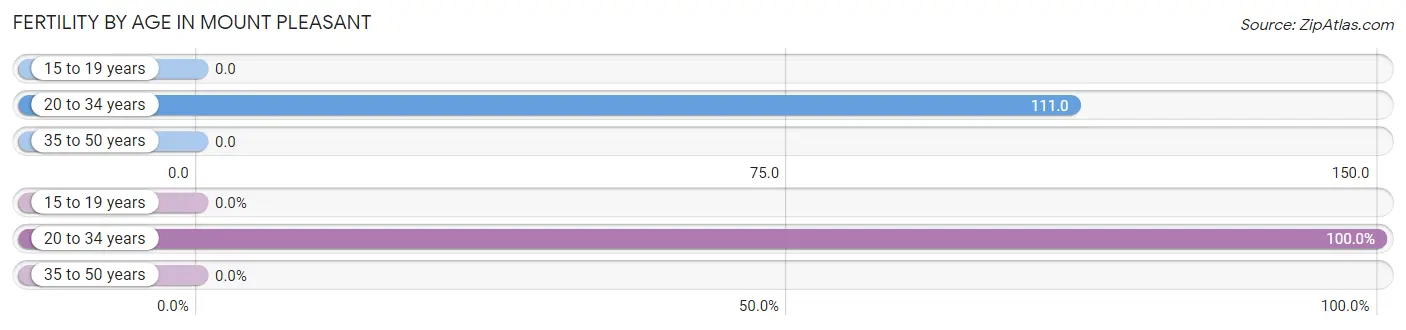
| Age Bracket | Women with Births | Births / 1,000 Women |
| 15 to 19 years | 0 (0.0%) | 0.0 |
| 20 to 34 years | 1 (100.0%) | 111.0 |
| 35 to 50 years | 0 (0.0%) | 0.0 |
| Total | 1 (100.0%) | 33.0 |
Fertility by Age by Marriage Status in Mount Pleasant
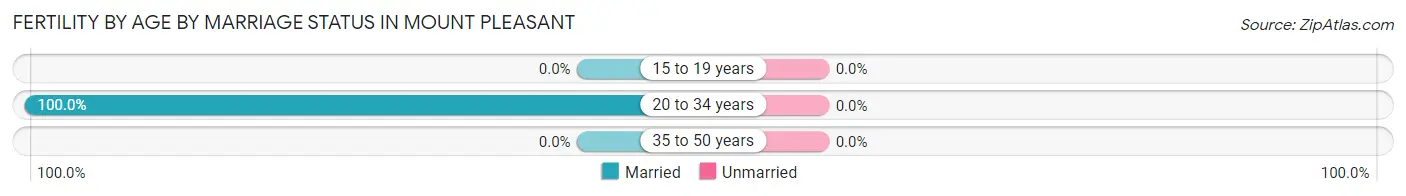
| Age Bracket | Married | Unmarried |
| 15 to 19 years | 0 (0.0%) | 0 (0.0%) |
| 20 to 34 years | 1 (100.0%) | 0 (0.0%) |
| 35 to 50 years | 0 (0.0%) | 0 (0.0%) |
| Total | 1 (100.0%) | 0 (0.0%) |
Fertility by Education in Mount Pleasant
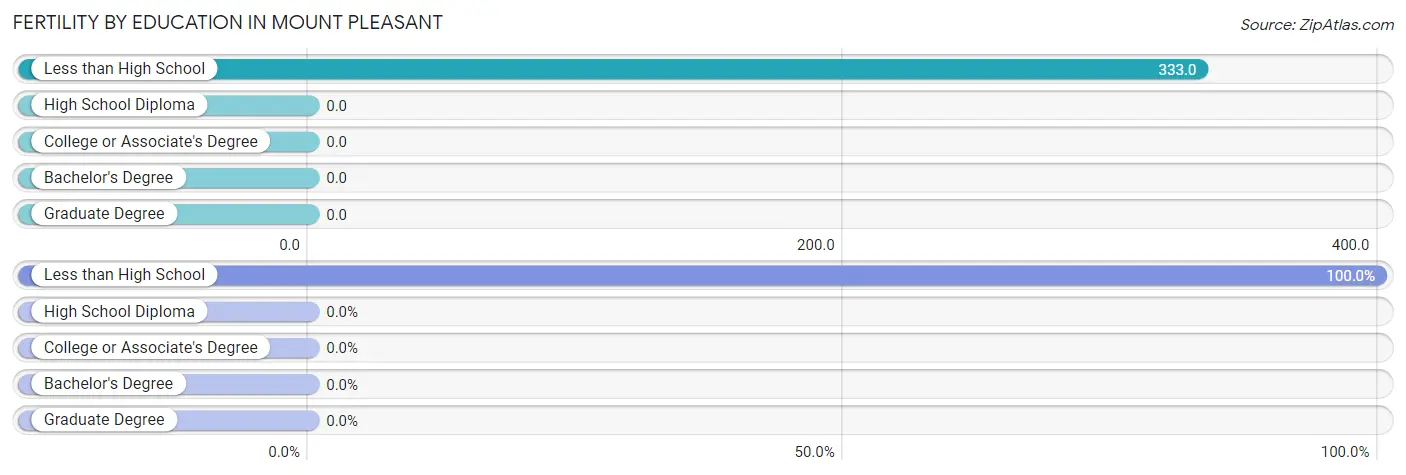
| Educational Attainment | Women with Births | Births / 1,000 Women |
| Less than High School | 1 (100.0%) | 333.0 |
| High School Diploma | 0 (0.0%) | 0.0 |
| College or Associate's Degree | 0 (0.0%) | 0.0 |
| Bachelor's Degree | 0 (0.0%) | 0.0 |
| Graduate Degree | 0 (0.0%) | 0.0 |
| Total | 1 (100.0%) | 33.0 |
Fertility by Education by Marriage Status in Mount Pleasant
| Educational Attainment | Married | Unmarried |
| Less than High School | 1 (100.0%) | 0 (0.0%) |
| High School Diploma | 0 (0.0%) | 0 (0.0%) |
| College or Associate's Degree | 0 (0.0%) | 0 (0.0%) |
| Bachelor's Degree | 0 (0.0%) | 0 (0.0%) |
| Graduate Degree | 0 (0.0%) | 0 (0.0%) |
| Total | 1 (100.0%) | 0 (0.0%) |
Employment Characteristics in Mount Pleasant
Employment by Class of Employer in Mount Pleasant
Among the 121 employed individuals in Mount Pleasant, private company employees (91 | 75.2%), local government employees (10 | 8.3%), and not-for-profit organizations (9 | 7.4%) make up the most common classes of employment.
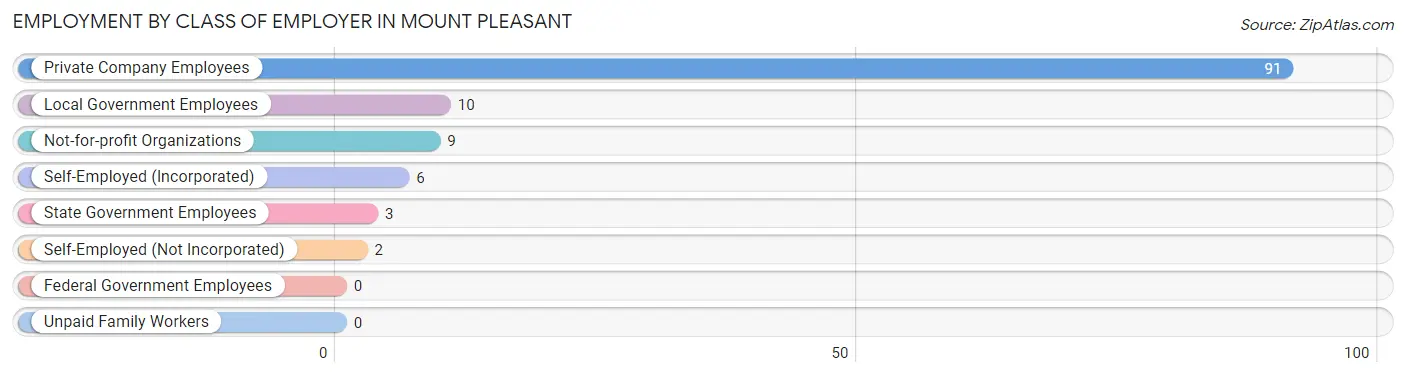
| Employer Class | # Employees | % Employees |
| Private Company Employees | 91 | 75.2% |
| Self-Employed (Incorporated) | 6 | 5.0% |
| Self-Employed (Not Incorporated) | 2 | 1.7% |
| Not-for-profit Organizations | 9 | 7.4% |
| Local Government Employees | 10 | 8.3% |
| State Government Employees | 3 | 2.5% |
| Federal Government Employees | 0 | 0.0% |
| Unpaid Family Workers | 0 | 0.0% |
| Total | 121 | 100.0% |
Employment Status by Age in Mount Pleasant
According to the labor force statistics for Mount Pleasant, out of the total population over 16 years of age (265), 54.7% or 145 individuals are in the labor force, with 10.3% or 15 of them unemployed. The age group with the highest labor force participation rate is 55 to 59 years, with 87.5% or 14 individuals in the labor force. Within the labor force, the 20 to 24 years age range has the highest percentage of unemployed individuals, with 27.3% or 3 of them being unemployed.
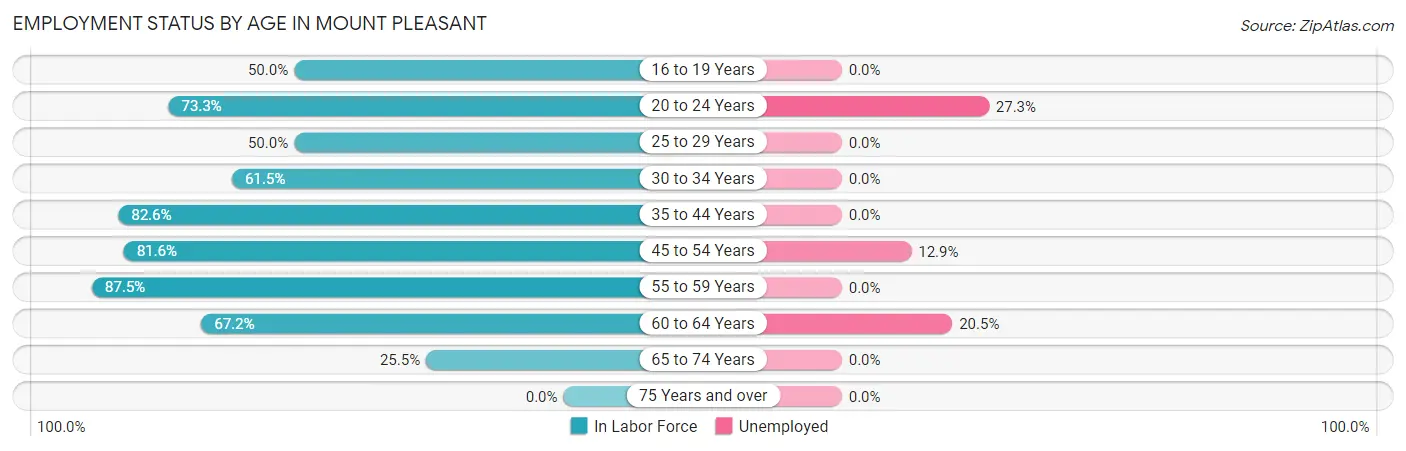
| Age Bracket | In Labor Force | Unemployed |
| 16 to 19 Years | 6 (50.0%) | 0 (0.0%) |
| 20 to 24 Years | 11 (73.3%) | 3 (27.3%) |
| 25 to 29 Years | 3 (50.0%) | 0 (0.0%) |
| 30 to 34 Years | 8 (61.5%) | 0 (0.0%) |
| 35 to 44 Years | 19 (82.6%) | 0 (0.0%) |
| 45 to 54 Years | 31 (81.6%) | 4 (12.9%) |
| 55 to 59 Years | 14 (87.5%) | 0 (0.0%) |
| 60 to 64 Years | 39 (67.2%) | 8 (20.5%) |
| 65 to 74 Years | 14 (25.5%) | 0 (0.0%) |
| 75 Years and over | 0 (0.0%) | 0 (0.0%) |
| Total | 145 (54.7%) | 15 (10.3%) |
Employment Status by Educational Attainment in Mount Pleasant
According to labor force statistics for Mount Pleasant, 74.0% of individuals (114) out of the total population between 25 and 64 years of age (154) are in the labor force, with 10.5% or 12 of them being unemployed. The group with the highest labor force participation rate are those with the educational attainment of college / associate degree, with 81.5% or 22 individuals in the labor force. Within the labor force, individuals with less than high school education have the highest percentage of unemployment, with 80.0% or 8 of them being unemployed.
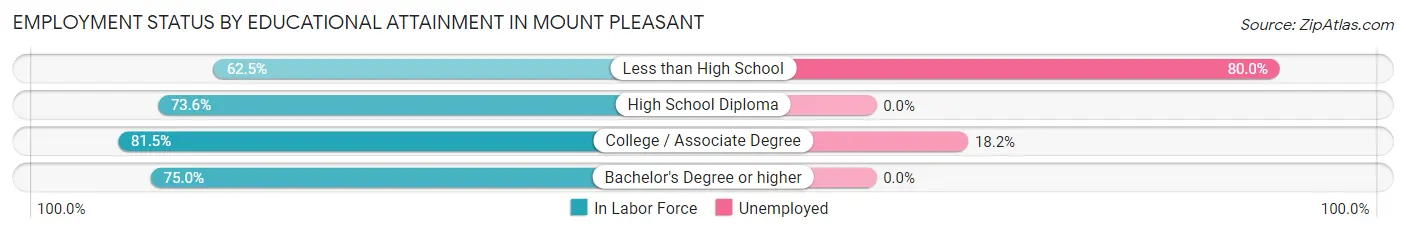
| Educational Attainment | In Labor Force | Unemployed |
| Less than High School | 10 (62.5%) | 13 (80.0%) |
| High School Diploma | 67 (73.6%) | 0 (0.0%) |
| College / Associate Degree | 22 (81.5%) | 5 (18.2%) |
| Bachelor's Degree or higher | 15 (75.0%) | 0 (0.0%) |
| Total | 114 (74.0%) | 16 (10.5%) |
Employment Occupations by Sex in Mount Pleasant
Management, Business, Science and Arts Occupations
The most common Management, Business, Science and Arts occupations in Mount Pleasant are Community & Social Service (17 | 13.1%), Education Instruction & Library (9 | 6.9%), Management (6 | 4.6%), Education, Arts & Media (6 | 4.6%), and Health Diagnosing & Treating (4 | 3.1%).
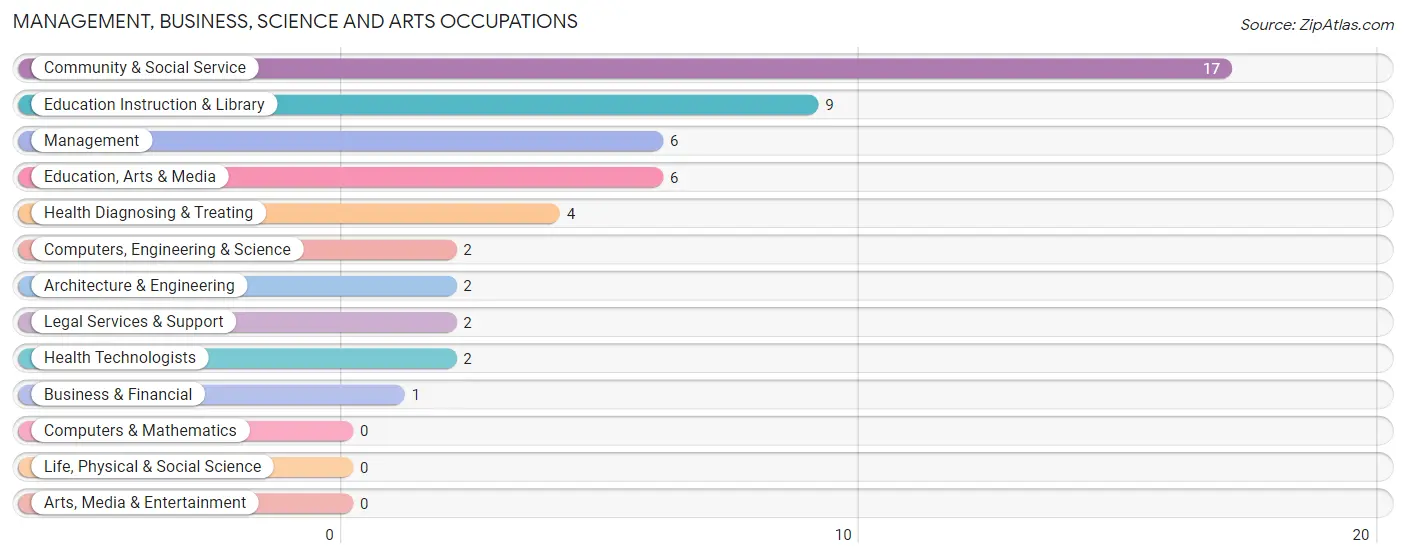
Management, Business, Science and Arts Occupations by Sex
Within the Management, Business, Science and Arts occupations in Mount Pleasant, the most male-oriented occupations are Business & Financial (100.0%), Computers, Engineering & Science (100.0%), and Architecture & Engineering (100.0%), while the most female-oriented occupations are Education, Arts & Media (100.0%), Education Instruction & Library (88.9%), and Community & Social Service (82.4%).
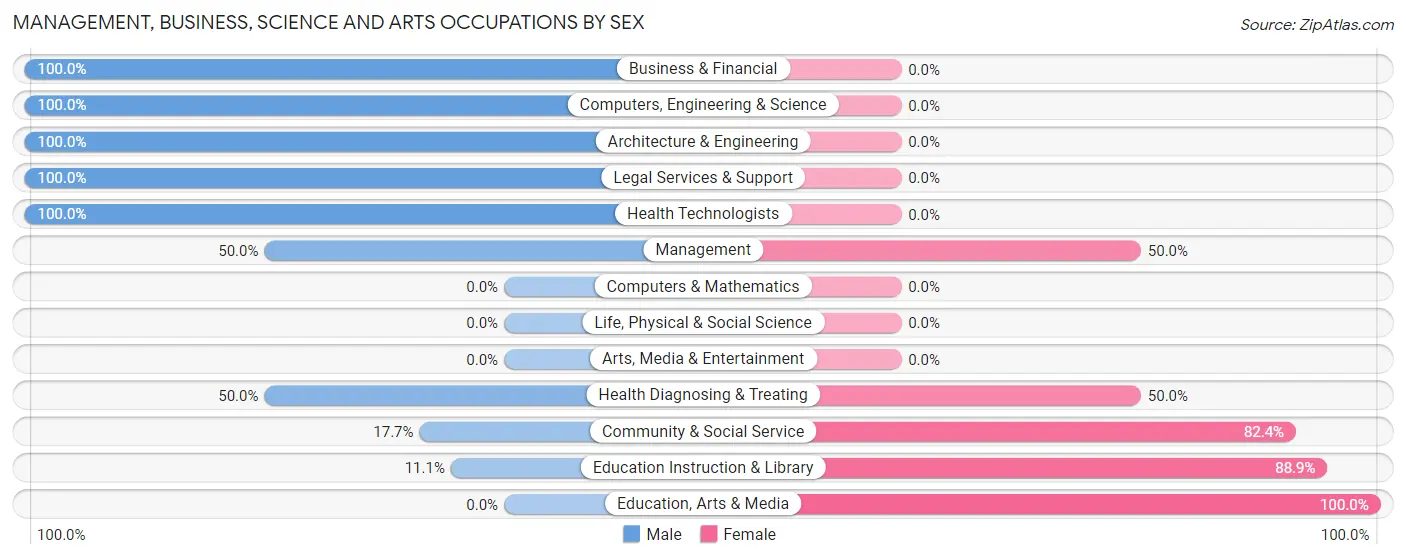
| Occupation | Male | Female |
| Management | 3 (50.0%) | 3 (50.0%) |
| Business & Financial | 1 (100.0%) | 0 (0.0%) |
| Computers, Engineering & Science | 2 (100.0%) | 0 (0.0%) |
| Computers & Mathematics | 0 (0.0%) | 0 (0.0%) |
| Architecture & Engineering | 2 (100.0%) | 0 (0.0%) |
| Life, Physical & Social Science | 0 (0.0%) | 0 (0.0%) |
| Community & Social Service | 3 (17.6%) | 14 (82.4%) |
| Education, Arts & Media | 0 (0.0%) | 6 (100.0%) |
| Legal Services & Support | 2 (100.0%) | 0 (0.0%) |
| Education Instruction & Library | 1 (11.1%) | 8 (88.9%) |
| Arts, Media & Entertainment | 0 (0.0%) | 0 (0.0%) |
| Health Diagnosing & Treating | 2 (50.0%) | 2 (50.0%) |
| Health Technologists | 2 (100.0%) | 0 (0.0%) |
| Total (Category) | 11 (36.7%) | 19 (63.3%) |
| Total (Overall) | 72 (55.4%) | 58 (44.6%) |
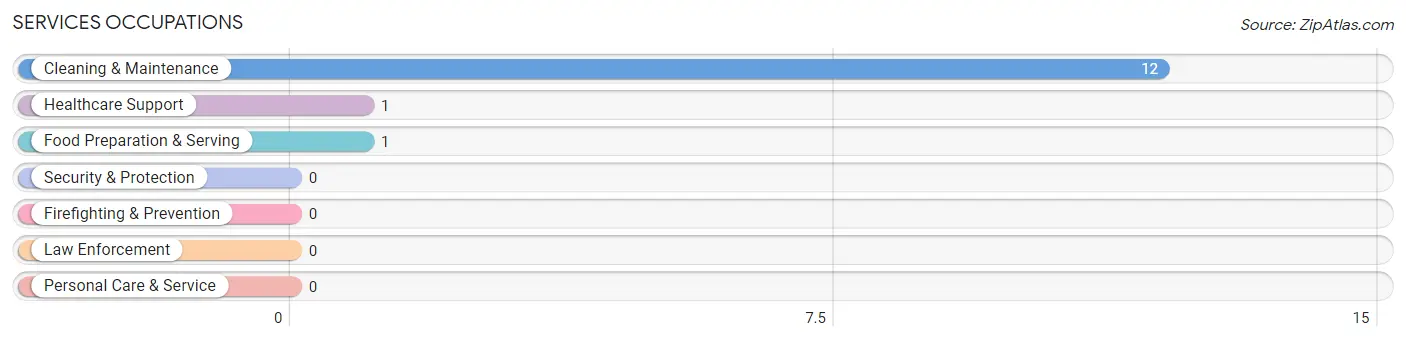
Services Occupations
The most common Services occupations in Mount Pleasant are Cleaning & Maintenance (12 | 9.2%), Healthcare Support (1 | 0.8%), and Food Preparation & Serving (1 | 0.8%).
Services Occupations by Sex
Within the Services occupations in Mount Pleasant, the most male-oriented occupations are Food Preparation & Serving (100.0%), and Cleaning & Maintenance (83.3%), while the most female-oriented occupations are Healthcare Support (100.0%), and Cleaning & Maintenance (16.7%).
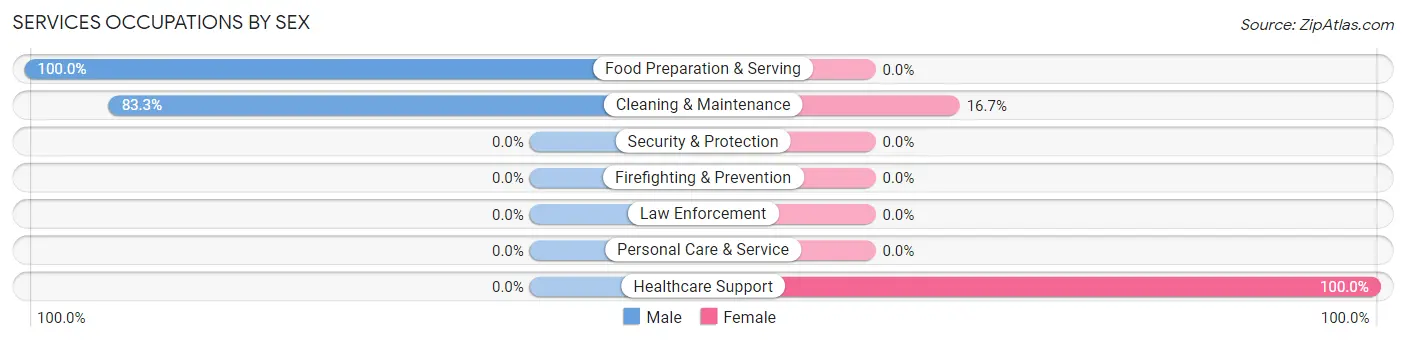
| Occupation | Male | Female |
| Healthcare Support | 0 (0.0%) | 1 (100.0%) |
| Security & Protection | 0 (0.0%) | 0 (0.0%) |
| Firefighting & Prevention | 0 (0.0%) | 0 (0.0%) |
| Law Enforcement | 0 (0.0%) | 0 (0.0%) |
| Food Preparation & Serving | 1 (100.0%) | 0 (0.0%) |
| Cleaning & Maintenance | 10 (83.3%) | 2 (16.7%) |
| Personal Care & Service | 0 (0.0%) | 0 (0.0%) |
| Total (Category) | 11 (78.6%) | 3 (21.4%) |
| Total (Overall) | 72 (55.4%) | 58 (44.6%) |
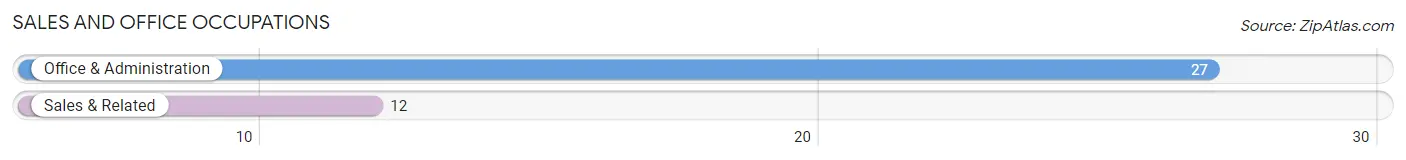
Sales and Office Occupations
The most common Sales and Office occupations in Mount Pleasant are Office & Administration (27 | 20.8%), and Sales & Related (12 | 9.2%).
Sales and Office Occupations by Sex
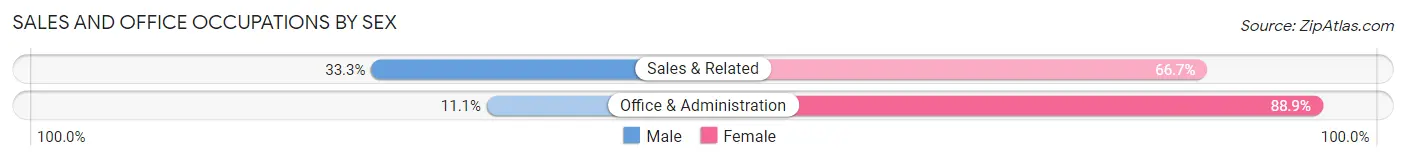
| Occupation | Male | Female |
| Sales & Related | 4 (33.3%) | 8 (66.7%) |
| Office & Administration | 3 (11.1%) | 24 (88.9%) |
| Total (Category) | 7 (17.9%) | 32 (82.1%) |
| Total (Overall) | 72 (55.4%) | 58 (44.6%) |
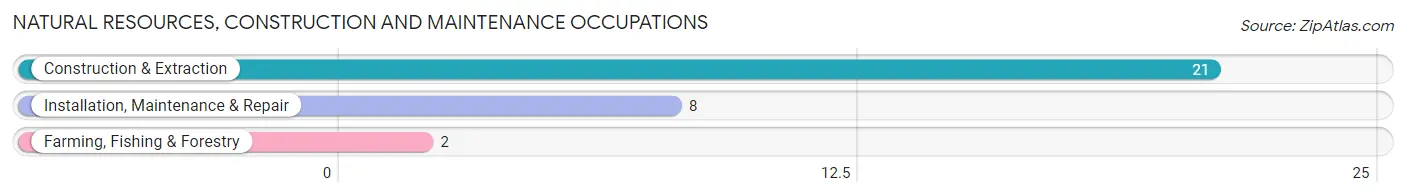
Natural Resources, Construction and Maintenance Occupations
The most common Natural Resources, Construction and Maintenance occupations in Mount Pleasant are Construction & Extraction (21 | 16.2%), Installation, Maintenance & Repair (8 | 6.1%), and Farming, Fishing & Forestry (2 | 1.5%).
Natural Resources, Construction and Maintenance Occupations by Sex
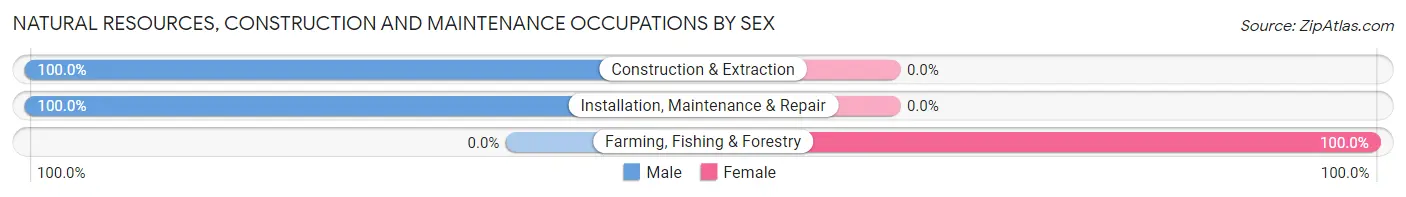
| Occupation | Male | Female |
| Farming, Fishing & Forestry | 0 (0.0%) | 2 (100.0%) |
| Construction & Extraction | 21 (100.0%) | 0 (0.0%) |
| Installation, Maintenance & Repair | 8 (100.0%) | 0 (0.0%) |
| Total (Category) | 29 (93.5%) | 2 (6.5%) |
| Total (Overall) | 72 (55.4%) | 58 (44.6%) |
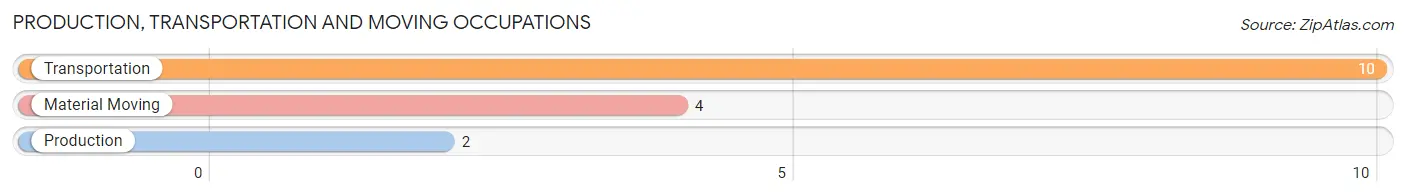
Production, Transportation and Moving Occupations
The most common Production, Transportation and Moving occupations in Mount Pleasant are Transportation (10 | 7.7%), Material Moving (4 | 3.1%), and Production (2 | 1.5%).
Production, Transportation and Moving Occupations by Sex
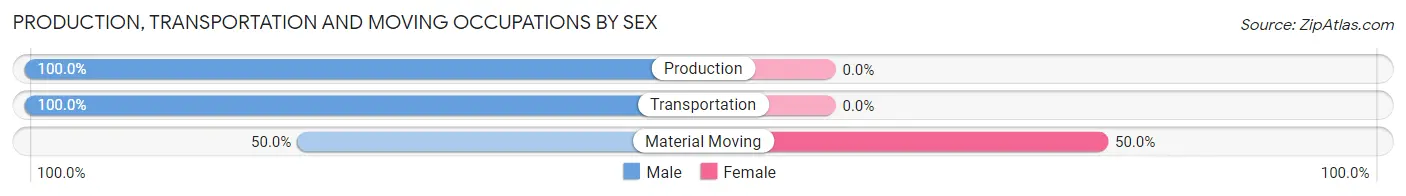
| Occupation | Male | Female |
| Production | 2 (100.0%) | 0 (0.0%) |
| Transportation | 10 (100.0%) | 0 (0.0%) |
| Material Moving | 2 (50.0%) | 2 (50.0%) |
| Total (Category) | 14 (87.5%) | 2 (12.5%) |
| Total (Overall) | 72 (55.4%) | 58 (44.6%) |
Employment Industries by Sex in Mount Pleasant
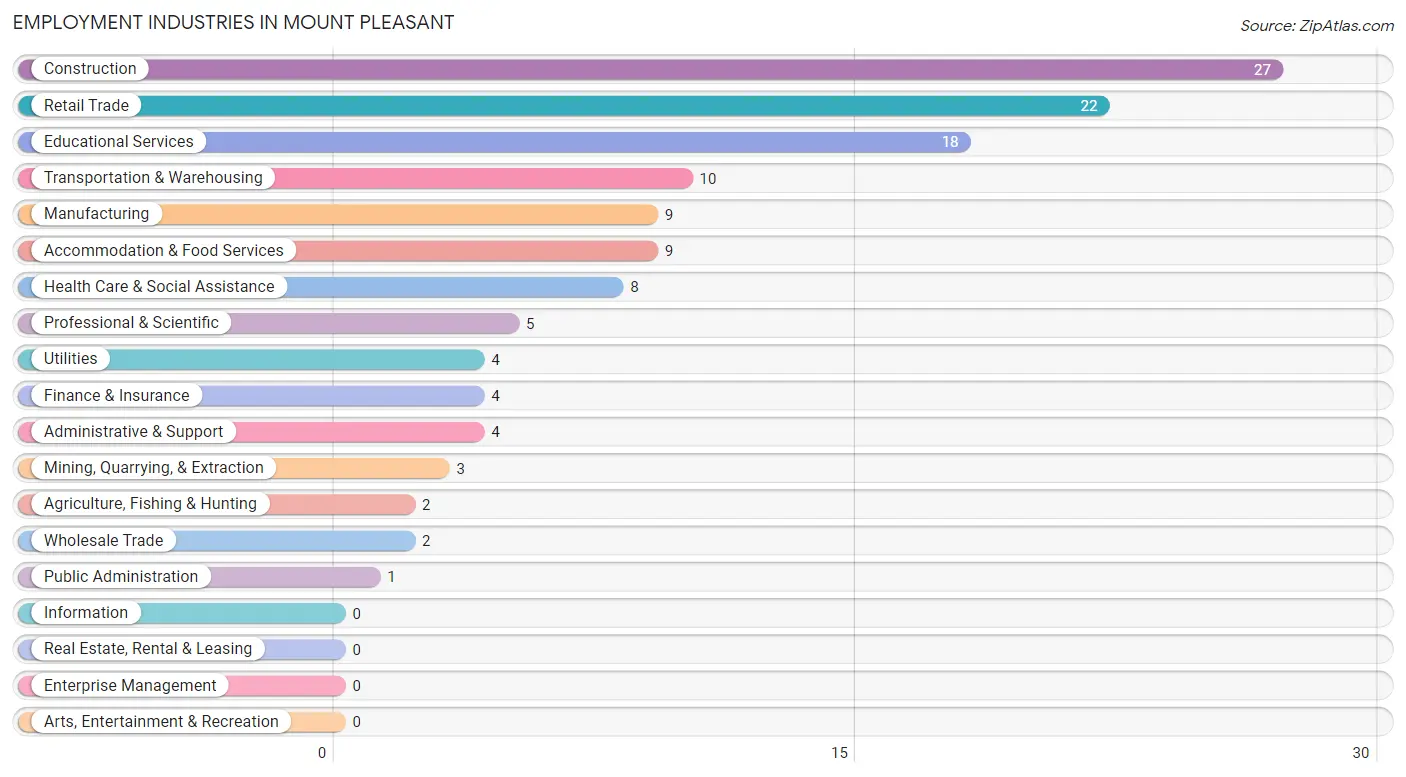
Employment Industries in Mount Pleasant
The major employment industries in Mount Pleasant include Construction (27 | 20.8%), Retail Trade (22 | 16.9%), Educational Services (18 | 13.9%), Transportation & Warehousing (10 | 7.7%), and Manufacturing (9 | 6.9%).
Employment Industries by Sex in Mount Pleasant
The Mount Pleasant industries that see more men than women are Mining, Quarrying, & Extraction (100.0%), Wholesale Trade (100.0%), and Transportation & Warehousing (100.0%), whereas the industries that tend to have a higher number of women are Agriculture, Fishing & Hunting (100.0%), Public Administration (100.0%), and Retail Trade (81.8%).
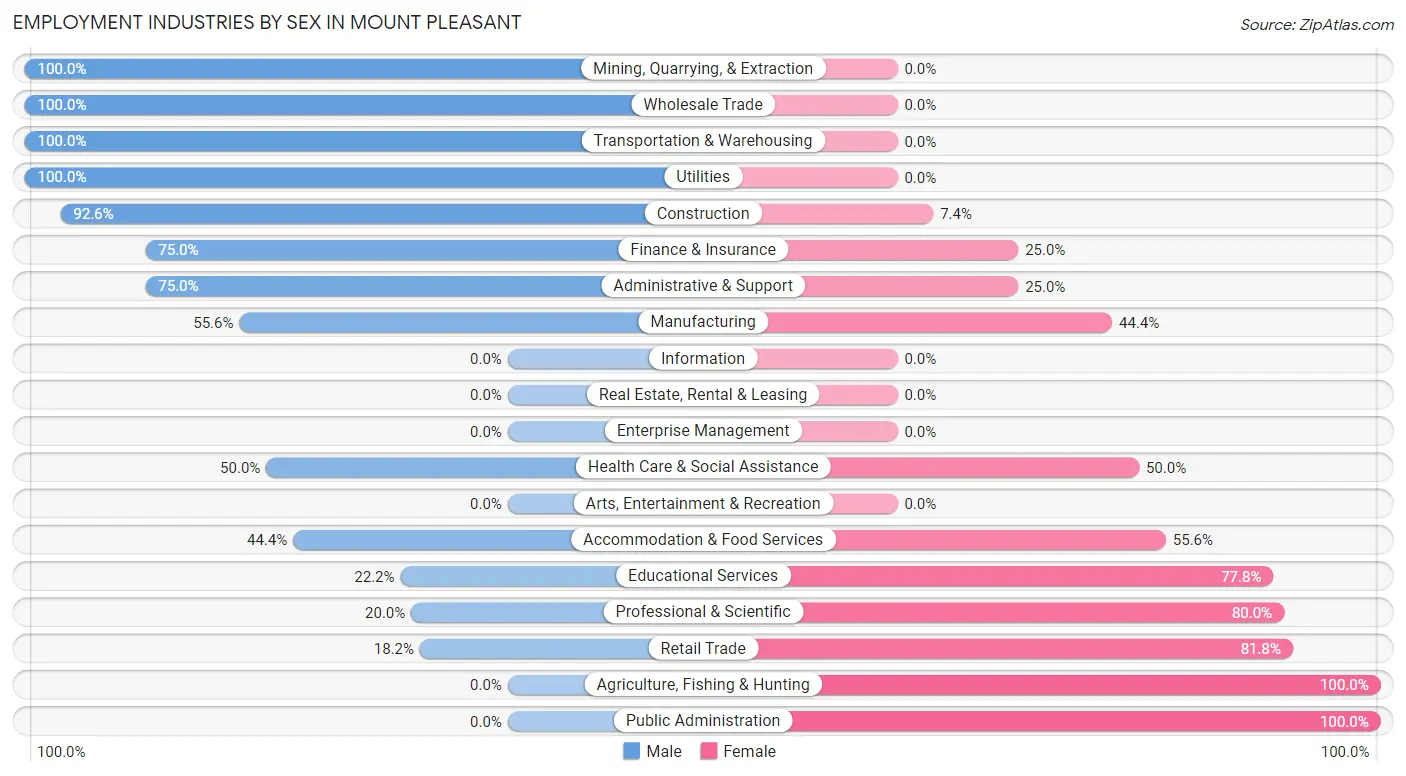
| Industry | Male | Female |
| Agriculture, Fishing & Hunting | 0 (0.0%) | 2 (100.0%) |
| Mining, Quarrying, & Extraction | 3 (100.0%) | 0 (0.0%) |
| Construction | 25 (92.6%) | 2 (7.4%) |
| Manufacturing | 5 (55.6%) | 4 (44.4%) |
| Wholesale Trade | 2 (100.0%) | 0 (0.0%) |
| Retail Trade | 4 (18.2%) | 18 (81.8%) |
| Transportation & Warehousing | 10 (100.0%) | 0 (0.0%) |
| Utilities | 4 (100.0%) | 0 (0.0%) |
| Information | 0 (0.0%) | 0 (0.0%) |
| Finance & Insurance | 3 (75.0%) | 1 (25.0%) |
| Real Estate, Rental & Leasing | 0 (0.0%) | 0 (0.0%) |
| Professional & Scientific | 1 (20.0%) | 4 (80.0%) |
| Enterprise Management | 0 (0.0%) | 0 (0.0%) |
| Administrative & Support | 3 (75.0%) | 1 (25.0%) |
| Educational Services | 4 (22.2%) | 14 (77.8%) |
| Health Care & Social Assistance | 4 (50.0%) | 4 (50.0%) |
| Arts, Entertainment & Recreation | 0 (0.0%) | 0 (0.0%) |
| Accommodation & Food Services | 4 (44.4%) | 5 (55.6%) |
| Public Administration | 0 (0.0%) | 1 (100.0%) |
| Total | 72 (55.4%) | 58 (44.6%) |
Education in Mount Pleasant
School Enrollment in Mount Pleasant
The most common levels of schooling among the 34 students in Mount Pleasant are middle school (11 | 32.4%), college / undergraduate (10 | 29.4%), and nursery / preschool (7 | 20.6%).
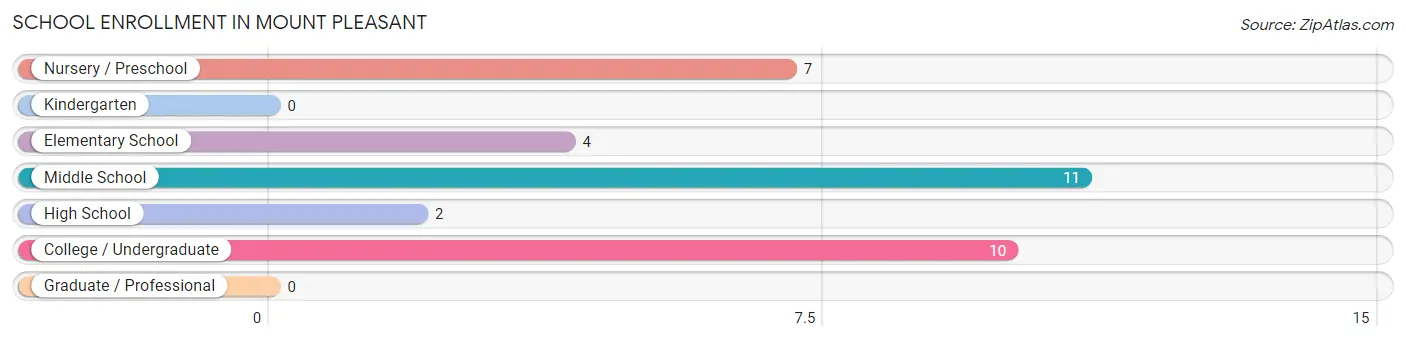
| School Level | # Students | % Students |
| Nursery / Preschool | 7 | 20.6% |
| Kindergarten | 0 | 0.0% |
| Elementary School | 4 | 11.8% |
| Middle School | 11 | 32.4% |
| High School | 2 | 5.9% |
| College / Undergraduate | 10 | 29.4% |
| Graduate / Professional | 0 | 0.0% |
| Total | 34 | 100.0% |
School Enrollment by Age by Funding Source in Mount Pleasant
Out of a total of 34 students who are enrolled in schools in Mount Pleasant, 5 (14.7%) attend a private institution, while the remaining 29 (85.3%) are enrolled in public schools. The age group of 3 to 4 year olds has the highest likelihood of being enrolled in private schools, with 2 (33.3% in the age bracket) enrolled. Conversely, the age group of 10 to 14 year olds has the lowest likelihood of being enrolled in a private school, with 13 (100.0% in the age bracket) attending a public institution.
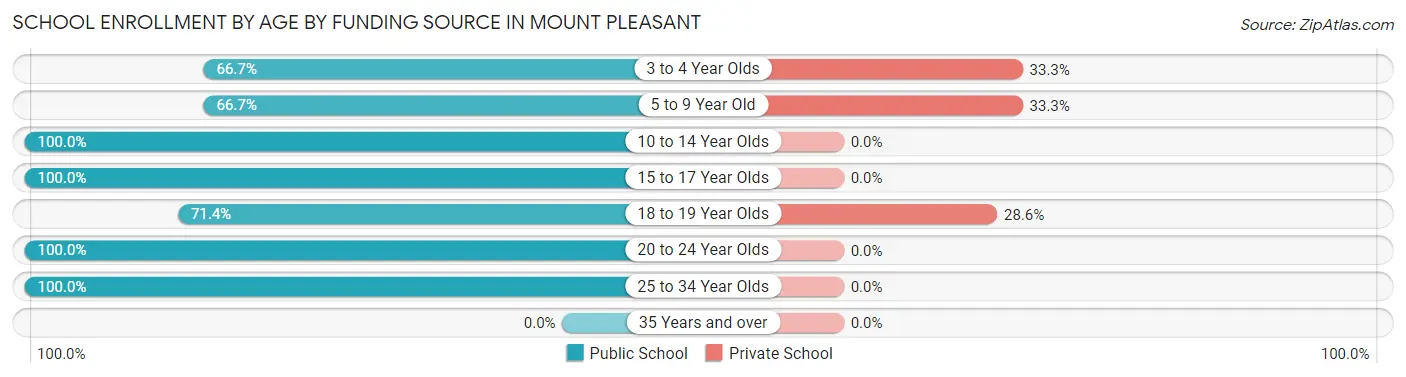
| Age Bracket | Public School | Private School |
| 3 to 4 Year Olds | 4 (66.7%) | 2 (33.3%) |
| 5 to 9 Year Old | 2 (66.7%) | 1 (33.3%) |
| 10 to 14 Year Olds | 13 (100.0%) | 0 (0.0%) |
| 15 to 17 Year Olds | 2 (100.0%) | 0 (0.0%) |
| 18 to 19 Year Olds | 5 (71.4%) | 2 (28.6%) |
| 20 to 24 Year Olds | 1 (100.0%) | 0 (0.0%) |
| 25 to 34 Year Olds | 2 (100.0%) | 0 (0.0%) |
| 35 Years and over | 0 (0.0%) | 0 (0.0%) |
| Total | 29 (85.3%) | 5 (14.7%) |
Educational Attainment by Field of Study in Mount Pleasant
Education (11 | 29.7%), arts & humanities (4 | 10.8%), bio, nature & agricultural (3 | 8.1%), psychology (3 | 8.1%), and social sciences (3 | 8.1%) are the most common fields of study among 37 individuals in Mount Pleasant who have obtained a bachelor's degree or higher.
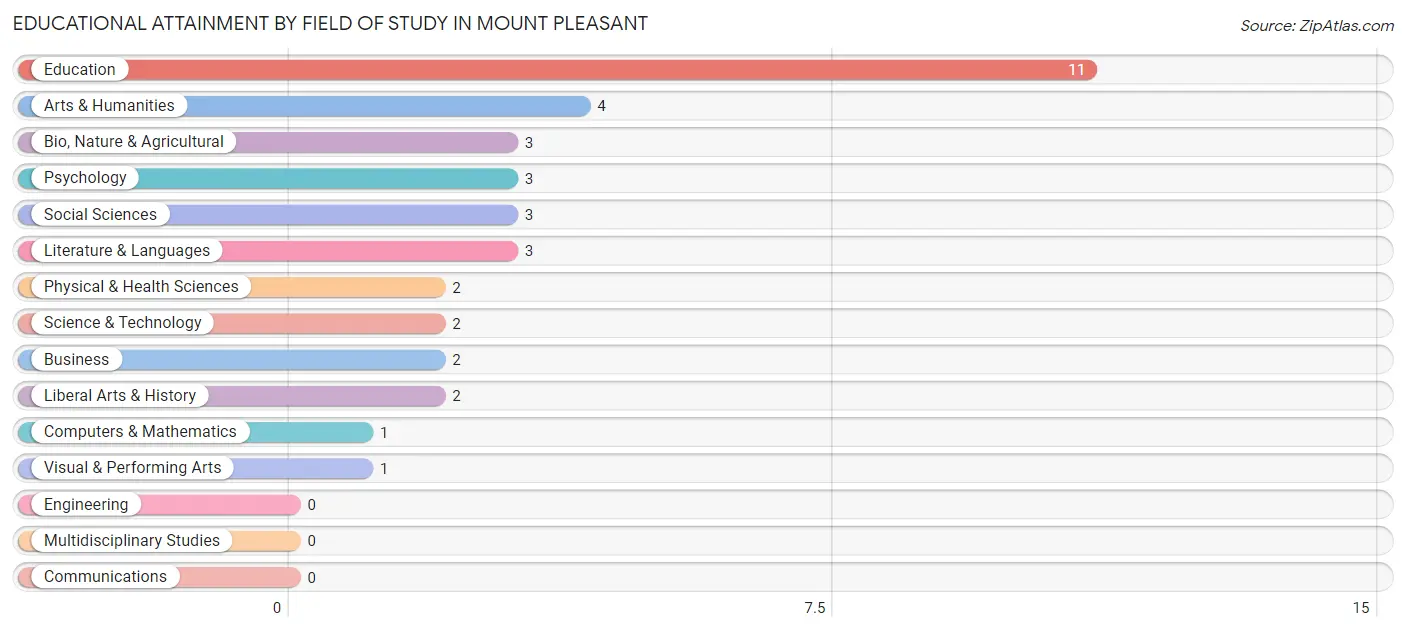
| Field of Study | # Graduates | % Graduates |
| Computers & Mathematics | 1 | 2.7% |
| Bio, Nature & Agricultural | 3 | 8.1% |
| Physical & Health Sciences | 2 | 5.4% |
| Psychology | 3 | 8.1% |
| Social Sciences | 3 | 8.1% |
| Engineering | 0 | 0.0% |
| Multidisciplinary Studies | 0 | 0.0% |
| Science & Technology | 2 | 5.4% |
| Business | 2 | 5.4% |
| Education | 11 | 29.7% |
| Literature & Languages | 3 | 8.1% |
| Liberal Arts & History | 2 | 5.4% |
| Visual & Performing Arts | 1 | 2.7% |
| Communications | 0 | 0.0% |
| Arts & Humanities | 4 | 10.8% |
| Total | 37 | 100.0% |
Transportation & Commute in Mount Pleasant
Vehicle Availability by Sex in Mount Pleasant
The most prevalent vehicle ownership categories in Mount Pleasant are males with 2 vehicles (25, accounting for 39.7%) and females with 2 vehicles (18, making up 43.1%).
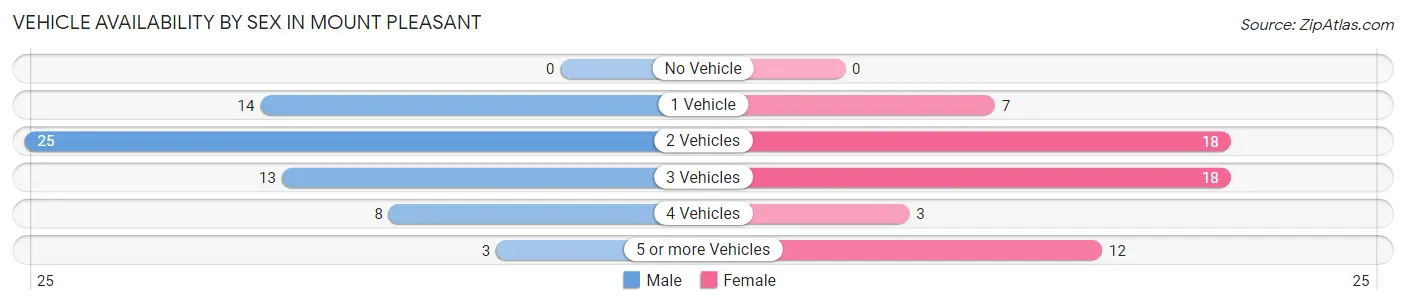
| Vehicles Available | Male | Female |
| No Vehicle | 0 (0.0%) | 0 (0.0%) |
| 1 Vehicle | 14 (22.2%) | 7 (12.1%) |
| 2 Vehicles | 25 (39.7%) | 18 (31.0%) |
| 3 Vehicles | 13 (20.6%) | 18 (31.0%) |
| 4 Vehicles | 8 (12.7%) | 3 (5.2%) |
| 5 or more Vehicles | 3 (4.8%) | 12 (20.7%) |
| Total | 63 (100.0%) | 58 (100.0%) |
Commute Time in Mount Pleasant
The most frequently occuring commute durations in Mount Pleasant are 25 to 29 minutes (21 commuters, 19.1%), 30 to 34 minutes (16 commuters, 14.5%), and 15 to 19 minutes (13 commuters, 11.8%).
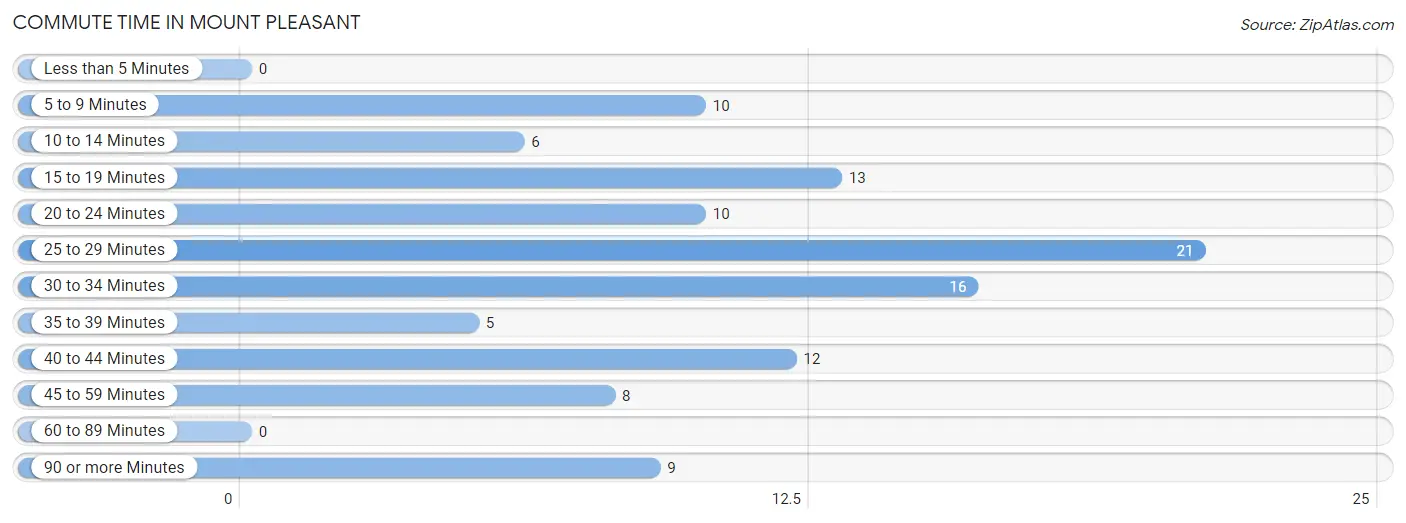
| Commute Time | # Commuters | % Commuters |
| Less than 5 Minutes | 0 | 0.0% |
| 5 to 9 Minutes | 10 | 9.1% |
| 10 to 14 Minutes | 6 | 5.4% |
| 15 to 19 Minutes | 13 | 11.8% |
| 20 to 24 Minutes | 10 | 9.1% |
| 25 to 29 Minutes | 21 | 19.1% |
| 30 to 34 Minutes | 16 | 14.5% |
| 35 to 39 Minutes | 5 | 4.5% |
| 40 to 44 Minutes | 12 | 10.9% |
| 45 to 59 Minutes | 8 | 7.3% |
| 60 to 89 Minutes | 0 | 0.0% |
| 90 or more Minutes | 9 | 8.2% |
Commute Time by Sex in Mount Pleasant
The most common commute times in Mount Pleasant are 25 to 29 minutes (17 commuters, 28.3%) for males and 40 to 44 minutes (10 commuters, 20.0%) for females.
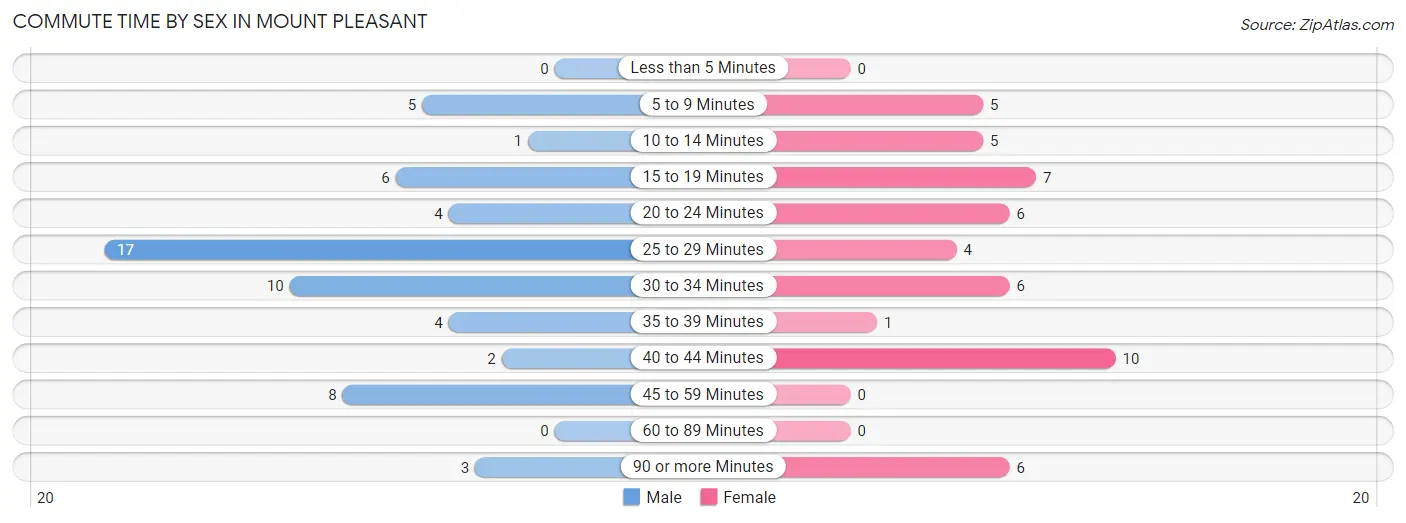
| Commute Time | Male | Female |
| Less than 5 Minutes | 0 (0.0%) | 0 (0.0%) |
| 5 to 9 Minutes | 5 (8.3%) | 5 (10.0%) |
| 10 to 14 Minutes | 1 (1.7%) | 5 (10.0%) |
| 15 to 19 Minutes | 6 (10.0%) | 7 (14.0%) |
| 20 to 24 Minutes | 4 (6.7%) | 6 (12.0%) |
| 25 to 29 Minutes | 17 (28.3%) | 4 (8.0%) |
| 30 to 34 Minutes | 10 (16.7%) | 6 (12.0%) |
| 35 to 39 Minutes | 4 (6.7%) | 1 (2.0%) |
| 40 to 44 Minutes | 2 (3.3%) | 10 (20.0%) |
| 45 to 59 Minutes | 8 (13.3%) | 0 (0.0%) |
| 60 to 89 Minutes | 0 (0.0%) | 0 (0.0%) |
| 90 or more Minutes | 3 (5.0%) | 6 (12.0%) |
Time of Departure to Work by Sex in Mount Pleasant
The most frequent times of departure to work in Mount Pleasant are 7:30 AM to 7:59 AM (12, 20.0%) for males and 6:00 AM to 6:29 AM (11, 22.0%) for females.
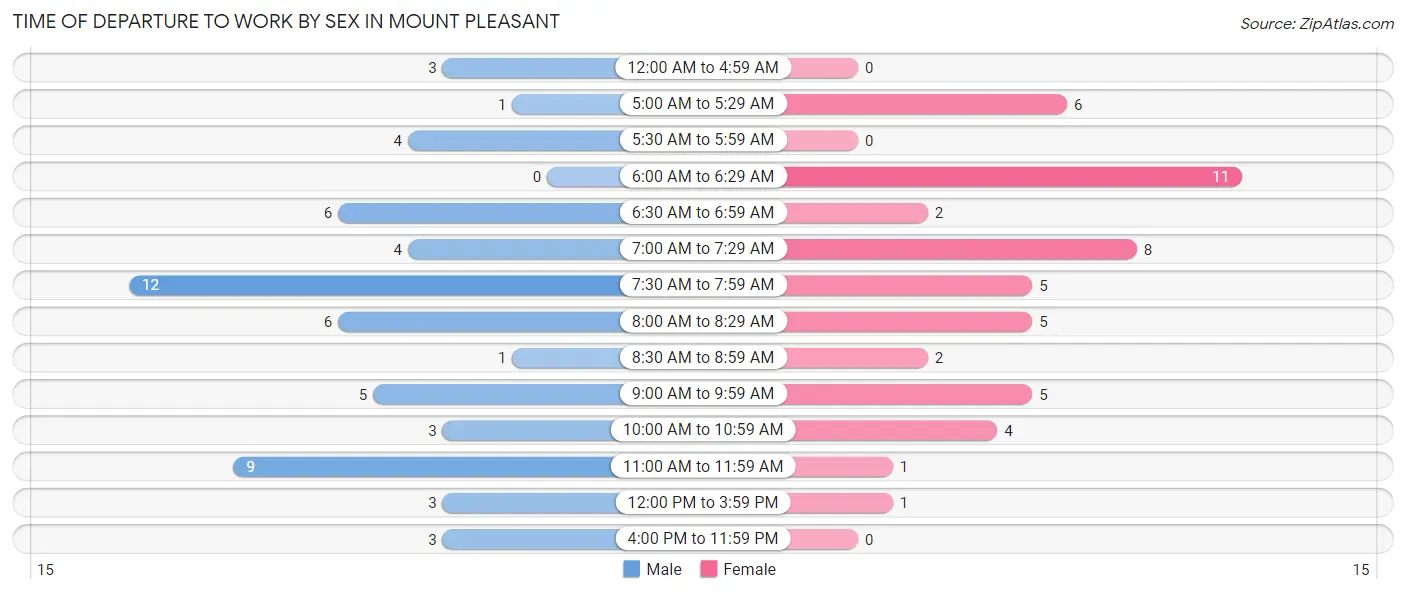
| Time of Departure | Male | Female |
| 12:00 AM to 4:59 AM | 3 (5.0%) | 0 (0.0%) |
| 5:00 AM to 5:29 AM | 1 (1.7%) | 6 (12.0%) |
| 5:30 AM to 5:59 AM | 4 (6.7%) | 0 (0.0%) |
| 6:00 AM to 6:29 AM | 0 (0.0%) | 11 (22.0%) |
| 6:30 AM to 6:59 AM | 6 (10.0%) | 2 (4.0%) |
| 7:00 AM to 7:29 AM | 4 (6.7%) | 8 (16.0%) |
| 7:30 AM to 7:59 AM | 12 (20.0%) | 5 (10.0%) |
| 8:00 AM to 8:29 AM | 6 (10.0%) | 5 (10.0%) |
| 8:30 AM to 8:59 AM | 1 (1.7%) | 2 (4.0%) |
| 9:00 AM to 9:59 AM | 5 (8.3%) | 5 (10.0%) |
| 10:00 AM to 10:59 AM | 3 (5.0%) | 4 (8.0%) |
| 11:00 AM to 11:59 AM | 9 (15.0%) | 1 (2.0%) |
| 12:00 PM to 3:59 PM | 3 (5.0%) | 1 (2.0%) |
| 4:00 PM to 11:59 PM | 3 (5.0%) | 0 (0.0%) |
| Total | 60 (100.0%) | 50 (100.0%) |
Housing Occupancy in Mount Pleasant
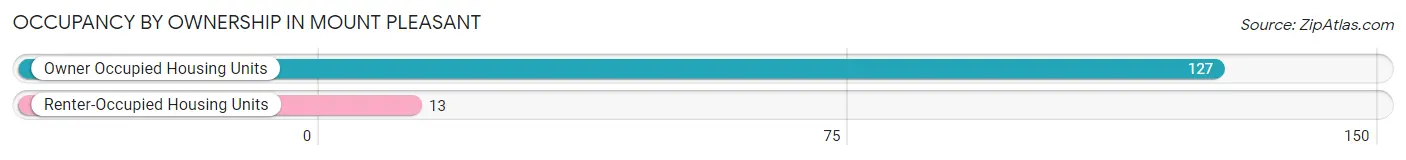
Occupancy by Ownership in Mount Pleasant
Of the total 140 dwellings in Mount Pleasant, owner-occupied units account for 127 (90.7%), while renter-occupied units make up 13 (9.3%).
| Occupancy | # Housing Units | % Housing Units |
| Owner Occupied Housing Units | 127 | 90.7% |
| Renter-Occupied Housing Units | 13 | 9.3% |
| Total Occupied Housing Units | 140 | 100.0% |
Occupancy by Household Size in Mount Pleasant
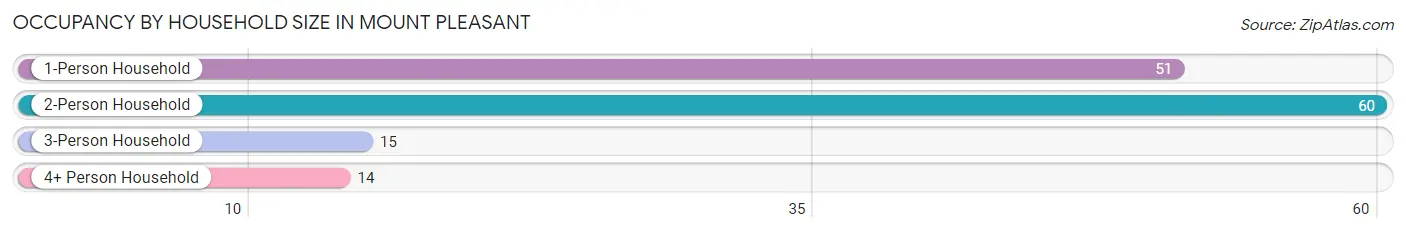
| Household Size | # Housing Units | % Housing Units |
| 1-Person Household | 51 | 36.4% |
| 2-Person Household | 60 | 42.9% |
| 3-Person Household | 15 | 10.7% |
| 4+ Person Household | 14 | 10.0% |
| Total Housing Units | 140 | 100.0% |
Occupancy by Ownership by Household Size in Mount Pleasant
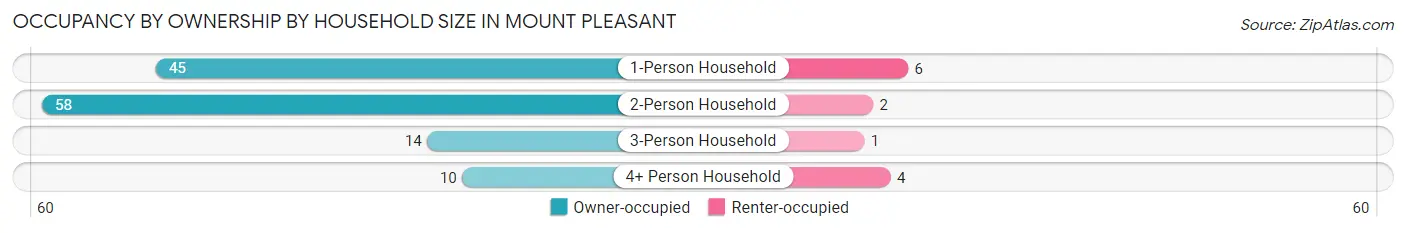
| Household Size | Owner-occupied | Renter-occupied |
| 1-Person Household | 45 (88.2%) | 6 (11.8%) |
| 2-Person Household | 58 (96.7%) | 2 (3.3%) |
| 3-Person Household | 14 (93.3%) | 1 (6.7%) |
| 4+ Person Household | 10 (71.4%) | 4 (28.6%) |
| Total Housing Units | 127 (90.7%) | 13 (9.3%) |
Occupancy by Educational Attainment in Mount Pleasant
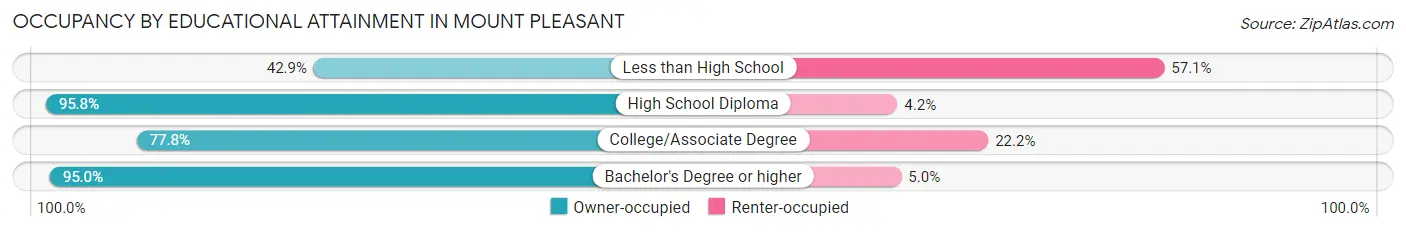
| Household Size | Owner-occupied | Renter-occupied |
| Less than High School | 3 (42.9%) | 4 (57.1%) |
| High School Diploma | 91 (95.8%) | 4 (4.2%) |
| College/Associate Degree | 14 (77.8%) | 4 (22.2%) |
| Bachelor's Degree or higher | 19 (95.0%) | 1 (5.0%) |
Occupancy by Age of Householder in Mount Pleasant
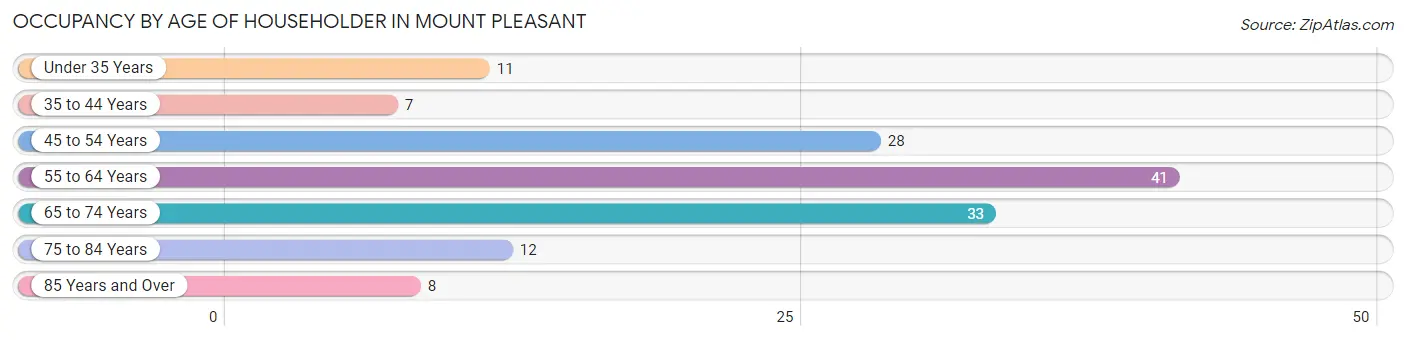
| Age Bracket | # Households | % Households |
| Under 35 Years | 11 | 7.9% |
| 35 to 44 Years | 7 | 5.0% |
| 45 to 54 Years | 28 | 20.0% |
| 55 to 64 Years | 41 | 29.3% |
| 65 to 74 Years | 33 | 23.6% |
| 75 to 84 Years | 12 | 8.6% |
| 85 Years and Over | 8 | 5.7% |
| Total | 140 | 100.0% |
Housing Finances in Mount Pleasant
Median Income by Occupancy in Mount Pleasant
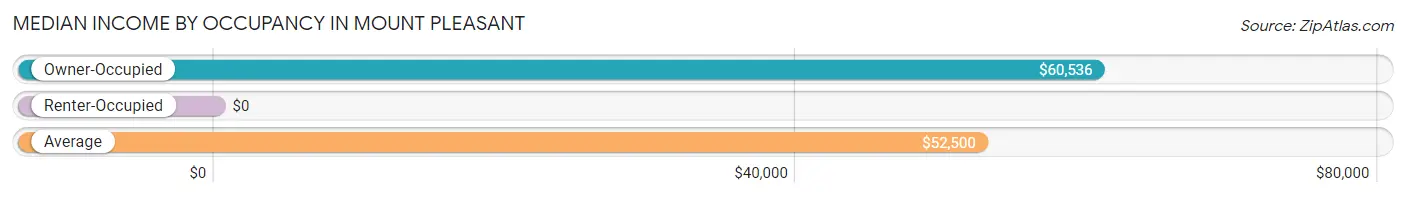
| Occupancy Type | # Households | Median Income |
| Owner-Occupied | 127 (90.7%) | $60,536 |
| Renter-Occupied | 13 (9.3%) | $0 |
| Average | 140 (100.0%) | $52,500 |
Occupancy by Householder Income Bracket in Mount Pleasant
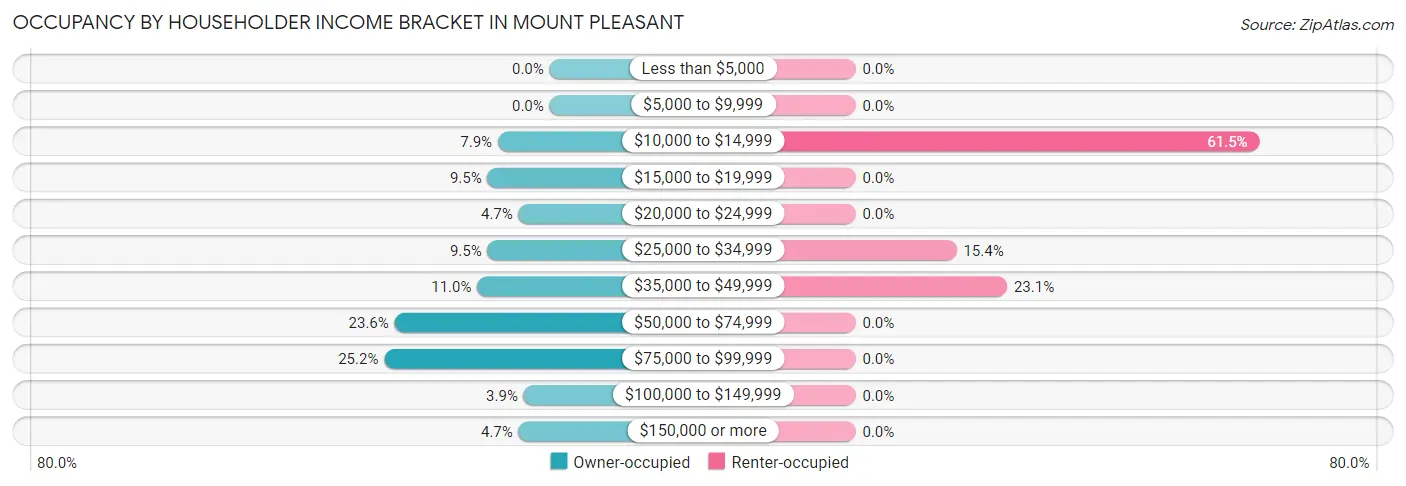
| Income Bracket | Owner-occupied | Renter-occupied |
| Less than $5,000 | 0 (0.0%) | 0 (0.0%) |
| $5,000 to $9,999 | 0 (0.0%) | 0 (0.0%) |
| $10,000 to $14,999 | 10 (7.9%) | 8 (61.5%) |
| $15,000 to $19,999 | 12 (9.5%) | 0 (0.0%) |
| $20,000 to $24,999 | 6 (4.7%) | 0 (0.0%) |
| $25,000 to $34,999 | 12 (9.5%) | 2 (15.4%) |
| $35,000 to $49,999 | 14 (11.0%) | 3 (23.1%) |
| $50,000 to $74,999 | 30 (23.6%) | 0 (0.0%) |
| $75,000 to $99,999 | 32 (25.2%) | 0 (0.0%) |
| $100,000 to $149,999 | 5 (3.9%) | 0 (0.0%) |
| $150,000 or more | 6 (4.7%) | 0 (0.0%) |
| Total | 127 (100.0%) | 13 (100.0%) |
Monthly Housing Cost Tiers in Mount Pleasant
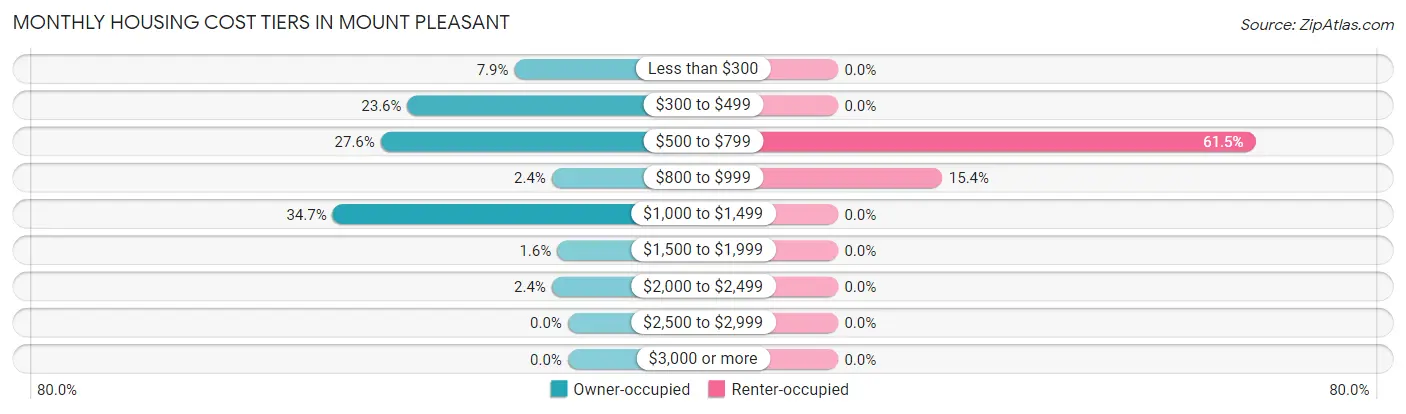
| Monthly Cost | Owner-occupied | Renter-occupied |
| Less than $300 | 10 (7.9%) | 0 (0.0%) |
| $300 to $499 | 30 (23.6%) | 0 (0.0%) |
| $500 to $799 | 35 (27.6%) | 8 (61.5%) |
| $800 to $999 | 3 (2.4%) | 2 (15.4%) |
| $1,000 to $1,499 | 44 (34.6%) | 0 (0.0%) |
| $1,500 to $1,999 | 2 (1.6%) | 0 (0.0%) |
| $2,000 to $2,499 | 3 (2.4%) | 0 (0.0%) |
| $2,500 to $2,999 | 0 (0.0%) | 0 (0.0%) |
| $3,000 or more | 0 (0.0%) | 0 (0.0%) |
| Total | 127 (100.0%) | 13 (100.0%) |
Physical Housing Characteristics in Mount Pleasant
Housing Structures in Mount Pleasant
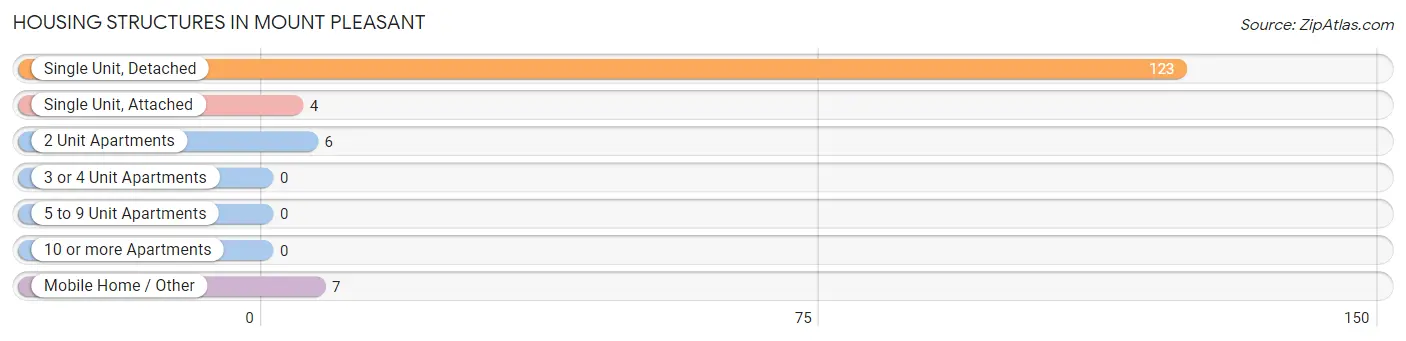
| Structure Type | # Housing Units | % Housing Units |
| Single Unit, Detached | 123 | 87.9% |
| Single Unit, Attached | 4 | 2.9% |
| 2 Unit Apartments | 6 | 4.3% |
| 3 or 4 Unit Apartments | 0 | 0.0% |
| 5 to 9 Unit Apartments | 0 | 0.0% |
| 10 or more Apartments | 0 | 0.0% |
| Mobile Home / Other | 7 | 5.0% |
| Total | 140 | 100.0% |
Housing Structures by Occupancy in Mount Pleasant
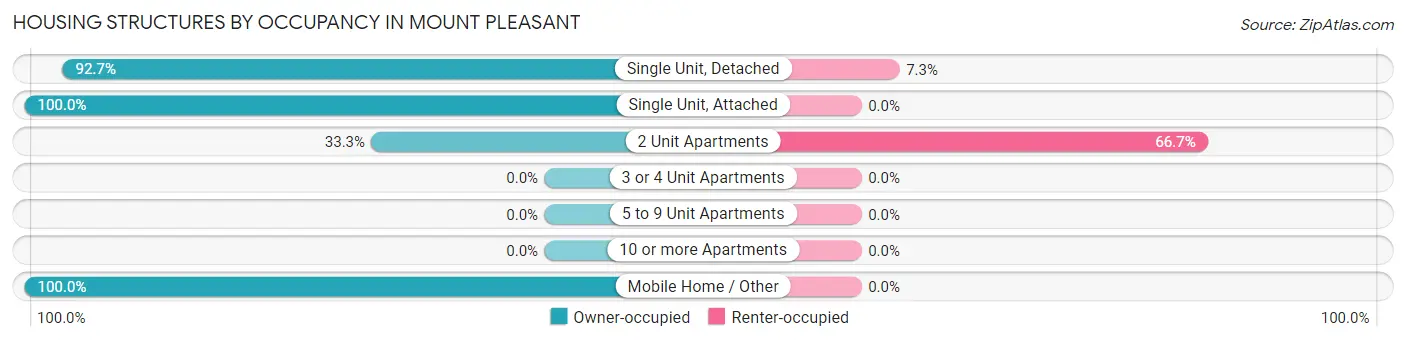
| Structure Type | Owner-occupied | Renter-occupied |
| Single Unit, Detached | 114 (92.7%) | 9 (7.3%) |
| Single Unit, Attached | 4 (100.0%) | 0 (0.0%) |
| 2 Unit Apartments | 2 (33.3%) | 4 (66.7%) |
| 3 or 4 Unit Apartments | 0 (0.0%) | 0 (0.0%) |
| 5 to 9 Unit Apartments | 0 (0.0%) | 0 (0.0%) |
| 10 or more Apartments | 0 (0.0%) | 0 (0.0%) |
| Mobile Home / Other | 7 (100.0%) | 0 (0.0%) |
| Total | 127 (90.7%) | 13 (9.3%) |
Housing Structures by Number of Rooms in Mount Pleasant
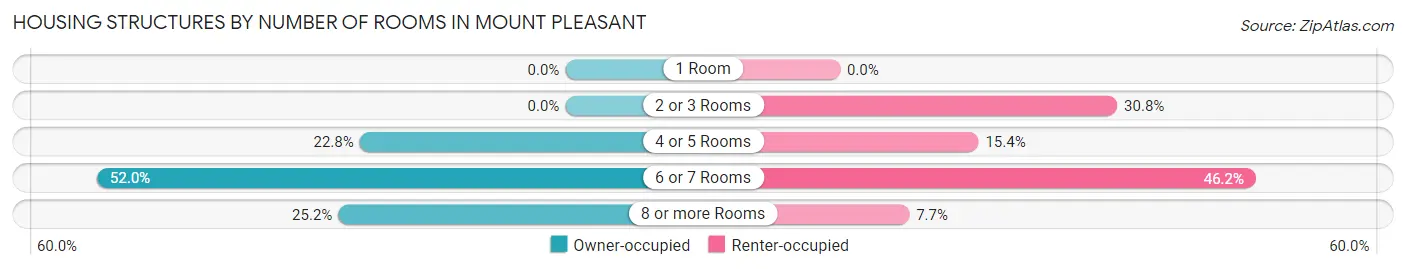
| Number of Rooms | Owner-occupied | Renter-occupied |
| 1 Room | 0 (0.0%) | 0 (0.0%) |
| 2 or 3 Rooms | 0 (0.0%) | 4 (30.8%) |
| 4 or 5 Rooms | 29 (22.8%) | 2 (15.4%) |
| 6 or 7 Rooms | 66 (52.0%) | 6 (46.2%) |
| 8 or more Rooms | 32 (25.2%) | 1 (7.7%) |
| Total | 127 (100.0%) | 13 (100.0%) |
Housing Structure by Heating Type in Mount Pleasant
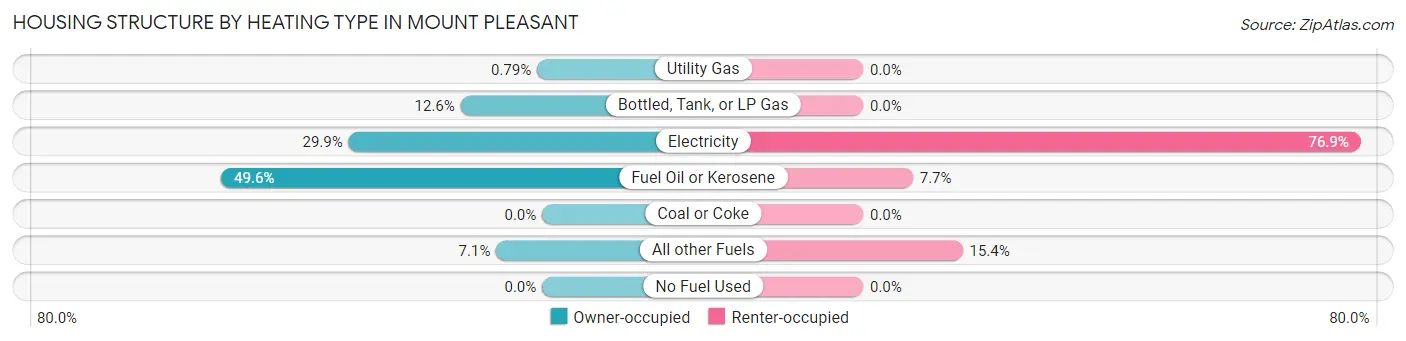
| Heating Type | Owner-occupied | Renter-occupied |
| Utility Gas | 1 (0.8%) | 0 (0.0%) |
| Bottled, Tank, or LP Gas | 16 (12.6%) | 0 (0.0%) |
| Electricity | 38 (29.9%) | 10 (76.9%) |
| Fuel Oil or Kerosene | 63 (49.6%) | 1 (7.7%) |
| Coal or Coke | 0 (0.0%) | 0 (0.0%) |
| All other Fuels | 9 (7.1%) | 2 (15.4%) |
| No Fuel Used | 0 (0.0%) | 0 (0.0%) |
| Total | 127 (100.0%) | 13 (100.0%) |
Household Vehicle Usage in Mount Pleasant
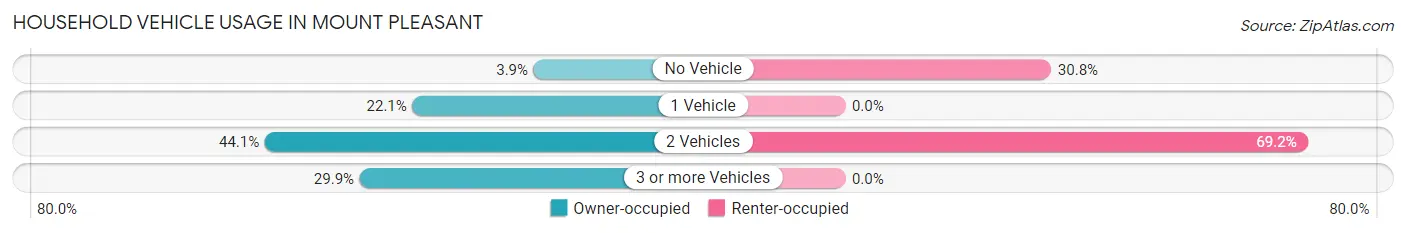
| Vehicles per Household | Owner-occupied | Renter-occupied |
| No Vehicle | 5 (3.9%) | 4 (30.8%) |
| 1 Vehicle | 28 (22.1%) | 0 (0.0%) |
| 2 Vehicles | 56 (44.1%) | 9 (69.2%) |
| 3 or more Vehicles | 38 (29.9%) | 0 (0.0%) |
| Total | 127 (100.0%) | 13 (100.0%) |
Real Estate & Mortgages in Mount Pleasant
Real Estate and Mortgage Overview in Mount Pleasant
| Characteristic | Without Mortgage | With Mortgage |
| Housing Units | 83 | 44 |
| Median Property Value | $96,800 | $178,800 |
| Median Household Income | $49,583 | $4 |
| Monthly Housing Costs | $530 | $0 |
| Real Estate Taxes | $854 | $0 |
Property Value by Mortgage Status in Mount Pleasant
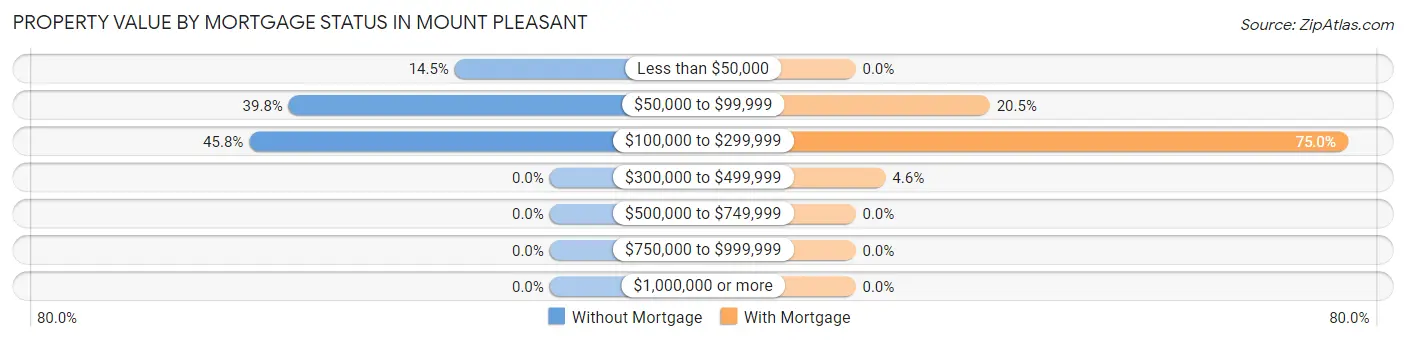
| Property Value | Without Mortgage | With Mortgage |
| Less than $50,000 | 12 (14.5%) | 0 (0.0%) |
| $50,000 to $99,999 | 33 (39.8%) | 9 (20.4%) |
| $100,000 to $299,999 | 38 (45.8%) | 33 (75.0%) |
| $300,000 to $499,999 | 0 (0.0%) | 2 (4.5%) |
| $500,000 to $749,999 | 0 (0.0%) | 0 (0.0%) |
| $750,000 to $999,999 | 0 (0.0%) | 0 (0.0%) |
| $1,000,000 or more | 0 (0.0%) | 0 (0.0%) |
| Total | 83 (100.0%) | 44 (100.0%) |
Household Income by Mortgage Status in Mount Pleasant
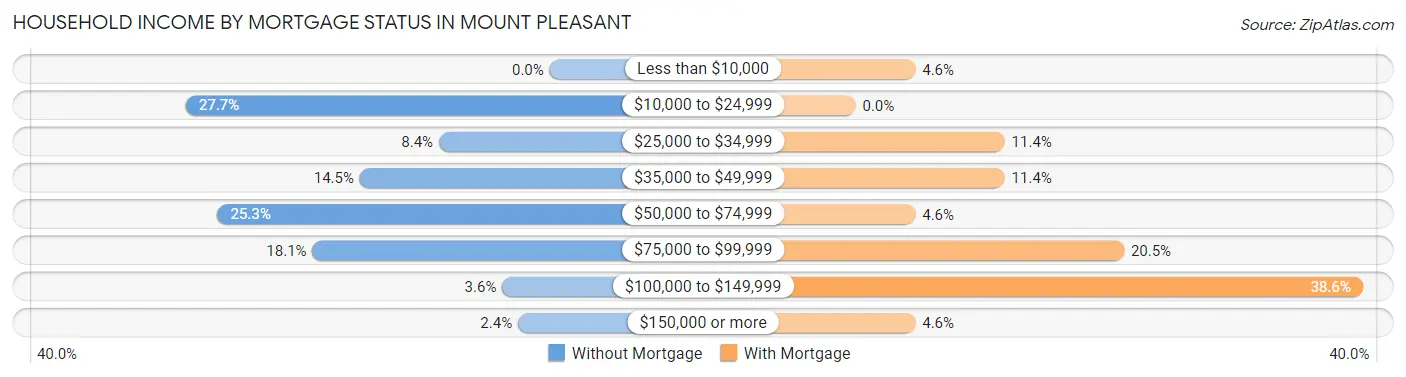
| Household Income | Without Mortgage | With Mortgage |
| Less than $10,000 | 0 (0.0%) | 2 (4.5%) |
| $10,000 to $24,999 | 23 (27.7%) | 0 (0.0%) |
| $25,000 to $34,999 | 7 (8.4%) | 5 (11.4%) |
| $35,000 to $49,999 | 12 (14.5%) | 5 (11.4%) |
| $50,000 to $74,999 | 21 (25.3%) | 2 (4.5%) |
| $75,000 to $99,999 | 15 (18.1%) | 9 (20.4%) |
| $100,000 to $149,999 | 3 (3.6%) | 17 (38.6%) |
| $150,000 or more | 2 (2.4%) | 2 (4.5%) |
| Total | 83 (100.0%) | 44 (100.0%) |
Property Value to Household Income Ratio in Mount Pleasant
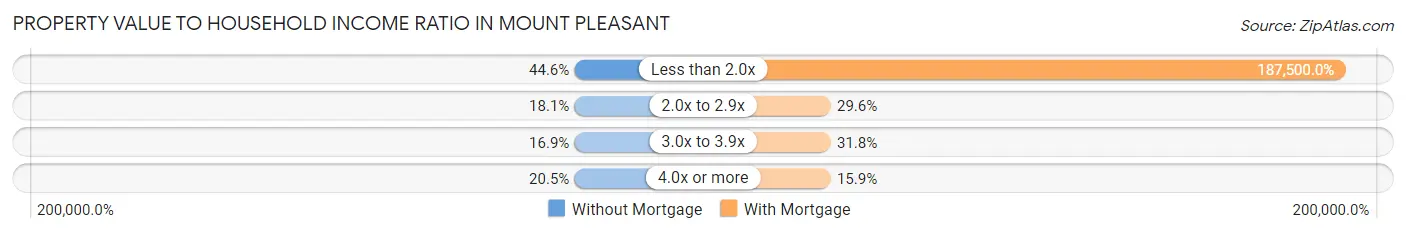
| Value-to-Income Ratio | Without Mortgage | With Mortgage |
| Less than 2.0x | 37 (44.6%) | 82,500 (187,500.0%) |
| 2.0x to 2.9x | 15 (18.1%) | 13 (29.5%) |
| 3.0x to 3.9x | 14 (16.9%) | 14 (31.8%) |
| 4.0x or more | 17 (20.5%) | 7 (15.9%) |
| Total | 83 (100.0%) | 44 (100.0%) |
Real Estate Taxes by Mortgage Status in Mount Pleasant
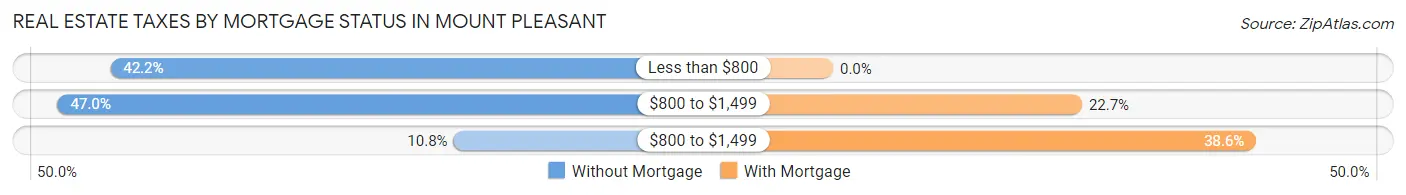
| Property Taxes | Without Mortgage | With Mortgage |
| Less than $800 | 35 (42.2%) | 0 (0.0%) |
| $800 to $1,499 | 39 (47.0%) | 10 (22.7%) |
| $800 to $1,499 | 9 (10.8%) | 17 (38.6%) |
| Total | 83 (100.0%) | 44 (100.0%) |
Health & Disability in Mount Pleasant
Health Insurance Coverage by Age in Mount Pleasant
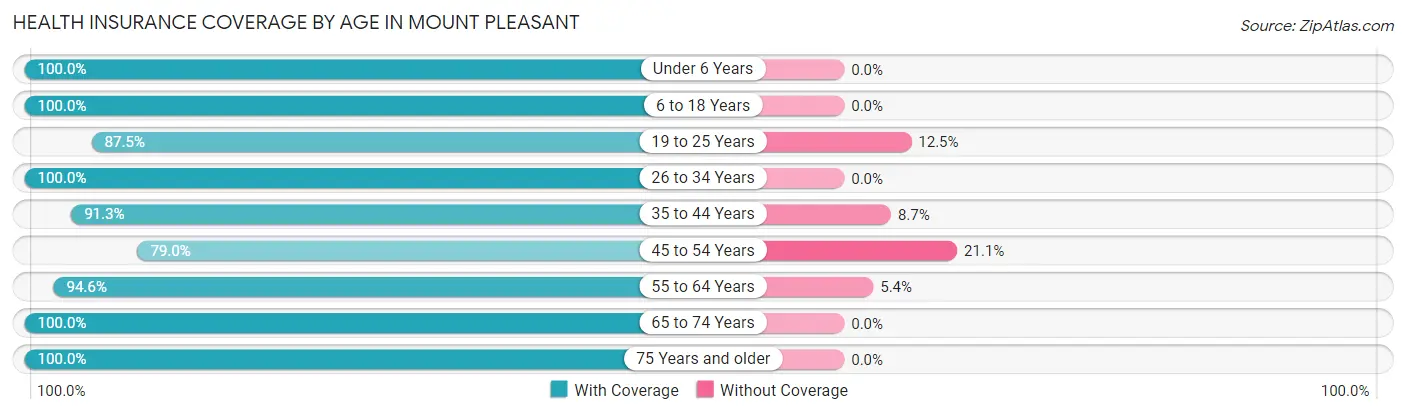
| Age Bracket | With Coverage | Without Coverage |
| Under 6 Years | 11 (100.0%) | 0 (0.0%) |
| 6 to 18 Years | 19 (100.0%) | 0 (0.0%) |
| 19 to 25 Years | 21 (87.5%) | 3 (12.5%) |
| 26 to 34 Years | 18 (100.0%) | 0 (0.0%) |
| 35 to 44 Years | 21 (91.3%) | 2 (8.7%) |
| 45 to 54 Years | 30 (78.9%) | 8 (21.0%) |
| 55 to 64 Years | 70 (94.6%) | 4 (5.4%) |
| 65 to 74 Years | 55 (100.0%) | 0 (0.0%) |
| 75 Years and older | 29 (100.0%) | 0 (0.0%) |
| Total | 274 (94.2%) | 17 (5.8%) |
Health Insurance Coverage by Citizenship Status in Mount Pleasant
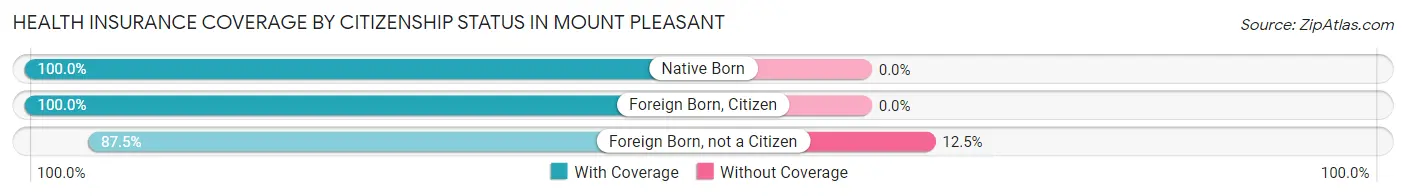
| Citizenship Status | With Coverage | Without Coverage |
| Native Born | 11 (100.0%) | 0 (0.0%) |
| Foreign Born, Citizen | 19 (100.0%) | 0 (0.0%) |
| Foreign Born, not a Citizen | 21 (87.5%) | 3 (12.5%) |
Health Insurance Coverage by Household Income in Mount Pleasant
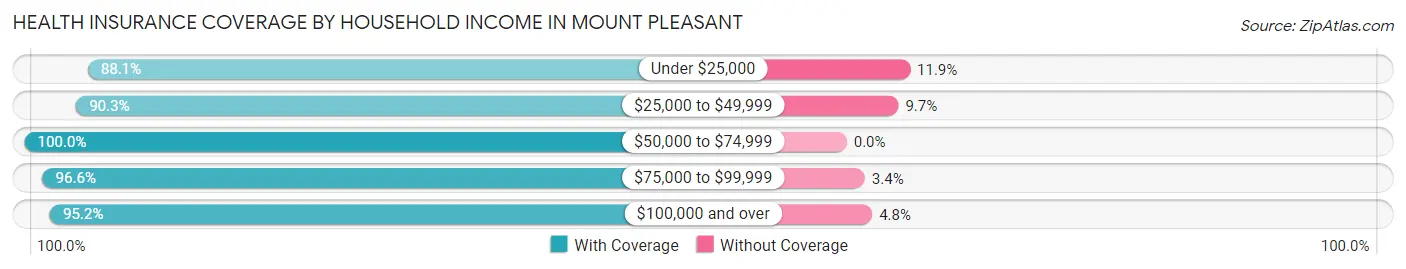
| Household Income | With Coverage | Without Coverage |
| Under $25,000 | 52 (88.1%) | 7 (11.9%) |
| $25,000 to $49,999 | 56 (90.3%) | 6 (9.7%) |
| $50,000 to $74,999 | 69 (100.0%) | 0 (0.0%) |
| $75,000 to $99,999 | 57 (96.6%) | 2 (3.4%) |
| $100,000 and over | 40 (95.2%) | 2 (4.8%) |
Public vs Private Health Insurance Coverage by Age in Mount Pleasant
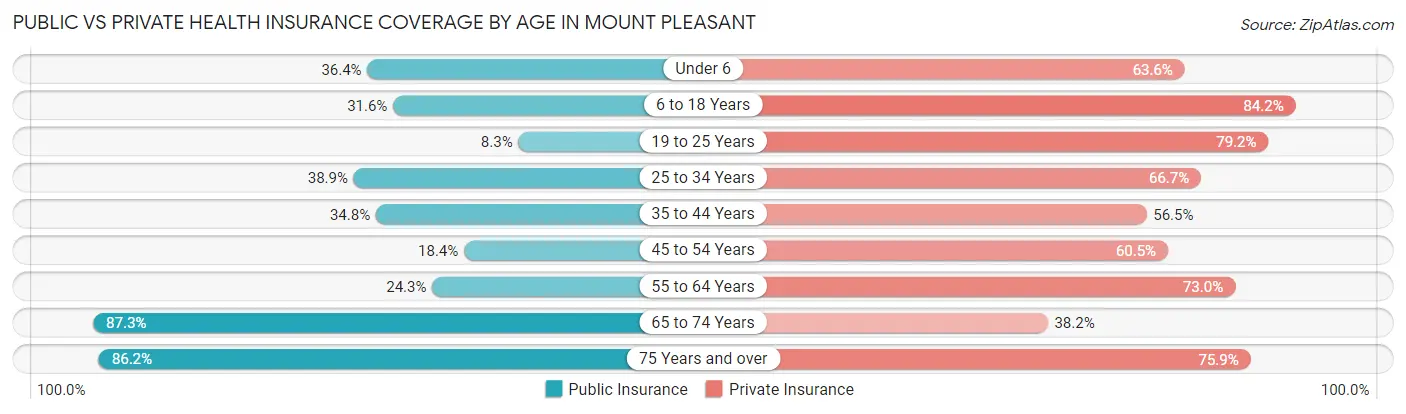
| Age Bracket | Public Insurance | Private Insurance |
| Under 6 | 4 (36.4%) | 7 (63.6%) |
| 6 to 18 Years | 6 (31.6%) | 16 (84.2%) |
| 19 to 25 Years | 2 (8.3%) | 19 (79.2%) |
| 25 to 34 Years | 7 (38.9%) | 12 (66.7%) |
| 35 to 44 Years | 8 (34.8%) | 13 (56.5%) |
| 45 to 54 Years | 7 (18.4%) | 23 (60.5%) |
| 55 to 64 Years | 18 (24.3%) | 54 (73.0%) |
| 65 to 74 Years | 48 (87.3%) | 21 (38.2%) |
| 75 Years and over | 25 (86.2%) | 22 (75.9%) |
| Total | 125 (43.0%) | 187 (64.3%) |
Disability Status by Sex by Age in Mount Pleasant
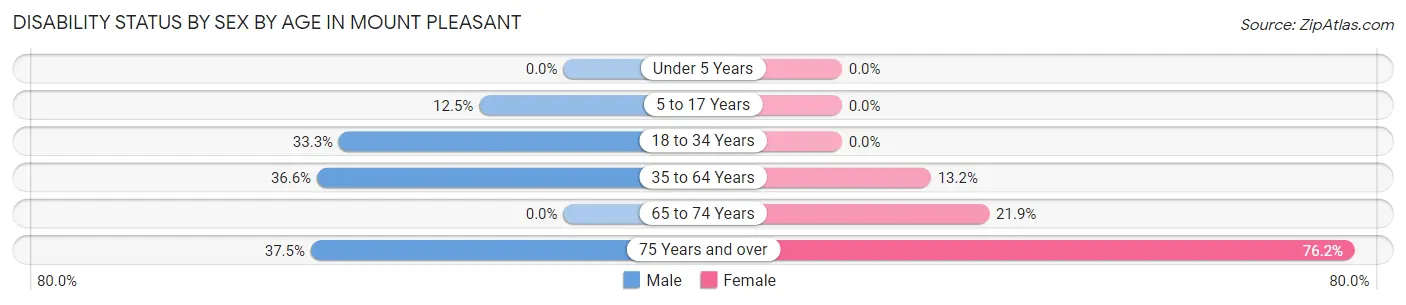
| Age Bracket | Male | Female |
| Under 5 Years | 0 (0.0%) | 0 (0.0%) |
| 5 to 17 Years | 1 (12.5%) | 0 (0.0%) |
| 18 to 34 Years | 10 (33.3%) | 0 (0.0%) |
| 35 to 64 Years | 30 (36.6%) | 7 (13.2%) |
| 65 to 74 Years | 0 (0.0%) | 7 (21.9%) |
| 75 Years and over | 3 (37.5%) | 16 (76.2%) |
Disability Class by Sex by Age in Mount Pleasant
Disability Class: Hearing Difficulty
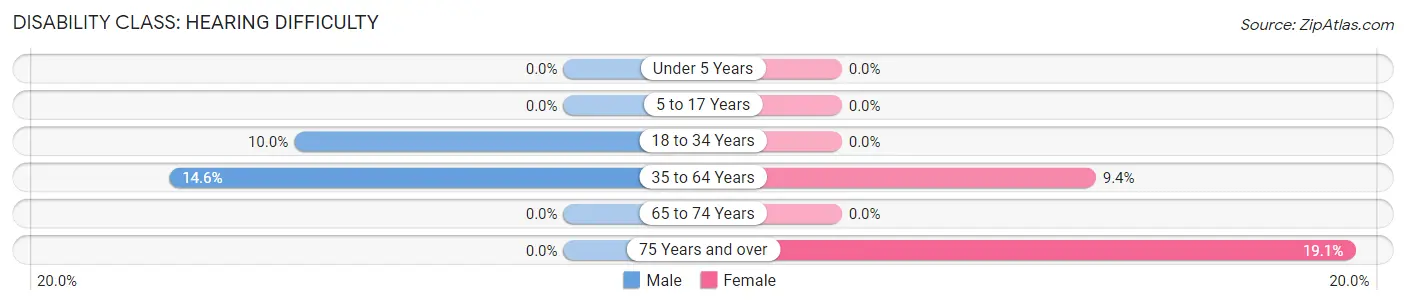
| Age Bracket | Male | Female |
| Under 5 Years | 0 (0.0%) | 0 (0.0%) |
| 5 to 17 Years | 0 (0.0%) | 0 (0.0%) |
| 18 to 34 Years | 3 (10.0%) | 0 (0.0%) |
| 35 to 64 Years | 12 (14.6%) | 5 (9.4%) |
| 65 to 74 Years | 0 (0.0%) | 0 (0.0%) |
| 75 Years and over | 0 (0.0%) | 4 (19.1%) |
Disability Class: Vision Difficulty
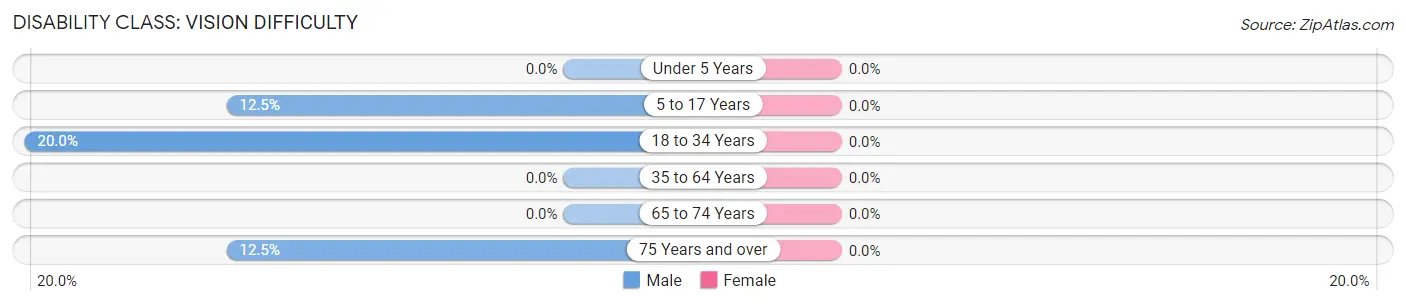
| Age Bracket | Male | Female |
| Under 5 Years | 0 (0.0%) | 0 (0.0%) |
| 5 to 17 Years | 1 (12.5%) | 0 (0.0%) |
| 18 to 34 Years | 6 (20.0%) | 0 (0.0%) |
| 35 to 64 Years | 0 (0.0%) | 0 (0.0%) |
| 65 to 74 Years | 0 (0.0%) | 0 (0.0%) |
| 75 Years and over | 1 (12.5%) | 0 (0.0%) |
Disability Class: Cognitive Difficulty
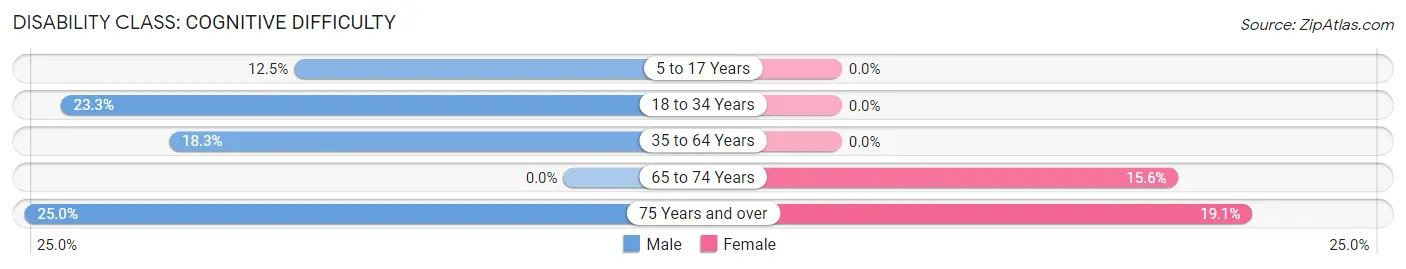
| Age Bracket | Male | Female |
| 5 to 17 Years | 1 (12.5%) | 0 (0.0%) |
| 18 to 34 Years | 7 (23.3%) | 0 (0.0%) |
| 35 to 64 Years | 15 (18.3%) | 0 (0.0%) |
| 65 to 74 Years | 0 (0.0%) | 5 (15.6%) |
| 75 Years and over | 2 (25.0%) | 4 (19.1%) |
Disability Class: Ambulatory Difficulty
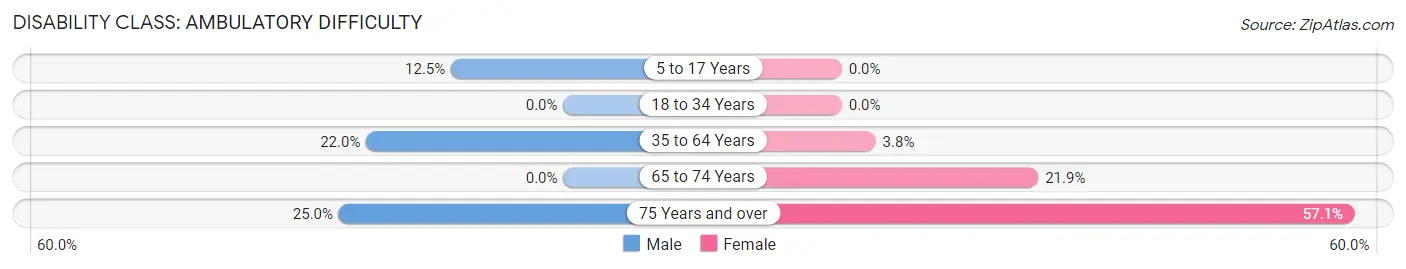
| Age Bracket | Male | Female |
| 5 to 17 Years | 1 (12.5%) | 0 (0.0%) |
| 18 to 34 Years | 0 (0.0%) | 0 (0.0%) |
| 35 to 64 Years | 18 (22.0%) | 2 (3.8%) |
| 65 to 74 Years | 0 (0.0%) | 7 (21.9%) |
| 75 Years and over | 2 (25.0%) | 12 (57.1%) |
Disability Class: Self-Care Difficulty
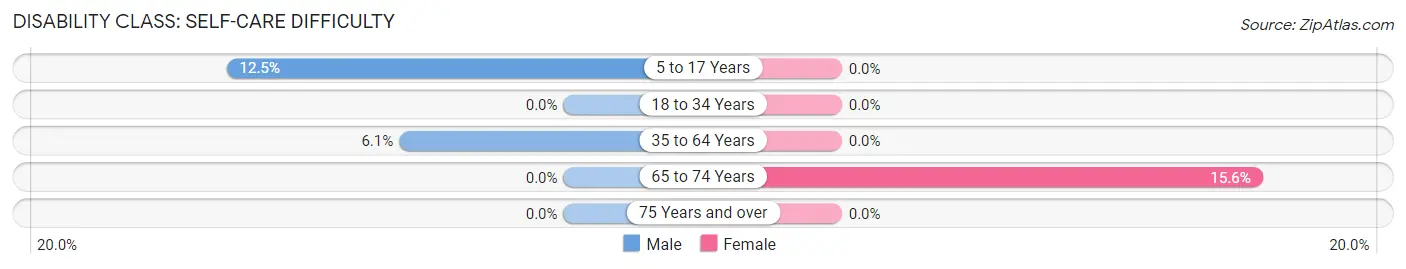
| Age Bracket | Male | Female |
| 5 to 17 Years | 1 (12.5%) | 0 (0.0%) |
| 18 to 34 Years | 0 (0.0%) | 0 (0.0%) |
| 35 to 64 Years | 5 (6.1%) | 0 (0.0%) |
| 65 to 74 Years | 0 (0.0%) | 5 (15.6%) |
| 75 Years and over | 0 (0.0%) | 0 (0.0%) |
Technology Access in Mount Pleasant
Computing Device Access in Mount Pleasant
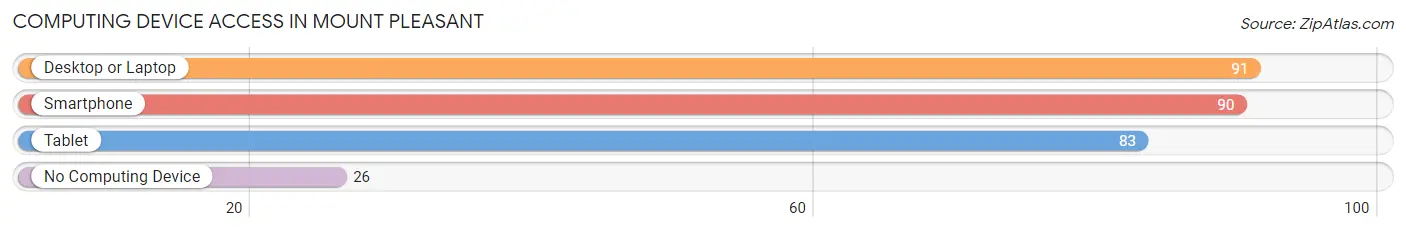
| Device Type | # Households | % Households |
| Desktop or Laptop | 91 | 65.0% |
| Smartphone | 90 | 64.3% |
| Tablet | 83 | 59.3% |
| No Computing Device | 26 | 18.6% |
| Total | 140 | 100.0% |
Internet Access in Mount Pleasant
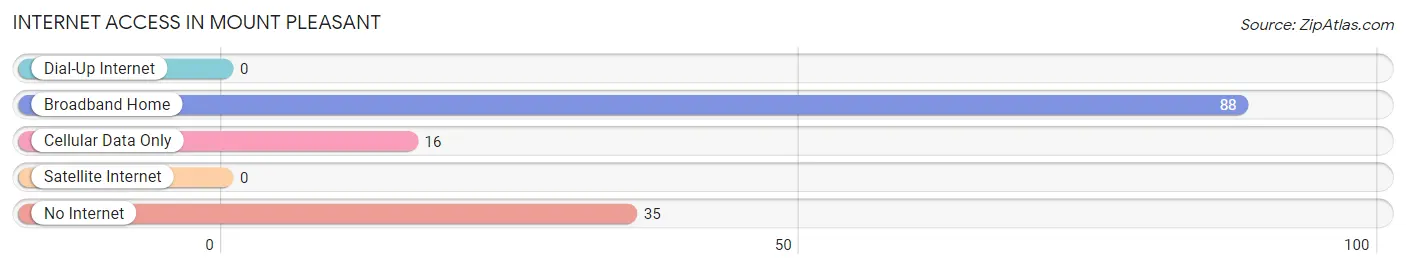
| Internet Type | # Households | % Households |
| Dial-Up Internet | 0 | 0.0% |
| Broadband Home | 88 | 62.9% |
| Cellular Data Only | 16 | 11.4% |
| Satellite Internet | 0 | 0.0% |
| No Internet | 35 | 25.0% |
| Total | 140 | 100.0% |
Mount Pleasant Summary
Introduction
Mount Pleasant is a small village located in Jefferson County, Ohio. It is situated on the banks of the Ohio River and is part of the Steubenville-Weirton Metropolitan Statistical Area. The village has a population of 1,845 as of the 2010 census. The village is known for its historic buildings, scenic views, and friendly atmosphere.
History
Mount Pleasant was founded in 1817 by a group of settlers from Pennsylvania. The village was named after the nearby Mount Pleasant Hill, which was named by the settlers for its scenic views. The village was incorporated in 1837 and was the first village in Jefferson County to be incorporated.
The village was an important stop on the Underground Railroad, with many of the local residents helping to hide and transport escaped slaves. The village was also home to a number of prominent abolitionists, including William Lloyd Garrison and John Brown.
The village was also home to a number of industries, including a woolen mill, a sawmill, and a gristmill. The village was also home to a number of churches, including the First Presbyterian Church, which was founded in 1820.
Geography
Mount Pleasant is located in the southeastern corner of Jefferson County, Ohio. The village is situated on the banks of the Ohio River and is part of the Steubenville-Weirton Metropolitan Statistical Area. The village is located approximately 25 miles south of Steubenville and 40 miles west of Pittsburgh.
The village is located in a hilly region, with the highest point being Mount Pleasant Hill, which is located just outside of the village. The village is located in a temperate climate, with hot summers and cold winters.
Economy
The economy of Mount Pleasant is largely based on agriculture and tourism. The village is home to a number of farms, which produce a variety of crops, including corn, soybeans, and wheat. The village is also home to a number of small businesses, including restaurants, shops, and a bed and breakfast.
The village is also home to a number of tourist attractions, including the Mount Pleasant Historical Society Museum, the Mount Pleasant Winery, and the Mount Pleasant Art Gallery. The village is also home to a number of festivals, including the Mount Pleasant Music Festival and the Mount Pleasant Wine Festival.
Demographics
As of the 2010 census, the population of Mount Pleasant was 1,845. The population is largely white (94.2%), with a small percentage of African Americans (2.2%) and Hispanics (1.3%). The median household income is $37,917, and the median home value is $90,000.
Conclusion
Mount Pleasant is a small village located in Jefferson County, Ohio. The village is known for its historic buildings, scenic views, and friendly atmosphere. The economy of the village is largely based on agriculture and tourism, and the population is largely white. The village is home to a number of tourist attractions, including the Mount Pleasant Historical Society Museum, the Mount Pleasant Winery, and the Mount Pleasant Art Gallery.
Common Questions
What is Per Capita Income in Mount Pleasant?
Per Capita income in Mount Pleasant is $33,134.
What is the Median Family Income in Mount Pleasant?
Median Family Income in Mount Pleasant is $54,167.
What is the Median Household income in Mount Pleasant?
Median Household Income in Mount Pleasant is $52,500.
What is Income or Wage Gap in Mount Pleasant?
Income or Wage Gap in Mount Pleasant is 53.2%.
Women in Mount Pleasant earn 46.8 cents for every dollar earned by a man.
What is Inequality or Gini Index in Mount Pleasant?
Inequality or Gini Index in Mount Pleasant is 0.46.
What is the Total Population of Mount Pleasant?
Total Population of Mount Pleasant is 291.
What is the Total Male Population of Mount Pleasant?
Total Male Population of Mount Pleasant is 157.
What is the Total Female Population of Mount Pleasant?
Total Female Population of Mount Pleasant is 134.
What is the Ratio of Males per 100 Females in Mount Pleasant?
There are 117.16 Males per 100 Females in Mount Pleasant.
What is the Ratio of Females per 100 Males in Mount Pleasant?
There are 85.35 Females per 100 Males in Mount Pleasant.
What is the Median Population Age in Mount Pleasant?
Median Population Age in Mount Pleasant is 58.9 Years.
What is the Average Family Size in Mount Pleasant
Average Family Size in Mount Pleasant is 2.7 People.
What is the Average Household Size in Mount Pleasant
Average Household Size in Mount Pleasant is 2.1 People.
How Large is the Labor Force in Mount Pleasant?
There are 145 People in the Labor Forcein in Mount Pleasant.
What is the Percentage of People in the Labor Force in Mount Pleasant?
54.7% of People are in the Labor Force in Mount Pleasant.
What is the Unemployment Rate in Mount Pleasant?
Unemployment Rate in Mount Pleasant is 10.3%.