Zip Codes with the Highest Percentage of Population Employed in Office & Administration in Lorain, OH
RELATED REPORTS & OPTIONS
Office & Administration
Lorain
Compare Zip Codes
Map of Zip Codes with the Highest Percentage of Population Employed in Office & Administration in Lorain
10.0%
12.6%
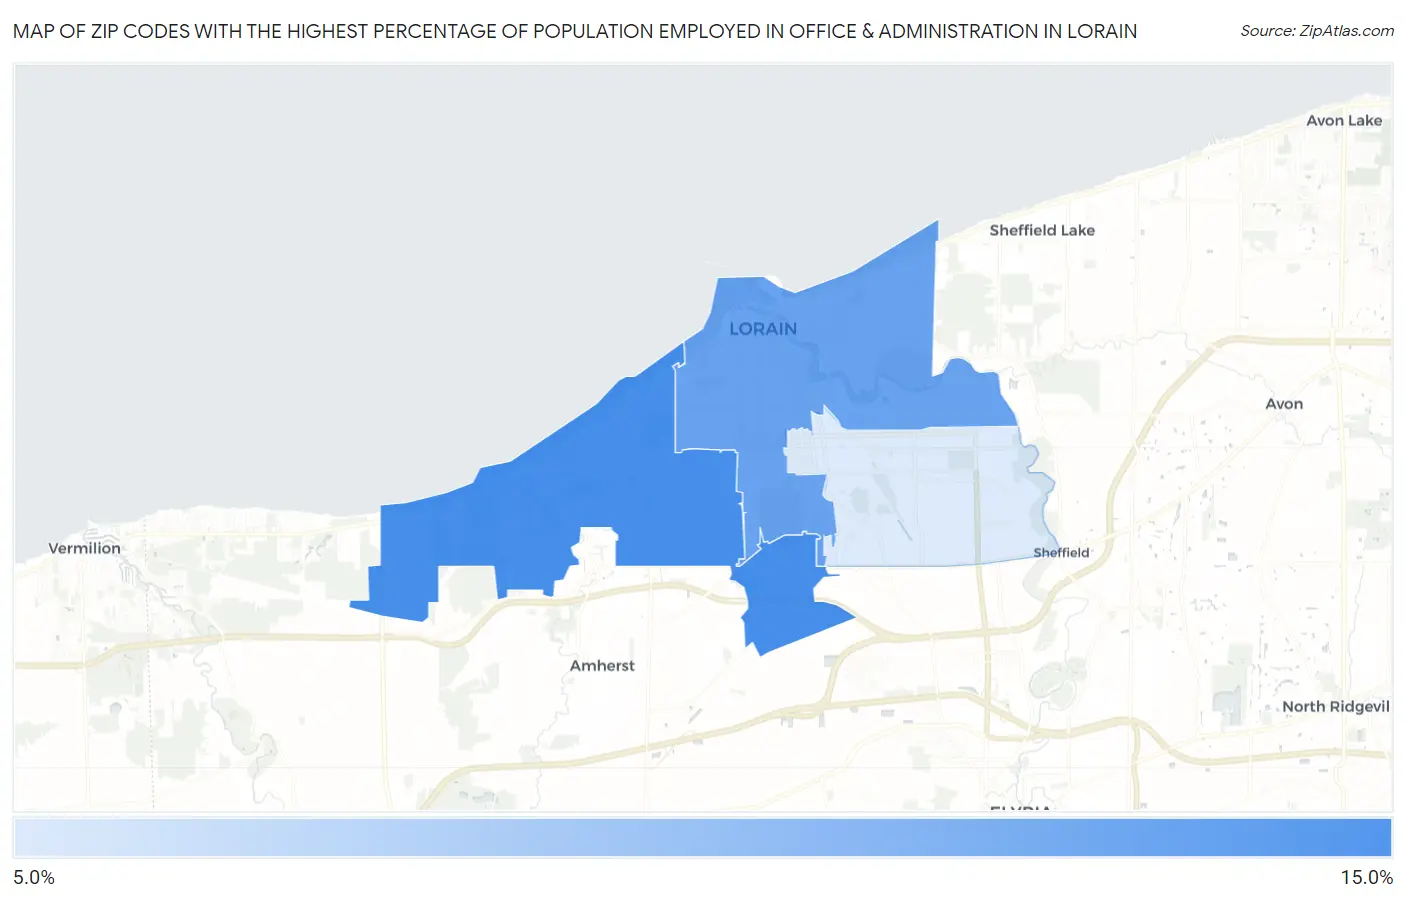
Zip Codes with the Highest Percentage of Population Employed in Office & Administration in Lorain, OH
| Zip Code | % Employed | vs State | vs National | |
| 1. | 44053 | 12.6% | 11.3%(+1.39)#343 | 10.9%(+1.79)#8,925 |
| 2. | 44052 | 12.1% | 11.3%(+0.802)#413 | 10.9%(+1.20)#10,543 |
| 3. | 44055 | 10.0% | 11.3%(-1.23)#688 | 10.9%(-0.835)#17,052 |
1
Common Questions
What are the Top Zip Codes with the Highest Percentage of Population Employed in Office & Administration in Lorain, OH?
Top Zip Codes with the Highest Percentage of Population Employed in Office & Administration in Lorain, OH are:
What zip code has the Highest Percentage of Population Employed in Office & Administration in Lorain, OH?
44053 has the Highest Percentage of Population Employed in Office & Administration in Lorain, OH with 12.6%.
What is the Percentage of Population Employed in Office & Administration in Lorain, OH?
Percentage of Population Employed in Office & Administration in Lorain is 11.7%.
What is the Percentage of Population Employed in Office & Administration in Ohio?
Percentage of Population Employed in Office & Administration in Ohio is 11.3%.
What is the Percentage of Population Employed in Office & Administration in the United States?
Percentage of Population Employed in Office & Administration in the United States is 10.9%.