Zip Codes with the Highest Percentage of Population Employed in Office & Administration in Westerville, OH
RELATED REPORTS & OPTIONS
Office & Administration
Westerville
Compare Zip Codes
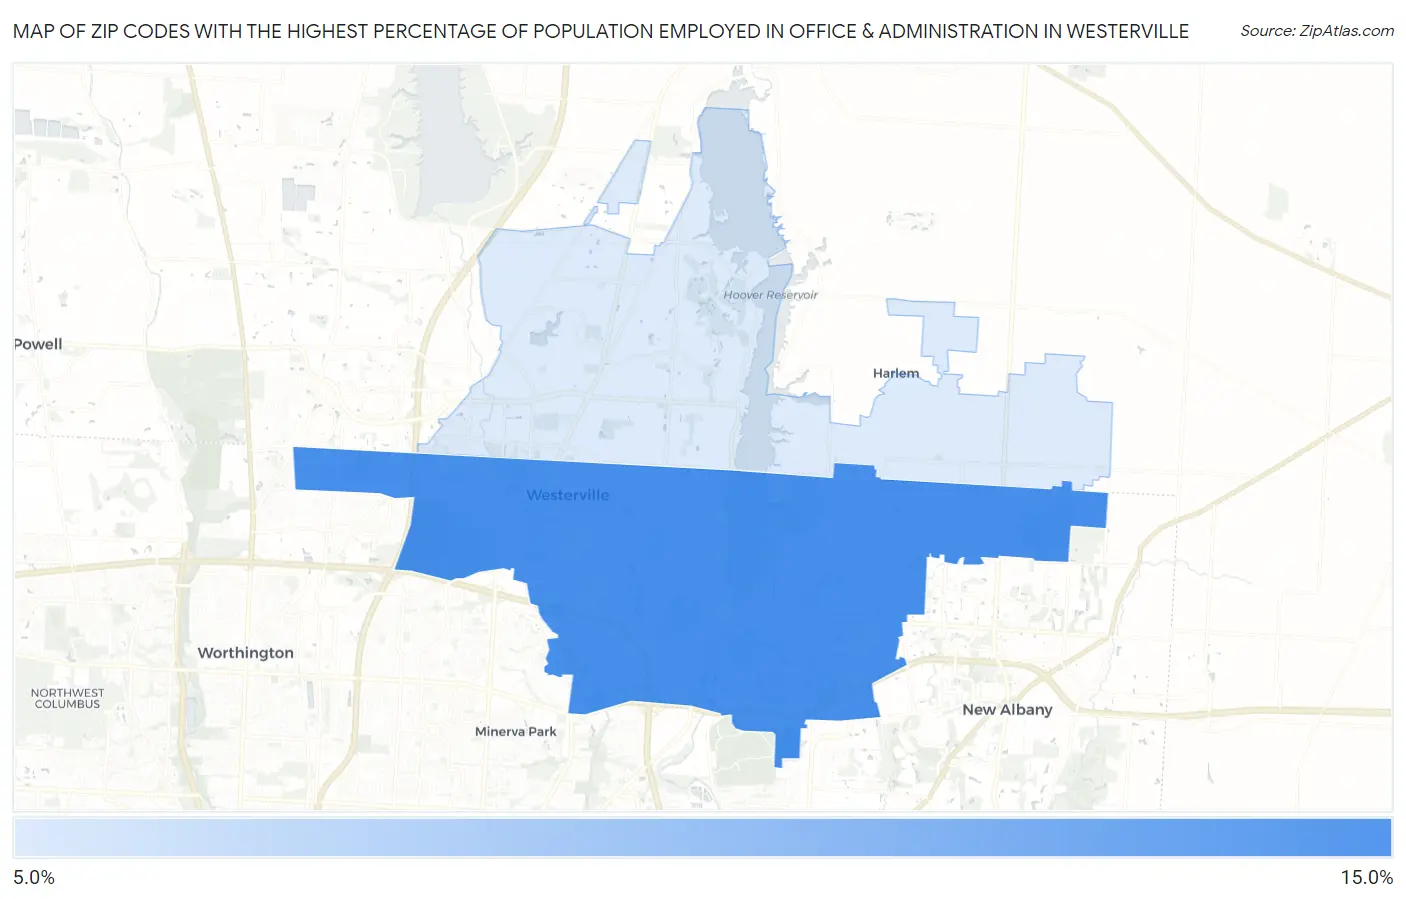
Map of Zip Codes with the Highest Percentage of Population Employed in Office & Administration in Westerville
7.5%
10.8%
Zip Codes with the Highest Percentage of Population Employed in Office & Administration in Westerville, OH
| Zip Code | % Employed | vs State | vs National | |
| 1. | 43081 | 10.8% | 11.3%(-0.455)#590 | 10.9%(-0.055)#14,509 |
| 2. | 43082 | 7.5% | 11.3%(-3.71)#923 | 10.9%(-3.31)#24,057 |
1
Common Questions
What are the Top Zip Codes with the Highest Percentage of Population Employed in Office & Administration in Westerville, OH?
Top Zip Codes with the Highest Percentage of Population Employed in Office & Administration in Westerville, OH are:
What zip code has the Highest Percentage of Population Employed in Office & Administration in Westerville, OH?
43081 has the Highest Percentage of Population Employed in Office & Administration in Westerville, OH with 10.8%.
What is the Percentage of Population Employed in Office & Administration in Westerville, OH?
Percentage of Population Employed in Office & Administration in Westerville is 9.9%.
What is the Percentage of Population Employed in Office & Administration in Ohio?
Percentage of Population Employed in Office & Administration in Ohio is 11.3%.
What is the Percentage of Population Employed in Office & Administration in the United States?
Percentage of Population Employed in Office & Administration in the United States is 10.9%.