La Croft, OH Map & Demographics
La Croft Map
La Croft Overview
$27,882
PER CAPITA INCOME
$58,783
AVG FAMILY INCOME
$40,179
AVG HOUSEHOLD INCOME
15.4%
WAGE / INCOME GAP [ % ]
84.6¢/ $1
WAGE / INCOME GAP [ $ ]
$7,043
FAMILY INCOME DEFICIT
0.33
INEQUALITY / GINI INDEX
1,133
TOTAL POPULATION
577
MALE POPULATION
556
FEMALE POPULATION
103.78
MALES / 100 FEMALES
96.36
FEMALES / 100 MALES
50.6
MEDIAN AGE
2.6
AVG FAMILY SIZE
2.0
AVG HOUSEHOLD SIZE
609
LABOR FORCE [ PEOPLE ]
57.9%
PERCENT IN LABOR FORCE
8.7%
UNEMPLOYMENT RATE
Income in La Croft
Income Overview in La Croft
Per Capita Income in La Croft is $27,882, while median incomes of families and households are $58,783 and $40,179 respectively.
| Characteristic | Number | Measure |
| Per Capita Income | 1,133 | $27,882 |
| Median Family Income | 307 | $58,783 |
| Mean Family Income | 307 | $58,430 |
| Median Household Income | 563 | $40,179 |
| Mean Household Income | 563 | $51,324 |
| Income Deficit | 307 | $7,043 |
| Wage / Income Gap (%) | 1,133 | 15.35% |
| Wage / Income Gap ($) | 1,133 | 84.65¢ per $1 |
| Gini / Inequality Index | 1,133 | 0.33 |
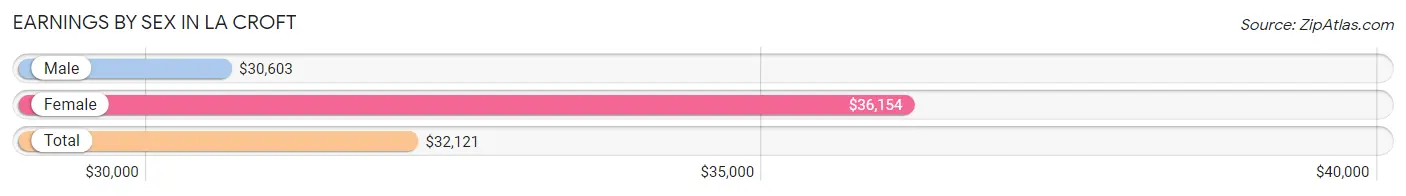
Earnings by Sex in La Croft
Average Earnings in La Croft are $32,121, $30,603 for men and $36,154 for women, a difference of 15.3%.
| Sex | Number | Average Earnings |
| Male | 385 (53.5%) | $30,603 |
| Female | 334 (46.5%) | $36,154 |
| Total | 719 (100.0%) | $32,121 |
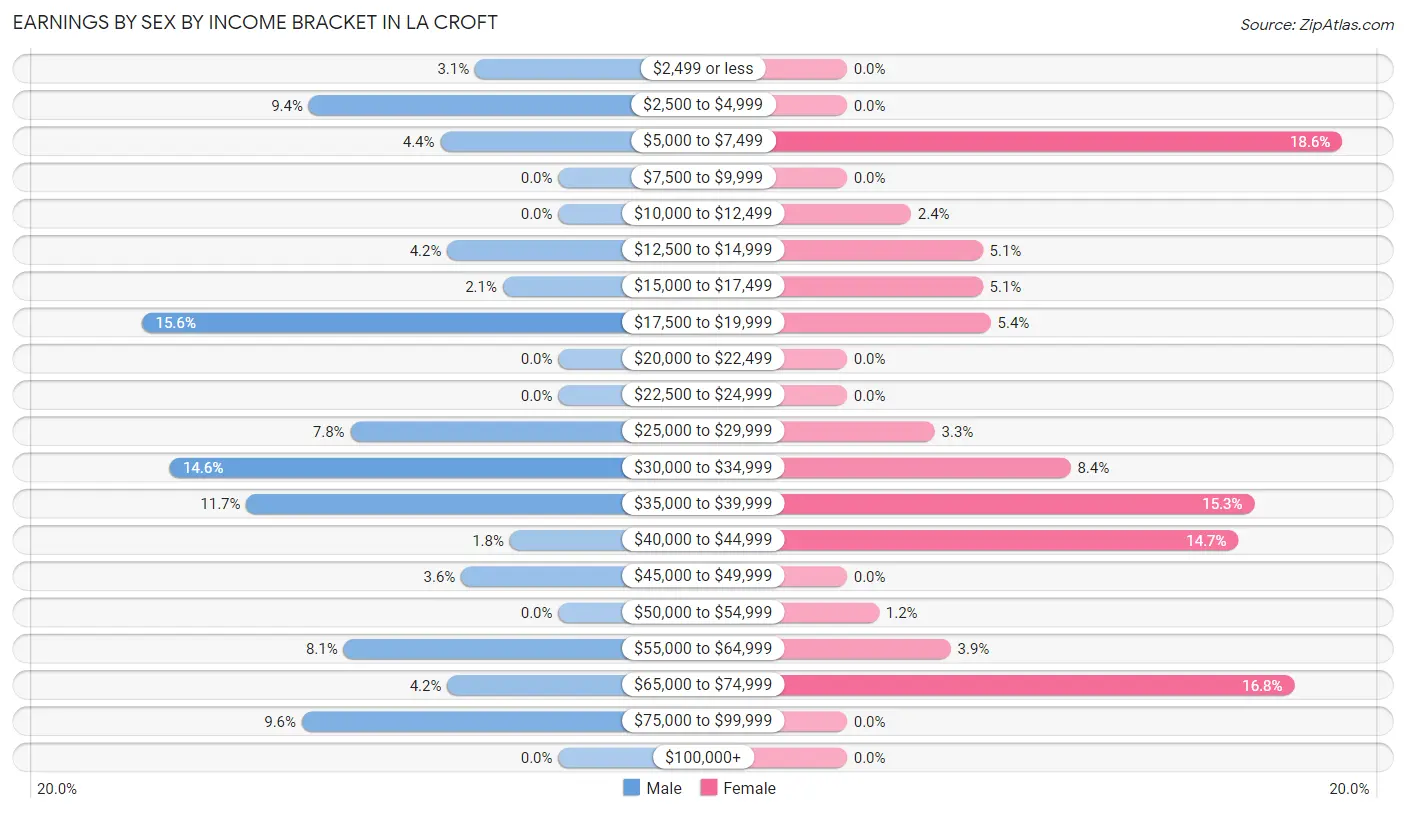
Earnings by Sex by Income Bracket in La Croft
The most common earnings brackets in La Croft are $17,500 to $19,999 for men (60 | 15.6%) and $5,000 to $7,499 for women (62 | 18.6%).
| Income | Male | Female |
| $2,499 or less | 12 (3.1%) | 0 (0.0%) |
| $2,500 to $4,999 | 36 (9.3%) | 0 (0.0%) |
| $5,000 to $7,499 | 17 (4.4%) | 62 (18.6%) |
| $7,500 to $9,999 | 0 (0.0%) | 0 (0.0%) |
| $10,000 to $12,499 | 0 (0.0%) | 8 (2.4%) |
| $12,500 to $14,999 | 16 (4.2%) | 17 (5.1%) |
| $15,000 to $17,499 | 8 (2.1%) | 17 (5.1%) |
| $17,500 to $19,999 | 60 (15.6%) | 18 (5.4%) |
| $20,000 to $22,499 | 0 (0.0%) | 0 (0.0%) |
| $22,500 to $24,999 | 0 (0.0%) | 0 (0.0%) |
| $25,000 to $29,999 | 30 (7.8%) | 11 (3.3%) |
| $30,000 to $34,999 | 56 (14.5%) | 28 (8.4%) |
| $35,000 to $39,999 | 45 (11.7%) | 51 (15.3%) |
| $40,000 to $44,999 | 7 (1.8%) | 49 (14.7%) |
| $45,000 to $49,999 | 14 (3.6%) | 0 (0.0%) |
| $50,000 to $54,999 | 0 (0.0%) | 4 (1.2%) |
| $55,000 to $64,999 | 31 (8.1%) | 13 (3.9%) |
| $65,000 to $74,999 | 16 (4.2%) | 56 (16.8%) |
| $75,000 to $99,999 | 37 (9.6%) | 0 (0.0%) |
| $100,000+ | 0 (0.0%) | 0 (0.0%) |
| Total | 385 (100.0%) | 334 (100.0%) |
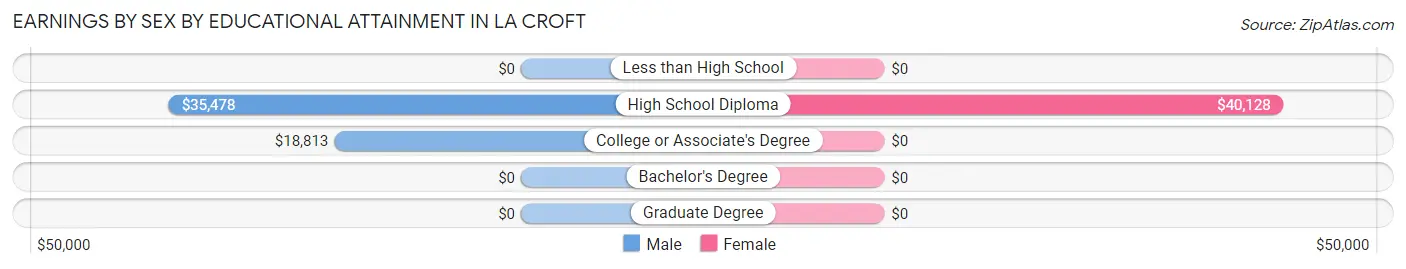
Earnings by Sex by Educational Attainment in La Croft
Average earnings in La Croft are $35,056 for men and $39,145 for women, a difference of 10.4%. Men with an educational attainment of high school diploma enjoy the highest average annual earnings of $35,478, while those with college or associate's degree education earn the least with $18,813. Women with an educational attainment of high school diploma earn the most with the average annual earnings of $40,128, while those with high school diploma education have the smallest earnings of $40,128.
| Educational Attainment | Male Income | Female Income |
| Less than High School | - | - |
| High School Diploma | $35,478 | $40,128 |
| College or Associate's Degree | $18,813 | $0 |
| Bachelor's Degree | - | - |
| Graduate Degree | - | - |
| Total | $35,056 | $39,145 |
Family Income in La Croft
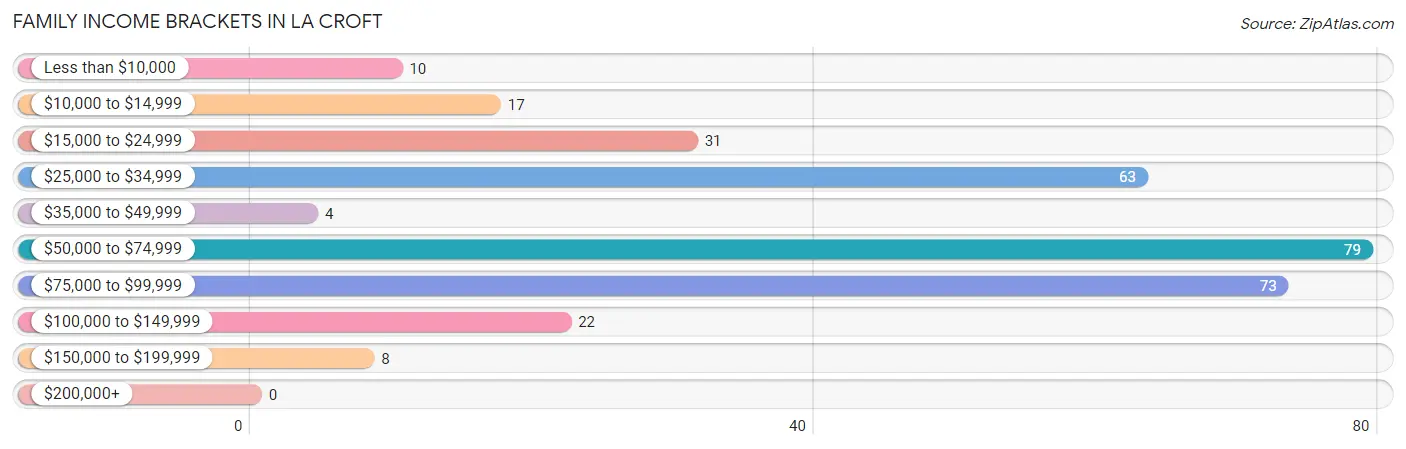
Family Income Brackets in La Croft
According to the La Croft family income data, there are 79 families falling into the $50,000 to $74,999 income range, which is the most common income bracket and makes up 25.7% of all families.
| Income Bracket | # Families | % Families |
| Less than $10,000 | 10 | 3.3% |
| $10,000 to $14,999 | 17 | 5.5% |
| $15,000 to $24,999 | 31 | 10.1% |
| $25,000 to $34,999 | 63 | 20.5% |
| $35,000 to $49,999 | 4 | 1.3% |
| $50,000 to $74,999 | 79 | 25.7% |
| $75,000 to $99,999 | 73 | 23.8% |
| $100,000 to $149,999 | 22 | 7.2% |
| $150,000 to $199,999 | 8 | 2.6% |
| $200,000+ | 0 | 0.0% |
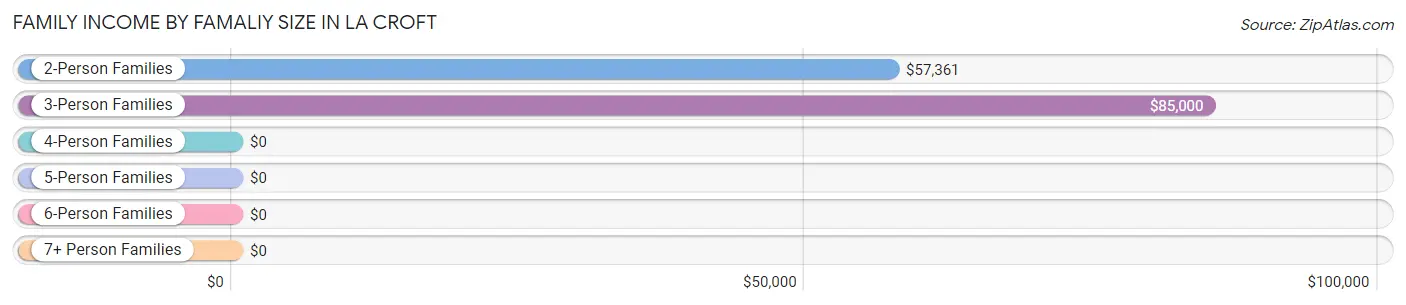
Family Income by Famaliy Size in La Croft
3-person families (62 | 20.2%) account for the highest median family income in La Croft with $85,000 per family, while 2-person families (213 | 69.4%) have the highest median income of $28,680 per family member.
| Income Bracket | # Families | Median Income |
| 2-Person Families | 213 (69.4%) | $57,361 |
| 3-Person Families | 62 (20.2%) | $85,000 |
| 4-Person Families | 25 (8.1%) | $0 |
| 5-Person Families | 0 (0.0%) | $0 |
| 6-Person Families | 7 (2.3%) | $0 |
| 7+ Person Families | 0 (0.0%) | $0 |
| Total | 307 (100.0%) | $58,783 |
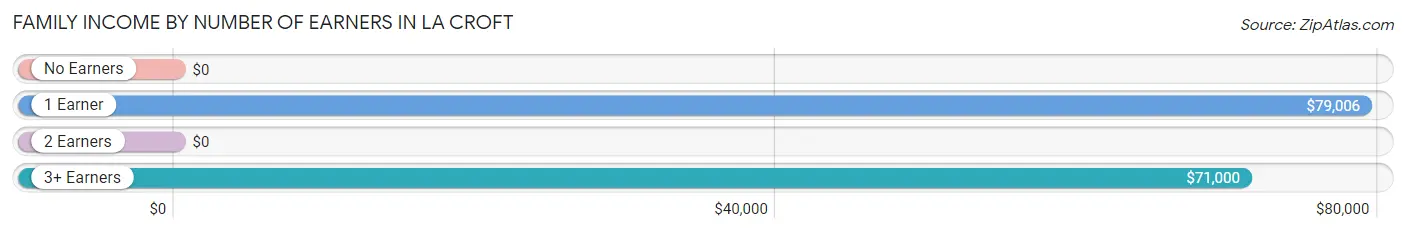
Family Income by Number of Earners in La Croft
| Number of Earners | # Families | Median Income |
| No Earners | 54 (17.6%) | $0 |
| 1 Earner | 71 (23.1%) | $79,006 |
| 2 Earners | 140 (45.6%) | $0 |
| 3+ Earners | 42 (13.7%) | $71,000 |
| Total | 307 (100.0%) | $58,783 |
Household Income in La Croft
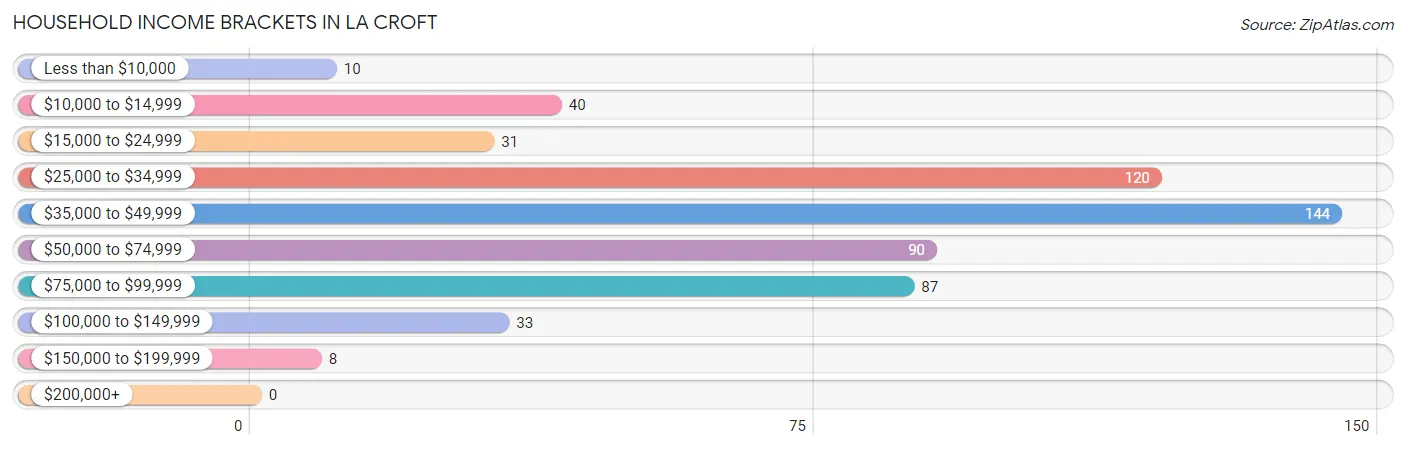
Household Income Brackets in La Croft
With 144 households falling in the category, the $35,000 to $49,999 income range is the most frequent in La Croft, accounting for 25.6% of all households.
| Income Bracket | # Households | % Households |
| Less than $10,000 | 10 | 1.8% |
| $10,000 to $14,999 | 40 | 7.1% |
| $15,000 to $24,999 | 31 | 5.5% |
| $25,000 to $34,999 | 120 | 21.3% |
| $35,000 to $49,999 | 144 | 25.6% |
| $50,000 to $74,999 | 90 | 16.0% |
| $75,000 to $99,999 | 87 | 15.5% |
| $100,000 to $149,999 | 33 | 5.9% |
| $150,000 to $199,999 | 8 | 1.4% |
| $200,000+ | 0 | 0.0% |
Household Income by Householder Age in La Croft
The median household income in La Croft is $40,179, with the highest median household income of $62,563 found in the 65+ years age bracket for the primary householder. A total of 97 households (17.2%) fall into this category. Meanwhile, the 15 to 24 years age bracket for the primary householder has the lowest median household income of $0, with 39 households (6.9%) in this group.
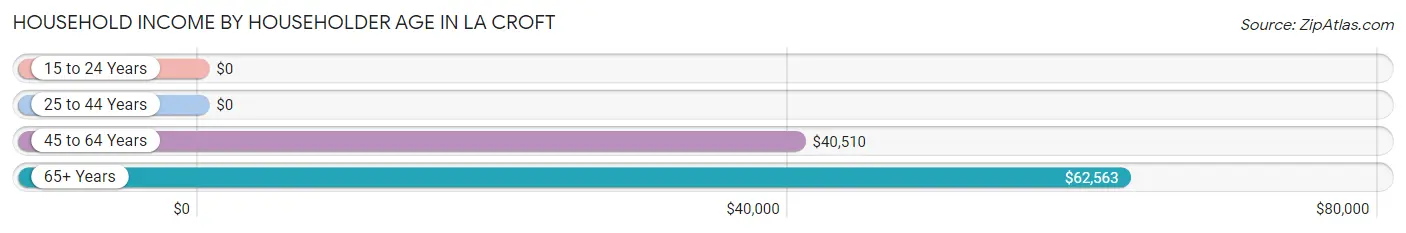
| Income Bracket | # Households | Median Income |
| 15 to 24 Years | 39 (6.9%) | $0 |
| 25 to 44 Years | 51 (9.1%) | $0 |
| 45 to 64 Years | 376 (66.8%) | $40,510 |
| 65+ Years | 97 (17.2%) | $62,563 |
| Total | 563 (100.0%) | $40,179 |
Poverty in La Croft
Income Below Poverty by Sex and Age in La Croft
With 11.8% poverty level for males and 16.0% for females among the residents of La Croft, under 5 year old males and 18 to 24 year old females are the most vulnerable to poverty, with 11 males (100.0%) and 39 females (39.0%) in their respective age groups living below the poverty level.
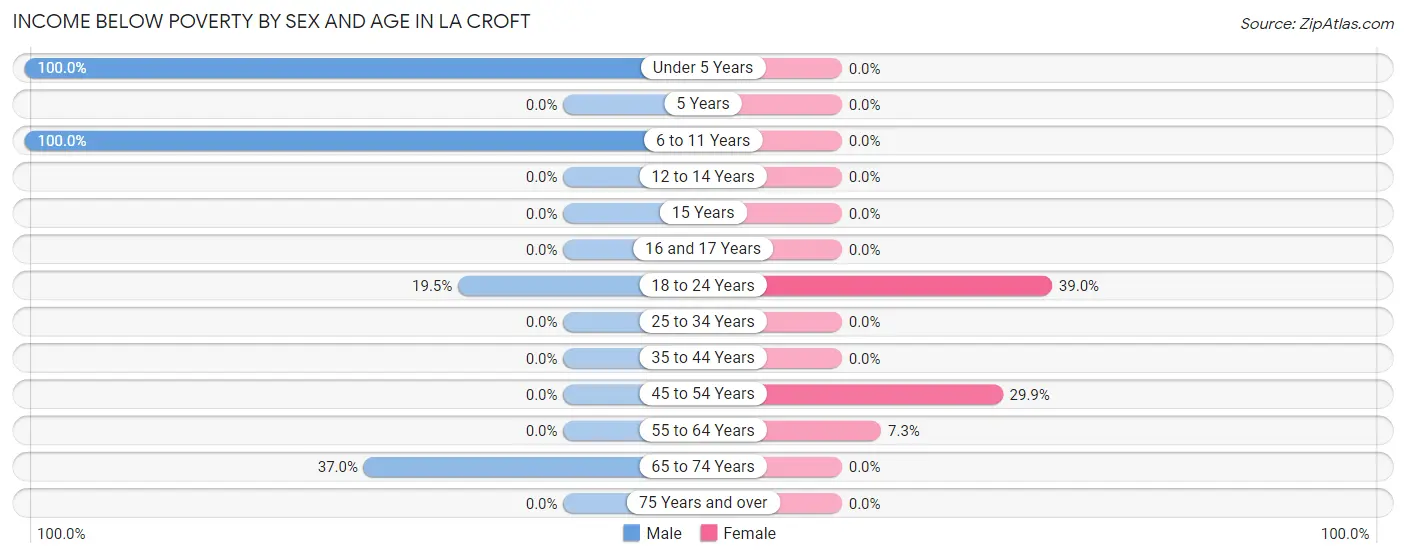
| Age Bracket | Male | Female |
| Under 5 Years | 11 (100.0%) | 0 (0.0%) |
| 5 Years | 0 (0.0%) | 0 (0.0%) |
| 6 to 11 Years | 10 (100.0%) | 0 (0.0%) |
| 12 to 14 Years | 0 (0.0%) | 0 (0.0%) |
| 15 Years | 0 (0.0%) | 0 (0.0%) |
| 16 and 17 Years | 0 (0.0%) | 0 (0.0%) |
| 18 to 24 Years | 17 (19.5%) | 39 (39.0%) |
| 25 to 34 Years | 0 (0.0%) | 0 (0.0%) |
| 35 to 44 Years | 0 (0.0%) | 0 (0.0%) |
| 45 to 54 Years | 0 (0.0%) | 40 (29.8%) |
| 55 to 64 Years | 0 (0.0%) | 10 (7.3%) |
| 65 to 74 Years | 30 (37.0%) | 0 (0.0%) |
| 75 Years and over | 0 (0.0%) | 0 (0.0%) |
| Total | 68 (11.8%) | 89 (16.0%) |
Income Above Poverty by Sex and Age in La Croft
According to the poverty statistics in La Croft, males aged 12 to 14 years and females aged under 5 years are the age groups that are most secure financially, with 100.0% of males and 100.0% of females in these age groups living above the poverty line.
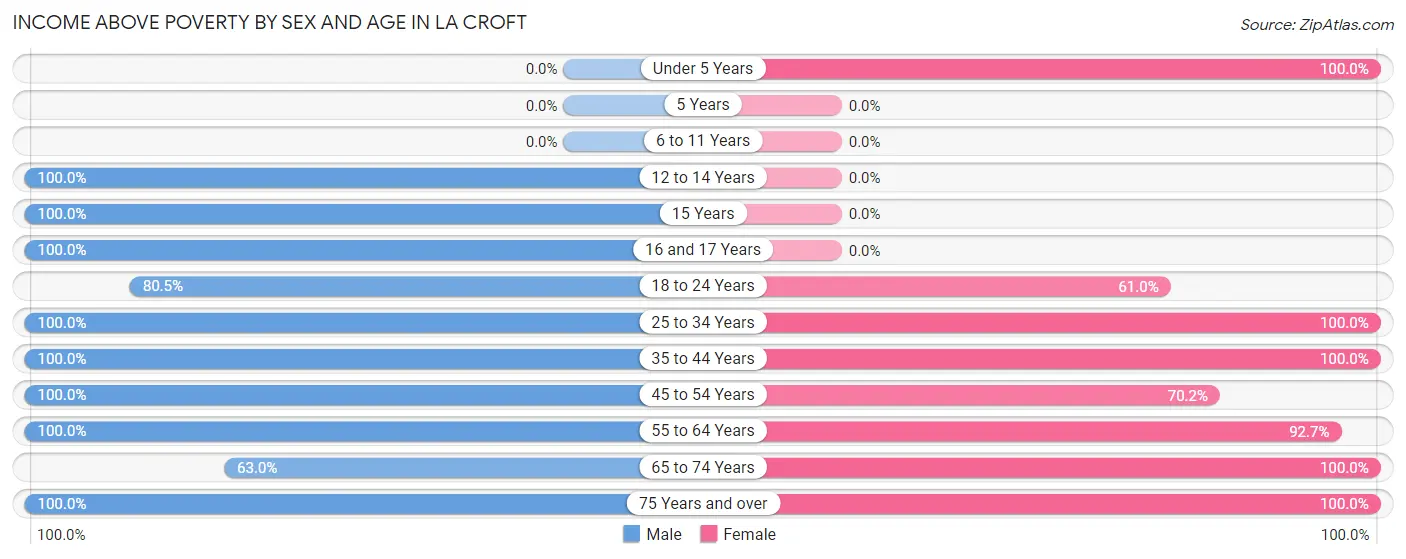
| Age Bracket | Male | Female |
| Under 5 Years | 0 (0.0%) | 14 (100.0%) |
| 5 Years | 0 (0.0%) | 0 (0.0%) |
| 6 to 11 Years | 0 (0.0%) | 0 (0.0%) |
| 12 to 14 Years | 27 (100.0%) | 0 (0.0%) |
| 15 Years | 20 (100.0%) | 0 (0.0%) |
| 16 and 17 Years | 14 (100.0%) | 0 (0.0%) |
| 18 to 24 Years | 70 (80.5%) | 61 (61.0%) |
| 25 to 34 Years | 17 (100.0%) | 19 (100.0%) |
| 35 to 44 Years | 38 (100.0%) | 73 (100.0%) |
| 45 to 54 Years | 72 (100.0%) | 94 (70.2%) |
| 55 to 64 Years | 183 (100.0%) | 127 (92.7%) |
| 65 to 74 Years | 51 (63.0%) | 49 (100.0%) |
| 75 Years and over | 17 (100.0%) | 30 (100.0%) |
| Total | 509 (88.2%) | 467 (84.0%) |
Income Below Poverty Among Married-Couple Families in La Croft
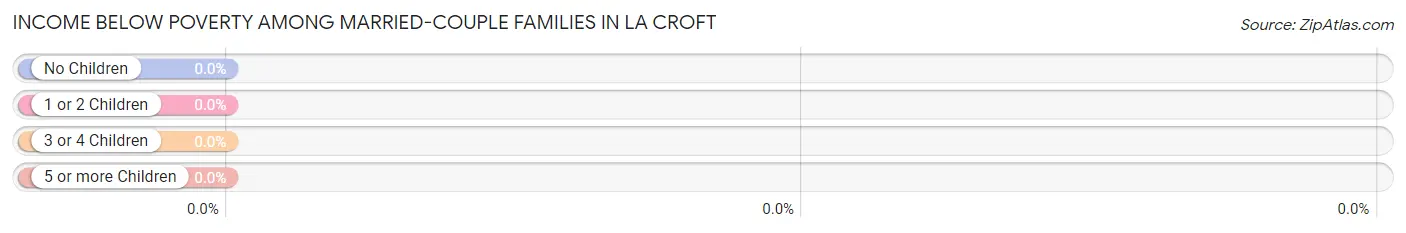
| Children | Above Poverty | Below Poverty |
| No Children | 119 (100.0%) | 0 (0.0%) |
| 1 or 2 Children | 45 (100.0%) | 0 (0.0%) |
| 3 or 4 Children | 0 (0.0%) | 0 (0.0%) |
| 5 or more Children | 0 (0.0%) | 0 (0.0%) |
| Total | 164 (100.0%) | 0 (0.0%) |
Income Below Poverty Among Single-Parent Households in La Croft
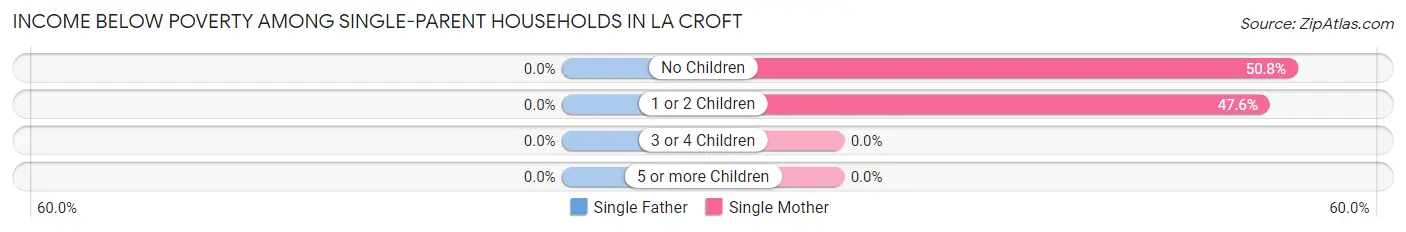
| Children | Single Father | Single Mother |
| No Children | 0 (0.0%) | 34 (50.7%) |
| 1 or 2 Children | 0 (0.0%) | 10 (47.6%) |
| 3 or 4 Children | 0 (0.0%) | 0 (0.0%) |
| 5 or more Children | 0 (0.0%) | 0 (0.0%) |
| Total | 0 (0.0%) | 44 (50.0%) |
Income Below Poverty Among Married-Couple vs Single-Parent Households in La Croft
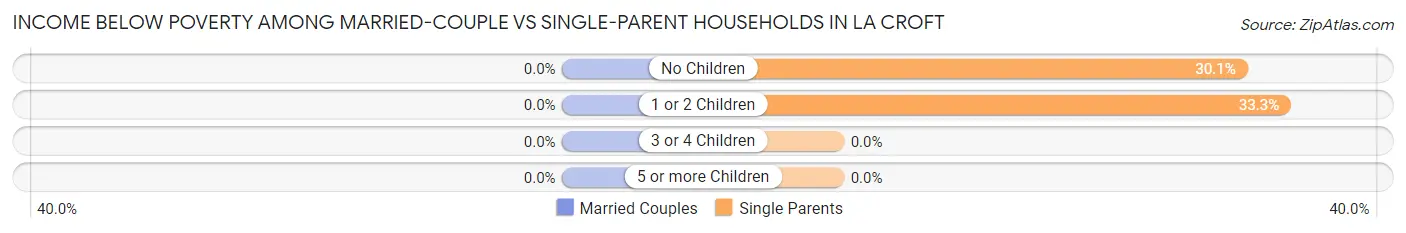
| Children | Married-Couple Families | Single-Parent Households |
| No Children | 0 (0.0%) | 34 (30.1%) |
| 1 or 2 Children | 0 (0.0%) | 10 (33.3%) |
| 3 or 4 Children | 0 (0.0%) | 0 (0.0%) |
| 5 or more Children | 0 (0.0%) | 0 (0.0%) |
| Total | 0 (0.0%) | 44 (30.8%) |
Race in La Croft
The most populous races in La Croft are White / Caucasian (1,106 | 97.6%), Black / African American (23 | 2.0%), and Two or more Races (4 | 0.4%).
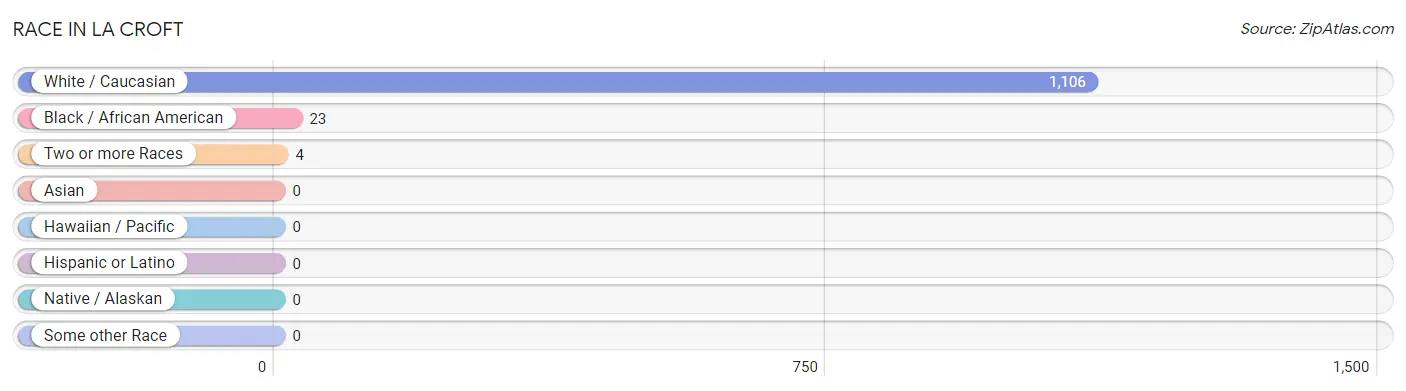
| Race | # Population | % Population |
| Asian | 0 | 0.0% |
| Black / African American | 23 | 2.0% |
| Hawaiian / Pacific | 0 | 0.0% |
| Hispanic or Latino | 0 | 0.0% |
| Native / Alaskan | 0 | 0.0% |
| White / Caucasian | 1,106 | 97.6% |
| Two or more Races | 4 | 0.4% |
| Some other Race | 0 | 0.0% |
| Total | 1,133 | 100.0% |
Ancestry in La Croft
The most populous ancestries reported in La Croft are English (342 | 30.2%), American (177 | 15.6%), German (153 | 13.5%), Irish (134 | 11.8%), and Italian (78 | 6.9%), together accounting for 78.0% of all La Croft residents.
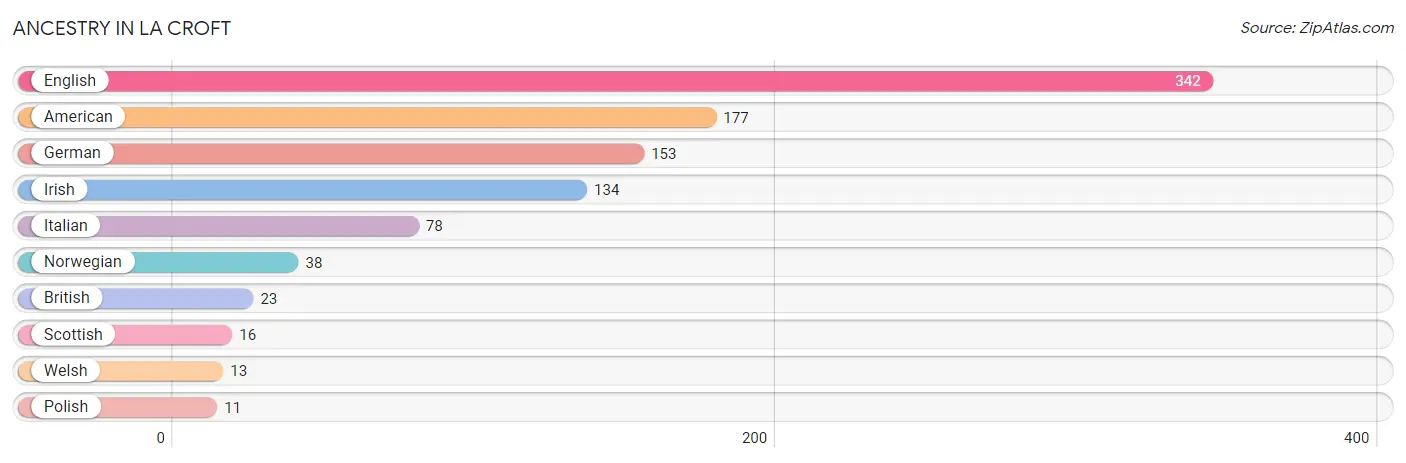
| Ancestry | # Population | % Population |
| American | 177 | 15.6% |
| British | 23 | 2.0% |
| English | 342 | 30.2% |
| German | 153 | 13.5% |
| Irish | 134 | 11.8% |
| Italian | 78 | 6.9% |
| Norwegian | 38 | 3.4% |
| Polish | 11 | 1.0% |
| Scottish | 16 | 1.4% |
| Welsh | 13 | 1.1% | View All 10 Rows |
Immigrants in La Croft

| Immigration Origin | # Population | % Population | View All 0 Rows |
Sex and Age in La Croft
Sex and Age in La Croft
The most populous age groups in La Croft are 55 to 59 Years (94 | 16.3%) for men and 55 to 59 Years (113 | 20.3%) for women.
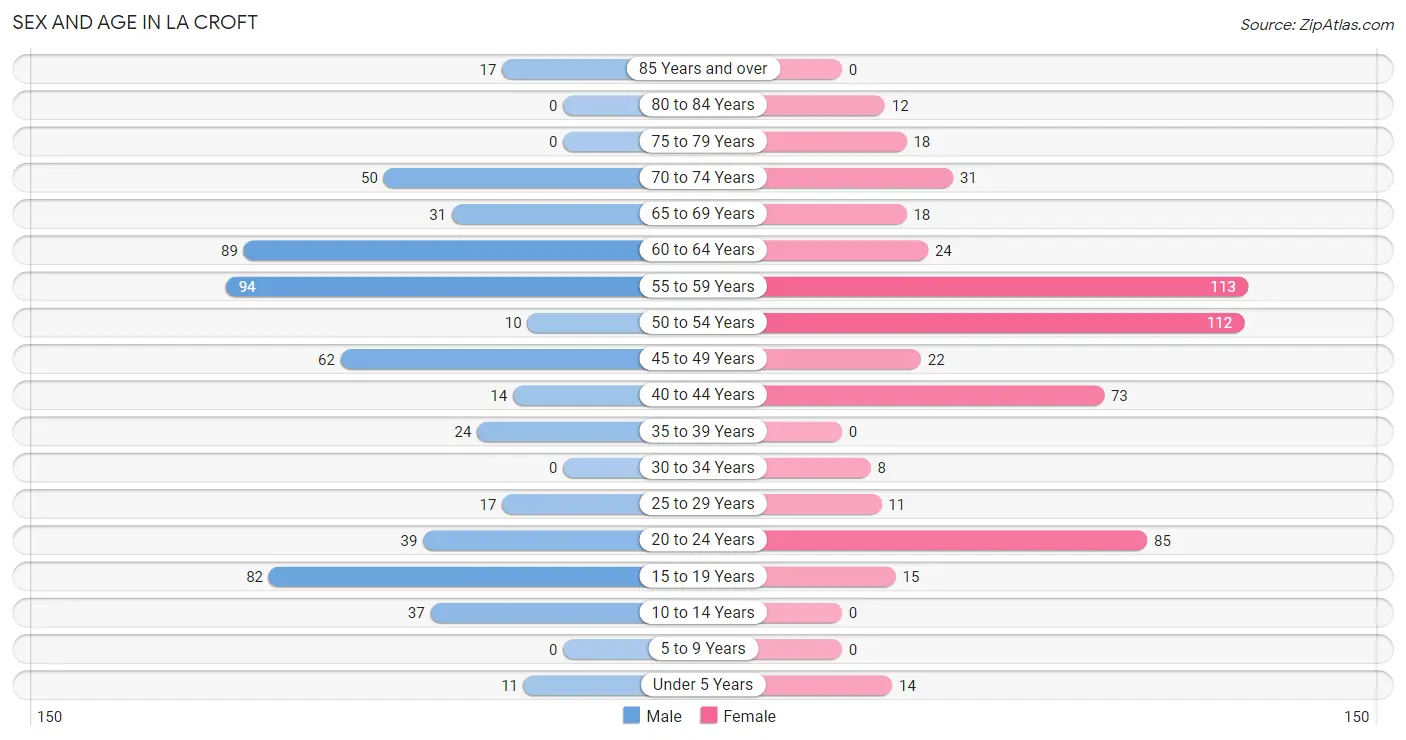
| Age Bracket | Male | Female |
| Under 5 Years | 11 (1.9%) | 14 (2.5%) |
| 5 to 9 Years | 0 (0.0%) | 0 (0.0%) |
| 10 to 14 Years | 37 (6.4%) | 0 (0.0%) |
| 15 to 19 Years | 82 (14.2%) | 15 (2.7%) |
| 20 to 24 Years | 39 (6.8%) | 85 (15.3%) |
| 25 to 29 Years | 17 (2.9%) | 11 (2.0%) |
| 30 to 34 Years | 0 (0.0%) | 8 (1.4%) |
| 35 to 39 Years | 24 (4.2%) | 0 (0.0%) |
| 40 to 44 Years | 14 (2.4%) | 73 (13.1%) |
| 45 to 49 Years | 62 (10.7%) | 22 (4.0%) |
| 50 to 54 Years | 10 (1.7%) | 112 (20.1%) |
| 55 to 59 Years | 94 (16.3%) | 113 (20.3%) |
| 60 to 64 Years | 89 (15.4%) | 24 (4.3%) |
| 65 to 69 Years | 31 (5.4%) | 18 (3.2%) |
| 70 to 74 Years | 50 (8.7%) | 31 (5.6%) |
| 75 to 79 Years | 0 (0.0%) | 18 (3.2%) |
| 80 to 84 Years | 0 (0.0%) | 12 (2.2%) |
| 85 Years and over | 17 (2.9%) | 0 (0.0%) |
| Total | 577 (100.0%) | 556 (100.0%) |
Families and Households in La Croft
Median Family Size in La Croft
The median family size in La Croft is 2.64 persons per family, with single female/mother families (88 | 28.7%) accounting for the largest median family size of 3.1 persons per family. On the other hand, single male/father families (55 | 17.9%) represent the smallest median family size with 1.78 persons per family.
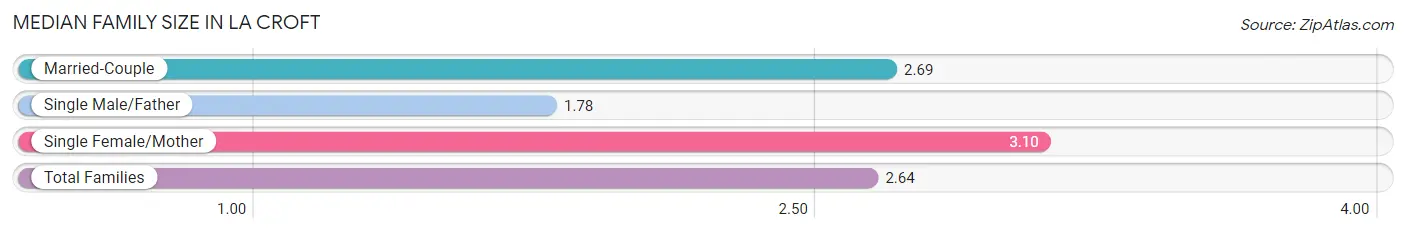
| Family Type | # Families | Family Size |
| Married-Couple | 164 (53.4%) | 2.69 |
| Single Male/Father | 55 (17.9%) | 1.78 |
| Single Female/Mother | 88 (28.7%) | 3.10 |
| Total Families | 307 (100.0%) | 2.64 |
Median Household Size in La Croft
The median household size in La Croft is 2.01 persons per household, with single female/mother households (88 | 15.6%) accounting for the largest median household size of 3.23 persons per household. non-family households (256 | 45.5%) represent the smallest median household size with 1.17 persons per household.
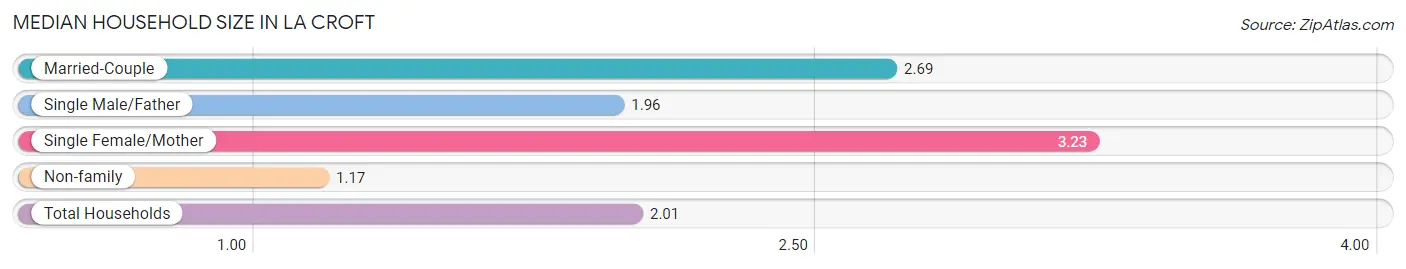
| Household Type | # Households | Household Size |
| Married-Couple | 164 (29.1%) | 2.69 |
| Single Male/Father | 55 (9.8%) | 1.96 |
| Single Female/Mother | 88 (15.6%) | 3.23 |
| Non-family | 256 (45.5%) | 1.17 |
| Total Households | 563 (100.0%) | 2.01 |
Household Size by Marriage Status in La Croft
Out of a total of 563 households in La Croft, 307 (54.5%) are family households, while 256 (45.5%) are nonfamily households. The most numerous type of family households are 2-person households, comprising 204, and the most common type of nonfamily households are 1-person households, comprising 221.
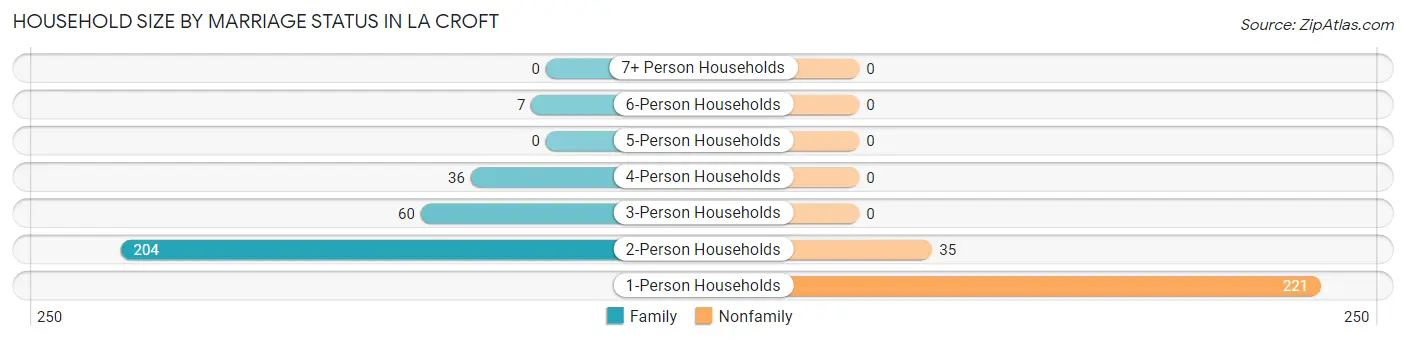
| Household Size | Family Households | Nonfamily Households |
| 1-Person Households | - | 221 (39.3%) |
| 2-Person Households | 204 (36.2%) | 35 (6.2%) |
| 3-Person Households | 60 (10.7%) | 0 (0.0%) |
| 4-Person Households | 36 (6.4%) | 0 (0.0%) |
| 5-Person Households | 0 (0.0%) | 0 (0.0%) |
| 6-Person Households | 7 (1.2%) | 0 (0.0%) |
| 7+ Person Households | 0 (0.0%) | 0 (0.0%) |
| Total | 307 (54.5%) | 256 (45.5%) |
Female Fertility in La Croft
Fertility by Age in La Croft
| Age Bracket | Women with Births | Births / 1,000 Women |
| 15 to 19 years | 0 (0.0%) | 0.0 |
| 20 to 34 years | 0 (0.0%) | 0.0 |
| 35 to 50 years | 0 (0.0%) | 0.0 |
| Total | 0 (0.0%) | 0.0 |
Fertility by Age by Marriage Status in La Croft
| Age Bracket | Married | Unmarried |
| 15 to 19 years | 0 (0.0%) | 0 (0.0%) |
| 20 to 34 years | 0 (0.0%) | 0 (0.0%) |
| 35 to 50 years | 0 (0.0%) | 0 (0.0%) |
| Total | 0 (0.0%) | 0 (0.0%) |
Fertility by Education in La Croft
| Educational Attainment | Women with Births | Births / 1,000 Women |
| Less than High School | 0 (0.0%) | 0.0 |
| High School Diploma | 0 (0.0%) | 0.0 |
| College or Associate's Degree | 0 (0.0%) | 0.0 |
| Bachelor's Degree | 0 (0.0%) | 0.0 |
| Graduate Degree | 0 (0.0%) | 0.0 |
| Total | 0 (0.0%) | 0.0 |
Fertility by Education by Marriage Status in La Croft
| Educational Attainment | Married | Unmarried |
| Less than High School | 0 (0.0%) | 0 (0.0%) |
| High School Diploma | 0 (0.0%) | 0 (0.0%) |
| College or Associate's Degree | 0 (0.0%) | 0 (0.0%) |
| Bachelor's Degree | 0 (0.0%) | 0 (0.0%) |
| Graduate Degree | 0 (0.0%) | 0 (0.0%) |
| Total | 0 (0.0%) | 0 (0.0%) |
Employment Characteristics in La Croft
Employment by Class of Employer in La Croft
Among the 522 employed individuals in La Croft, private company employees (341 | 65.3%), local government employees (56 | 10.7%), and self-employed (not incorporated) (41 | 7.9%) make up the most common classes of employment.
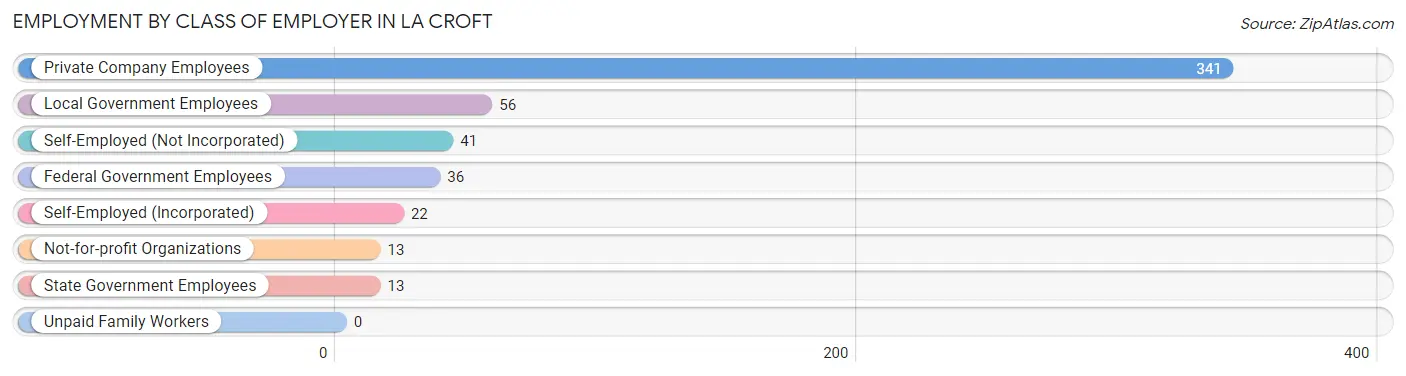
| Employer Class | # Employees | % Employees |
| Private Company Employees | 341 | 65.3% |
| Self-Employed (Incorporated) | 22 | 4.2% |
| Self-Employed (Not Incorporated) | 41 | 7.9% |
| Not-for-profit Organizations | 13 | 2.5% |
| Local Government Employees | 56 | 10.7% |
| State Government Employees | 13 | 2.5% |
| Federal Government Employees | 36 | 6.9% |
| Unpaid Family Workers | 0 | 0.0% |
| Total | 522 | 100.0% |
Employment Status by Age in La Croft
According to the labor force statistics for La Croft, out of the total population over 16 years of age (1,051), 57.9% or 609 individuals are in the labor force, with 8.7% or 53 of them unemployed. The age group with the highest labor force participation rate is 25 to 29 years, with 100.0% or 28 individuals in the labor force. Within the labor force, the 30 to 34 years age range has the highest percentage of unemployed individuals, with 100.0% or 8 of them being unemployed.
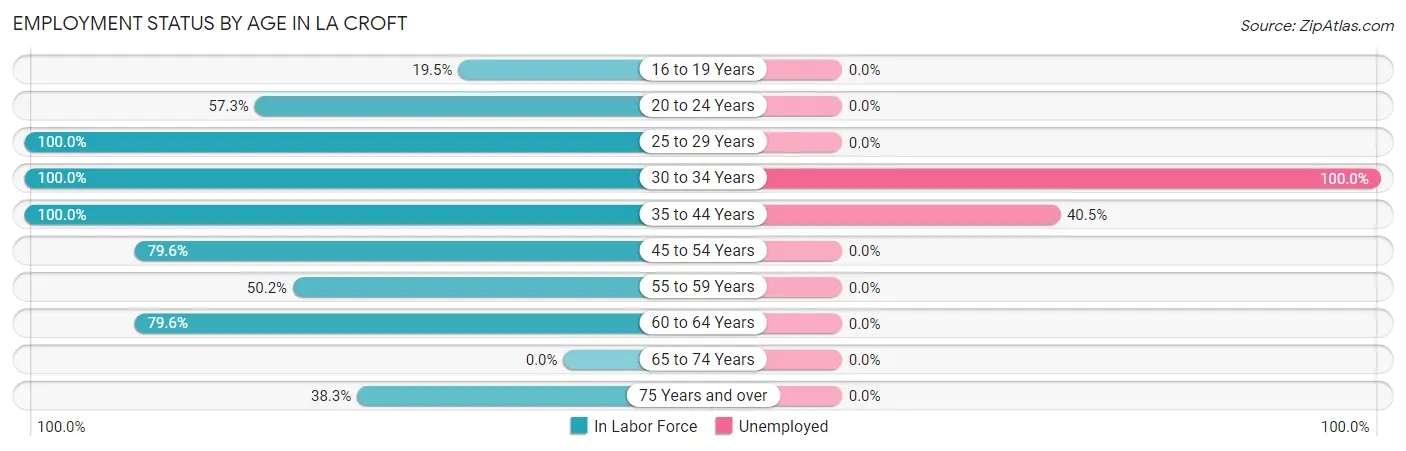
| Age Bracket | In Labor Force | Unemployed |
| 16 to 19 Years | 15 (19.5%) | 0 (0.0%) |
| 20 to 24 Years | 71 (57.3%) | 0 (0.0%) |
| 25 to 29 Years | 28 (100.0%) | 0 (0.0%) |
| 30 to 34 Years | 8 (100.0%) | 8 (100.0%) |
| 35 to 44 Years | 111 (100.0%) | 45 (40.5%) |
| 45 to 54 Years | 164 (79.6%) | 0 (0.0%) |
| 55 to 59 Years | 104 (50.2%) | 0 (0.0%) |
| 60 to 64 Years | 90 (79.6%) | 0 (0.0%) |
| 65 to 74 Years | 0 (0.0%) | 0 (0.0%) |
| 75 Years and over | 18 (38.3%) | 0 (0.0%) |
| Total | 609 (57.9%) | 53 (8.7%) |
Employment Status by Educational Attainment in La Croft
According to labor force statistics for La Croft, 75.0% of individuals (505) out of the total population between 25 and 64 years of age (673) are in the labor force, with 10.5% or 53 of them being unemployed. The group with the highest labor force participation rate are those with the educational attainment of high school diploma, with 88.7% or 260 individuals in the labor force. Within the labor force, individuals with college / associate degree education have the highest percentage of unemployment, with 27.1% or 45 of them being unemployed.
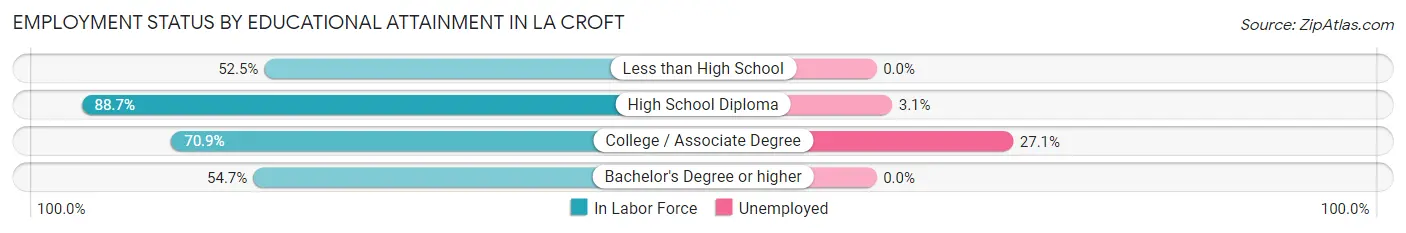
| Educational Attainment | In Labor Force | Unemployed |
| Less than High School | 21 (52.5%) | 0 (0.0%) |
| High School Diploma | 260 (88.7%) | 9 (3.1%) |
| College / Associate Degree | 166 (70.9%) | 63 (27.1%) |
| Bachelor's Degree or higher | 58 (54.7%) | 0 (0.0%) |
| Total | 505 (75.0%) | 71 (10.5%) |
Employment Occupations by Sex in La Croft
Management, Business, Science and Arts Occupations
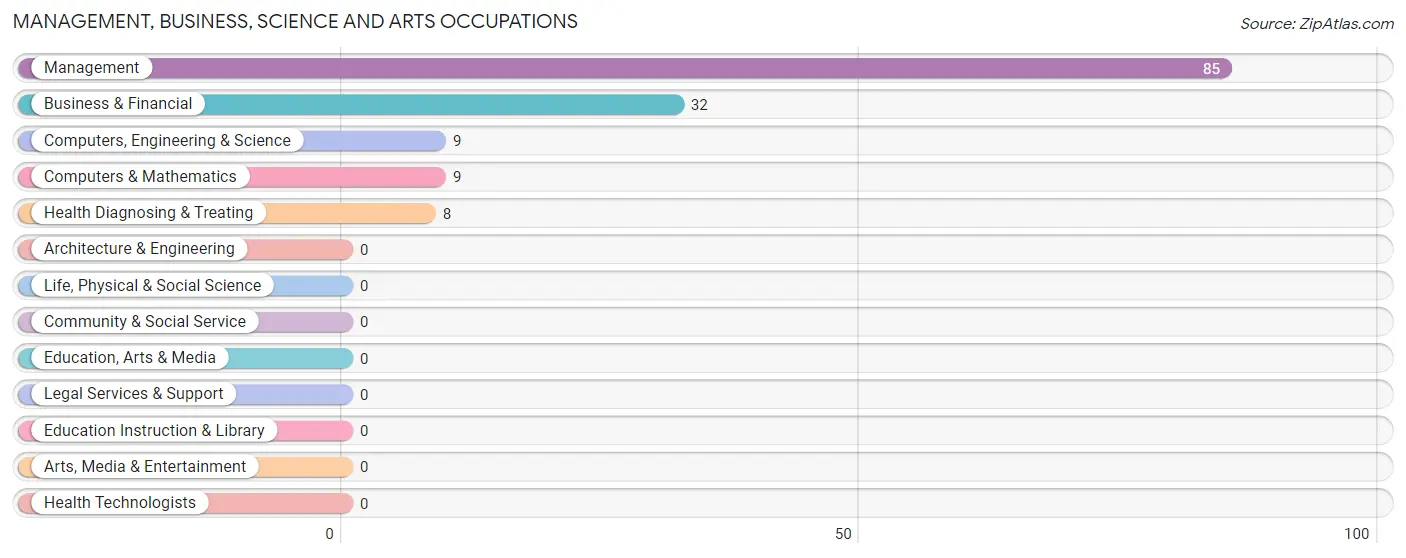
The most common Management, Business, Science and Arts occupations in La Croft are Management (85 | 15.3%), Business & Financial (32 | 5.8%), Computers, Engineering & Science (9 | 1.6%), Computers & Mathematics (9 | 1.6%), and Health Diagnosing & Treating (8 | 1.4%).
Management, Business, Science and Arts Occupations by Sex
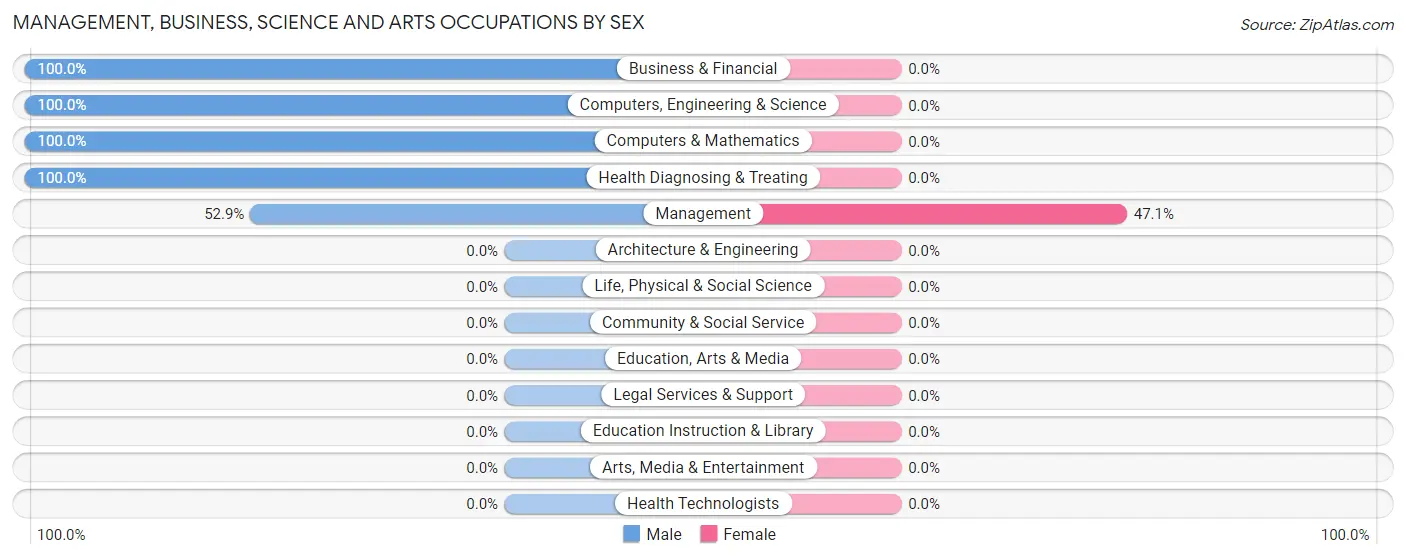
| Occupation | Male | Female |
| Management | 45 (52.9%) | 40 (47.1%) |
| Business & Financial | 32 (100.0%) | 0 (0.0%) |
| Computers, Engineering & Science | 9 (100.0%) | 0 (0.0%) |
| Computers & Mathematics | 9 (100.0%) | 0 (0.0%) |
| Architecture & Engineering | 0 (0.0%) | 0 (0.0%) |
| Life, Physical & Social Science | 0 (0.0%) | 0 (0.0%) |
| Community & Social Service | 0 (0.0%) | 0 (0.0%) |
| Education, Arts & Media | 0 (0.0%) | 0 (0.0%) |
| Legal Services & Support | 0 (0.0%) | 0 (0.0%) |
| Education Instruction & Library | 0 (0.0%) | 0 (0.0%) |
| Arts, Media & Entertainment | 0 (0.0%) | 0 (0.0%) |
| Health Diagnosing & Treating | 8 (100.0%) | 0 (0.0%) |
| Health Technologists | 0 (0.0%) | 0 (0.0%) |
| Total (Category) | 94 (70.2%) | 40 (29.8%) |
| Total (Overall) | 283 (50.9%) | 273 (49.1%) |
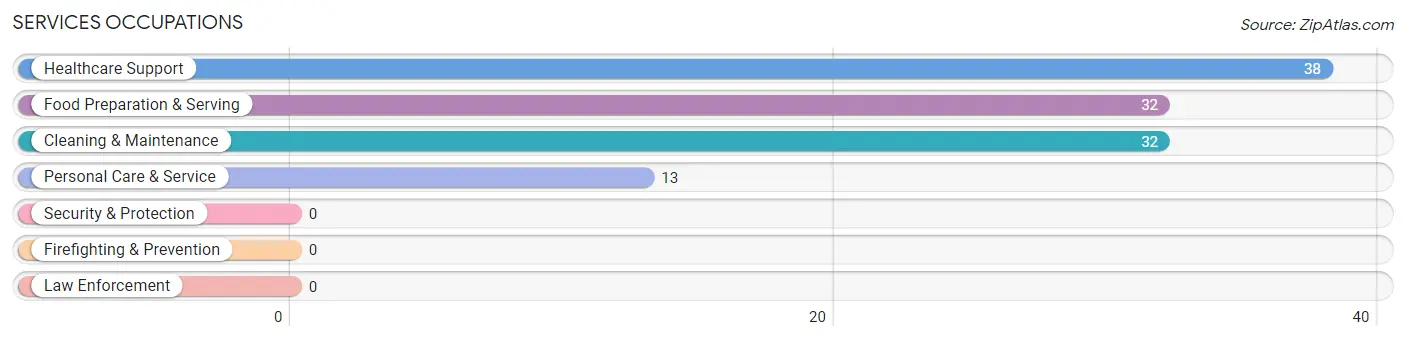
Services Occupations
The most common Services occupations in La Croft are Healthcare Support (38 | 6.8%), Food Preparation & Serving (32 | 5.8%), Cleaning & Maintenance (32 | 5.8%), and Personal Care & Service (13 | 2.3%).
Services Occupations by Sex
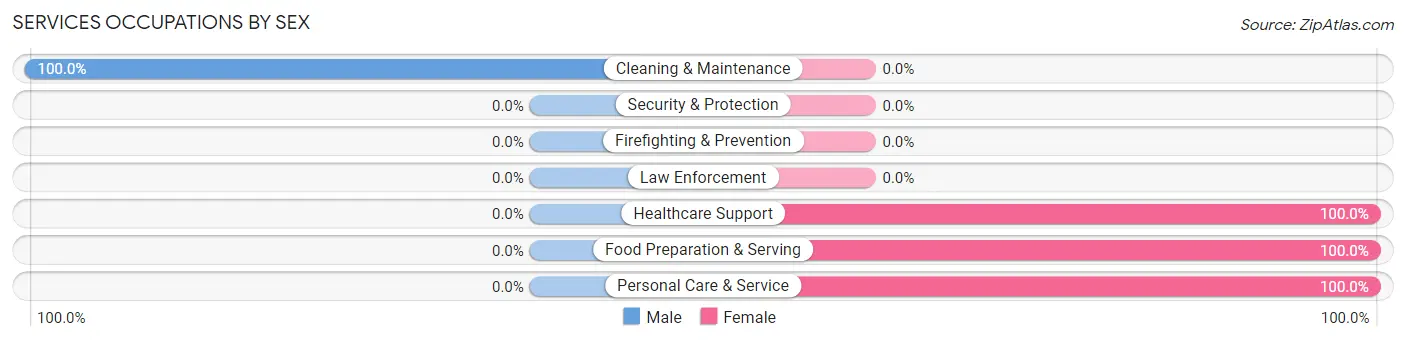
| Occupation | Male | Female |
| Healthcare Support | 0 (0.0%) | 38 (100.0%) |
| Security & Protection | 0 (0.0%) | 0 (0.0%) |
| Firefighting & Prevention | 0 (0.0%) | 0 (0.0%) |
| Law Enforcement | 0 (0.0%) | 0 (0.0%) |
| Food Preparation & Serving | 0 (0.0%) | 32 (100.0%) |
| Cleaning & Maintenance | 32 (100.0%) | 0 (0.0%) |
| Personal Care & Service | 0 (0.0%) | 13 (100.0%) |
| Total (Category) | 32 (27.8%) | 83 (72.2%) |
| Total (Overall) | 283 (50.9%) | 273 (49.1%) |
Sales and Office Occupations
The most common Sales and Office occupations in La Croft are Office & Administration (107 | 19.2%), and Sales & Related (39 | 7.0%).

Sales and Office Occupations by Sex

| Occupation | Male | Female |
| Sales & Related | 0 (0.0%) | 39 (100.0%) |
| Office & Administration | 7 (6.5%) | 100 (93.5%) |
| Total (Category) | 7 (4.8%) | 139 (95.2%) |
| Total (Overall) | 283 (50.9%) | 273 (49.1%) |
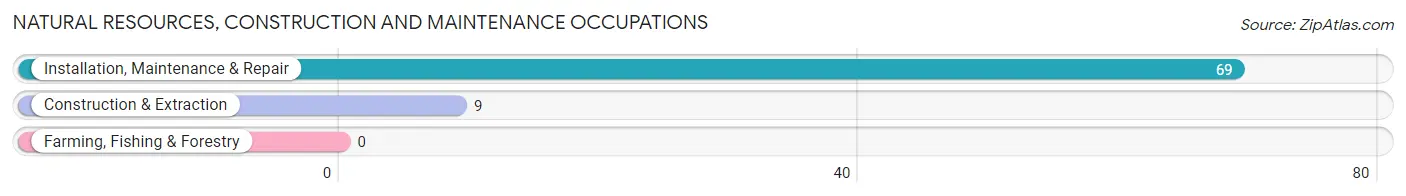
Natural Resources, Construction and Maintenance Occupations
The most common Natural Resources, Construction and Maintenance occupations in La Croft are Installation, Maintenance & Repair (69 | 12.4%), and Construction & Extraction (9 | 1.6%).
Natural Resources, Construction and Maintenance Occupations by Sex

| Occupation | Male | Female |
| Farming, Fishing & Forestry | 0 (0.0%) | 0 (0.0%) |
| Construction & Extraction | 9 (100.0%) | 0 (0.0%) |
| Installation, Maintenance & Repair | 69 (100.0%) | 0 (0.0%) |
| Total (Category) | 78 (100.0%) | 0 (0.0%) |
| Total (Overall) | 283 (50.9%) | 273 (49.1%) |
Production, Transportation and Moving Occupations
The most common Production, Transportation and Moving occupations in La Croft are Production (59 | 10.6%), Transportation (16 | 2.9%), and Material Moving (8 | 1.4%).
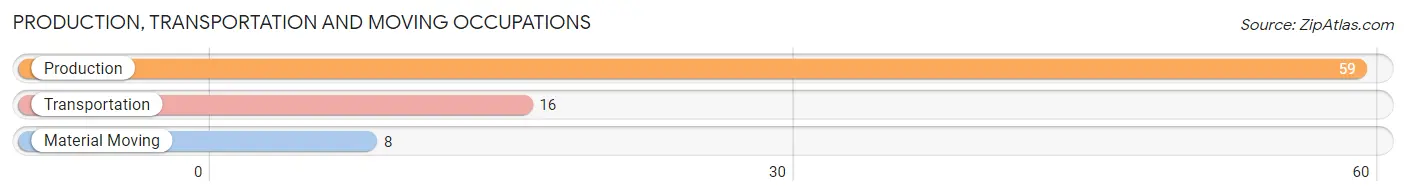
Production, Transportation and Moving Occupations by Sex
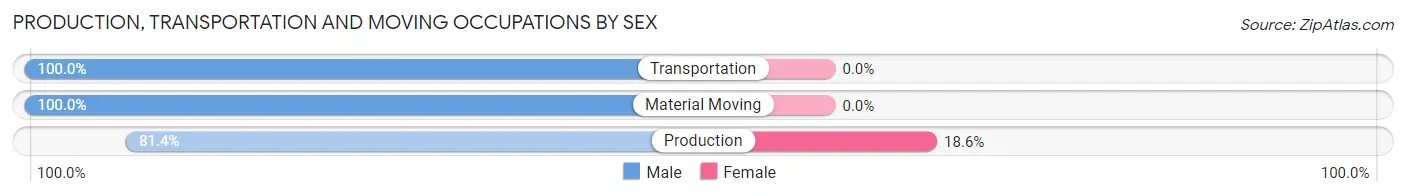
| Occupation | Male | Female |
| Production | 48 (81.4%) | 11 (18.6%) |
| Transportation | 16 (100.0%) | 0 (0.0%) |
| Material Moving | 8 (100.0%) | 0 (0.0%) |
| Total (Category) | 72 (86.8%) | 11 (13.3%) |
| Total (Overall) | 283 (50.9%) | 273 (49.1%) |
Employment Industries by Sex in La Croft
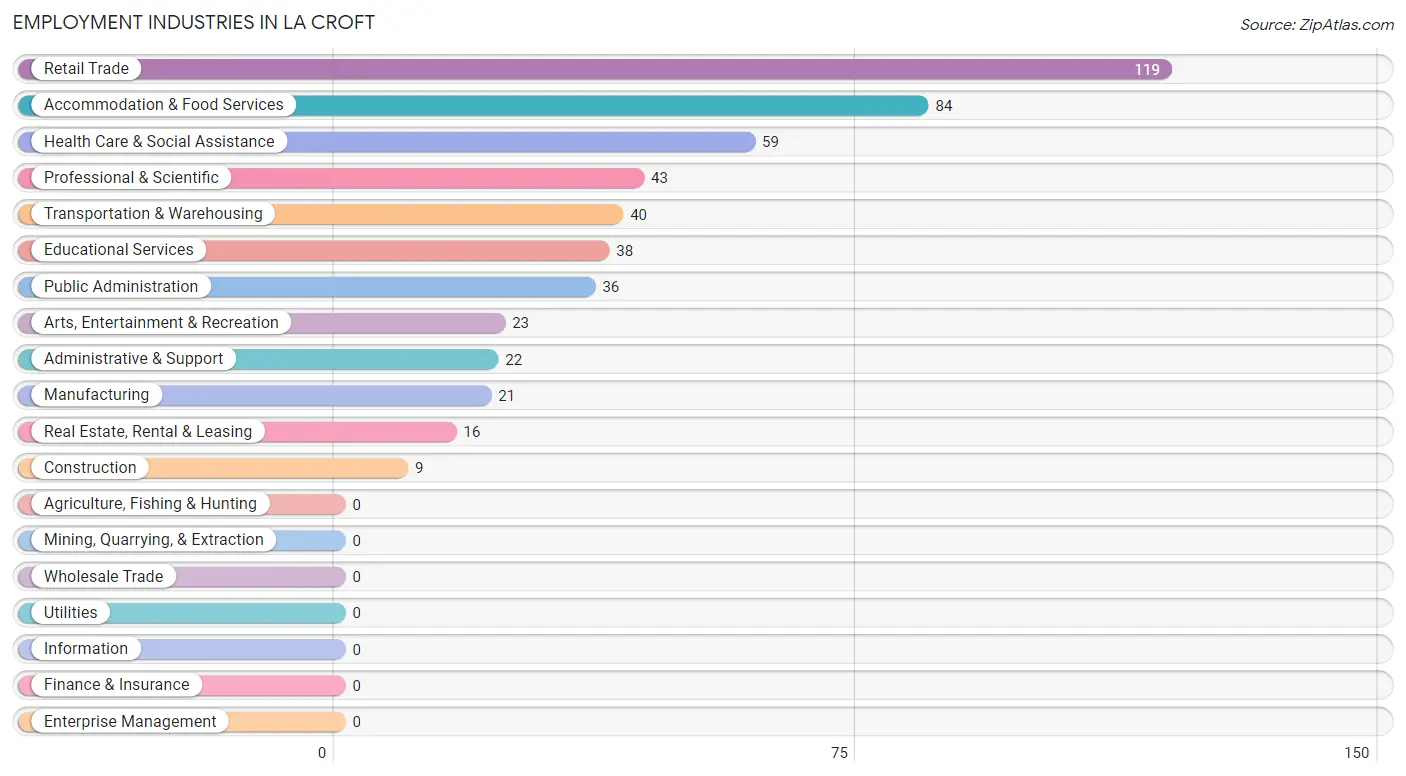
Employment Industries in La Croft
The major employment industries in La Croft include Retail Trade (119 | 21.4%), Accommodation & Food Services (84 | 15.1%), Health Care & Social Assistance (59 | 10.6%), Professional & Scientific (43 | 7.7%), and Transportation & Warehousing (40 | 7.2%).
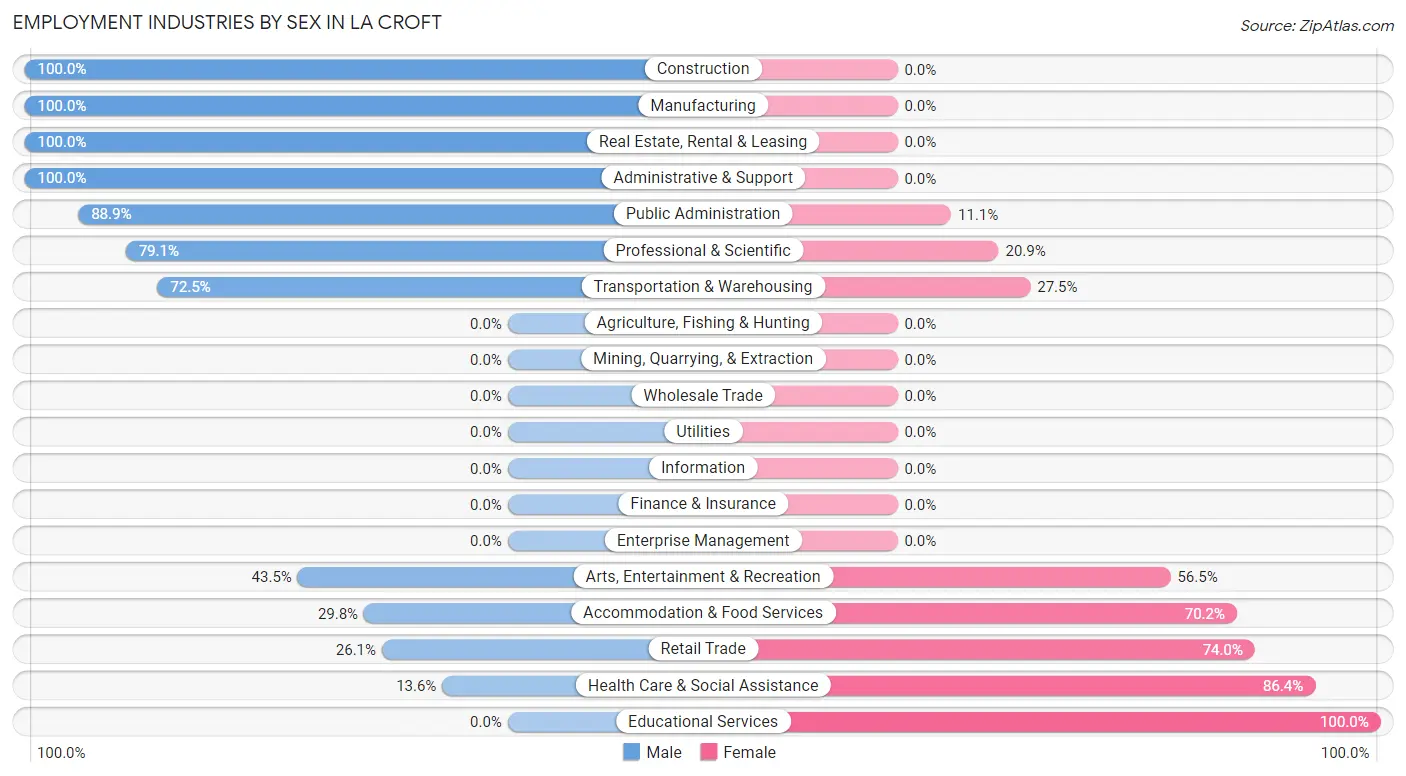
Employment Industries by Sex in La Croft
The La Croft industries that see more men than women are Construction (100.0%), Manufacturing (100.0%), and Real Estate, Rental & Leasing (100.0%), whereas the industries that tend to have a higher number of women are Educational Services (100.0%), Health Care & Social Assistance (86.4%), and Retail Trade (74.0%).
| Industry | Male | Female |
| Agriculture, Fishing & Hunting | 0 (0.0%) | 0 (0.0%) |
| Mining, Quarrying, & Extraction | 0 (0.0%) | 0 (0.0%) |
| Construction | 9 (100.0%) | 0 (0.0%) |
| Manufacturing | 21 (100.0%) | 0 (0.0%) |
| Wholesale Trade | 0 (0.0%) | 0 (0.0%) |
| Retail Trade | 31 (26.1%) | 88 (74.0%) |
| Transportation & Warehousing | 29 (72.5%) | 11 (27.5%) |
| Utilities | 0 (0.0%) | 0 (0.0%) |
| Information | 0 (0.0%) | 0 (0.0%) |
| Finance & Insurance | 0 (0.0%) | 0 (0.0%) |
| Real Estate, Rental & Leasing | 16 (100.0%) | 0 (0.0%) |
| Professional & Scientific | 34 (79.1%) | 9 (20.9%) |
| Enterprise Management | 0 (0.0%) | 0 (0.0%) |
| Administrative & Support | 22 (100.0%) | 0 (0.0%) |
| Educational Services | 0 (0.0%) | 38 (100.0%) |
| Health Care & Social Assistance | 8 (13.6%) | 51 (86.4%) |
| Arts, Entertainment & Recreation | 10 (43.5%) | 13 (56.5%) |
| Accommodation & Food Services | 25 (29.8%) | 59 (70.2%) |
| Public Administration | 32 (88.9%) | 4 (11.1%) |
| Total | 283 (50.9%) | 273 (49.1%) |
Education in La Croft
School Enrollment in La Croft
The most common levels of schooling among the 159 students in La Croft are college / undergraduate (76 | 47.8%), high school (46 | 28.9%), and middle school (37 | 23.3%).
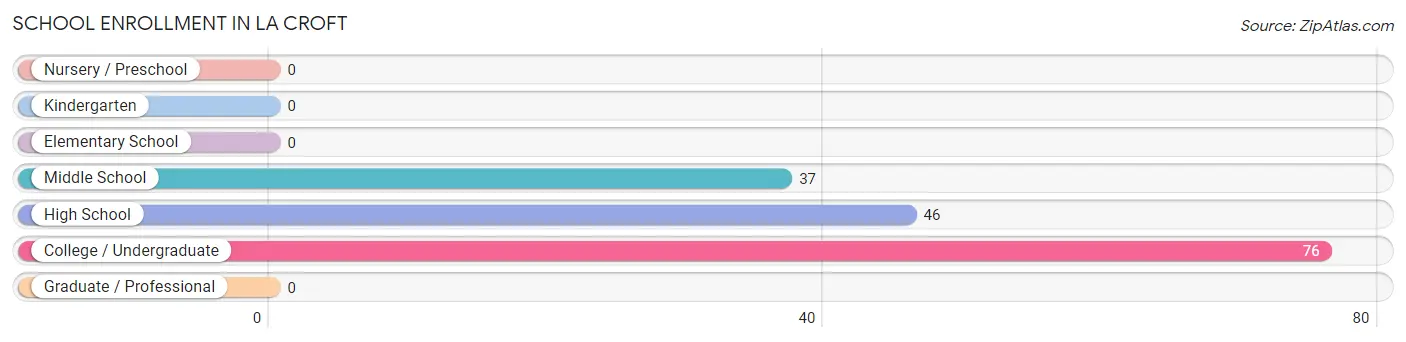
| School Level | # Students | % Students |
| Nursery / Preschool | 0 | 0.0% |
| Kindergarten | 0 | 0.0% |
| Elementary School | 0 | 0.0% |
| Middle School | 37 | 23.3% |
| High School | 46 | 28.9% |
| College / Undergraduate | 76 | 47.8% |
| Graduate / Professional | 0 | 0.0% |
| Total | 159 | 100.0% |
School Enrollment by Age by Funding Source in La Croft
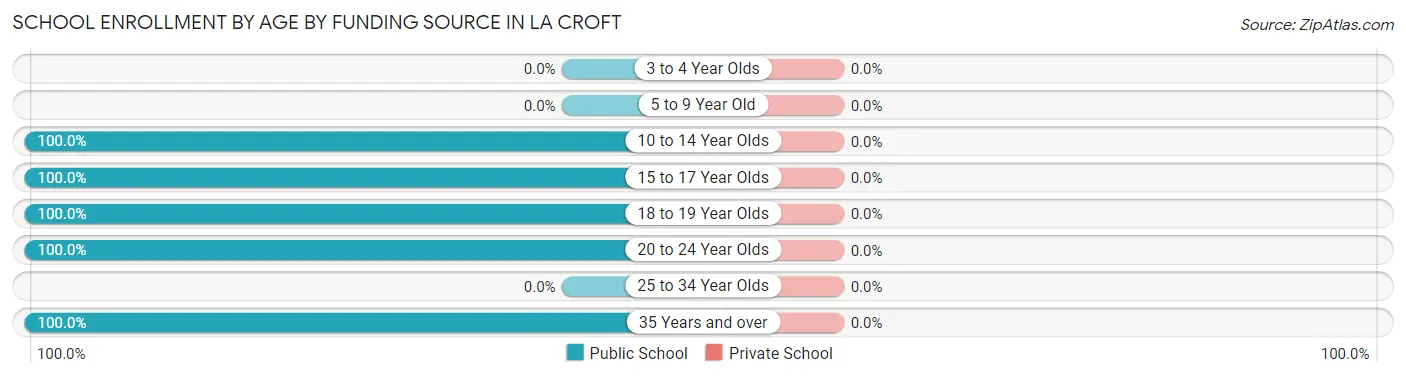
| Age Bracket | Public School | Private School |
| 3 to 4 Year Olds | 0 (0.0%) | 0 (0.0%) |
| 5 to 9 Year Old | 0 (0.0%) | 0 (0.0%) |
| 10 to 14 Year Olds | 37 (100.0%) | 0 (0.0%) |
| 15 to 17 Year Olds | 34 (100.0%) | 0 (0.0%) |
| 18 to 19 Year Olds | 12 (100.0%) | 0 (0.0%) |
| 20 to 24 Year Olds | 53 (100.0%) | 0 (0.0%) |
| 25 to 34 Year Olds | 0 (0.0%) | 0 (0.0%) |
| 35 Years and over | 23 (100.0%) | 0 (0.0%) |
| Total | 159 (100.0%) | 0 (0.0%) |
Educational Attainment by Field of Study in La Croft
Business (65 | 61.3%), education (15 | 14.1%), visual & performing arts (13 | 12.3%), and arts & humanities (13 | 12.3%) are the most common fields of study among 106 individuals in La Croft who have obtained a bachelor's degree or higher.
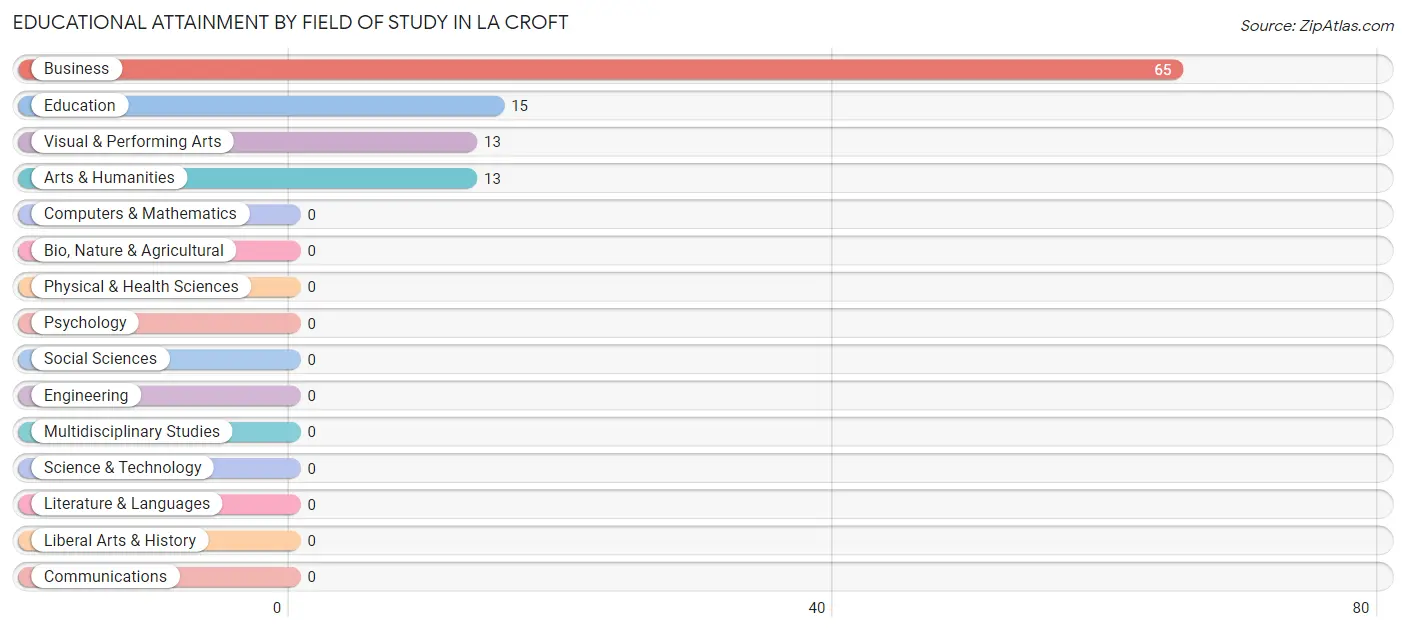
| Field of Study | # Graduates | % Graduates |
| Computers & Mathematics | 0 | 0.0% |
| Bio, Nature & Agricultural | 0 | 0.0% |
| Physical & Health Sciences | 0 | 0.0% |
| Psychology | 0 | 0.0% |
| Social Sciences | 0 | 0.0% |
| Engineering | 0 | 0.0% |
| Multidisciplinary Studies | 0 | 0.0% |
| Science & Technology | 0 | 0.0% |
| Business | 65 | 61.3% |
| Education | 15 | 14.1% |
| Literature & Languages | 0 | 0.0% |
| Liberal Arts & History | 0 | 0.0% |
| Visual & Performing Arts | 13 | 12.3% |
| Communications | 0 | 0.0% |
| Arts & Humanities | 13 | 12.3% |
| Total | 106 | 100.0% |
Transportation & Commute in La Croft
Vehicle Availability by Sex in La Croft
The most prevalent vehicle ownership categories in La Croft are males with 3 vehicles (123, accounting for 49.4%) and females with 3 vehicles (24, making up 45.1%).
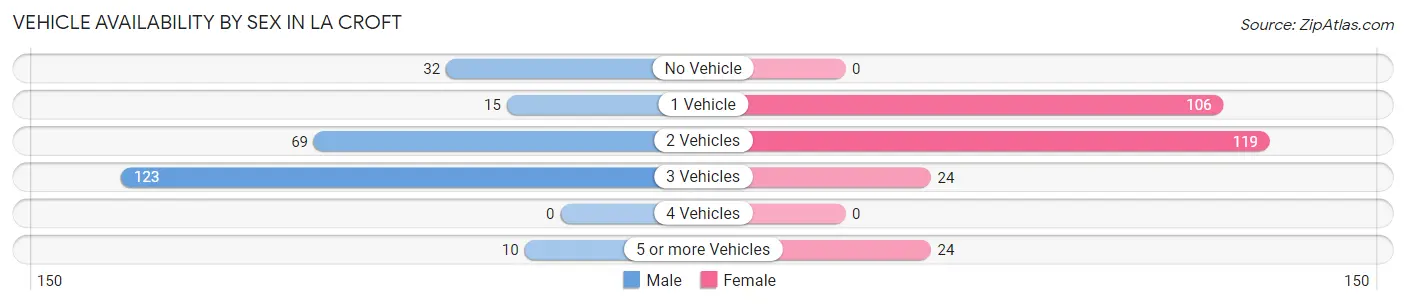
| Vehicles Available | Male | Female |
| No Vehicle | 32 (12.9%) | 0 (0.0%) |
| 1 Vehicle | 15 (6.0%) | 106 (38.8%) |
| 2 Vehicles | 69 (27.7%) | 119 (43.6%) |
| 3 Vehicles | 123 (49.4%) | 24 (8.8%) |
| 4 Vehicles | 0 (0.0%) | 0 (0.0%) |
| 5 or more Vehicles | 10 (4.0%) | 24 (8.8%) |
| Total | 249 (100.0%) | 273 (100.0%) |
Commute Time in La Croft
The most frequently occuring commute durations in La Croft are 15 to 19 minutes (134 commuters, 26.5%), 10 to 14 minutes (105 commuters, 20.7%), and 20 to 24 minutes (98 commuters, 19.4%).
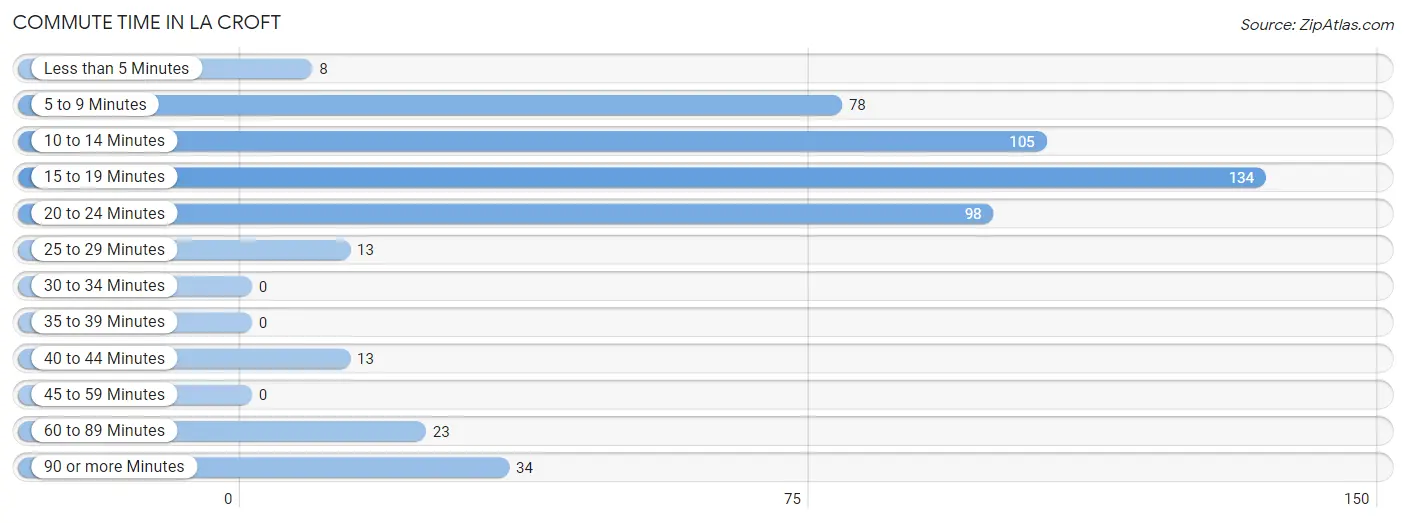
| Commute Time | # Commuters | % Commuters |
| Less than 5 Minutes | 8 | 1.6% |
| 5 to 9 Minutes | 78 | 15.4% |
| 10 to 14 Minutes | 105 | 20.7% |
| 15 to 19 Minutes | 134 | 26.5% |
| 20 to 24 Minutes | 98 | 19.4% |
| 25 to 29 Minutes | 13 | 2.6% |
| 30 to 34 Minutes | 0 | 0.0% |
| 35 to 39 Minutes | 0 | 0.0% |
| 40 to 44 Minutes | 13 | 2.6% |
| 45 to 59 Minutes | 0 | 0.0% |
| 60 to 89 Minutes | 23 | 4.5% |
| 90 or more Minutes | 34 | 6.7% |
Commute Time by Sex in La Croft
The most common commute times in La Croft are 15 to 19 minutes (69 commuters, 29.6%) for males and 10 to 14 minutes (79 commuters, 28.9%) for females.
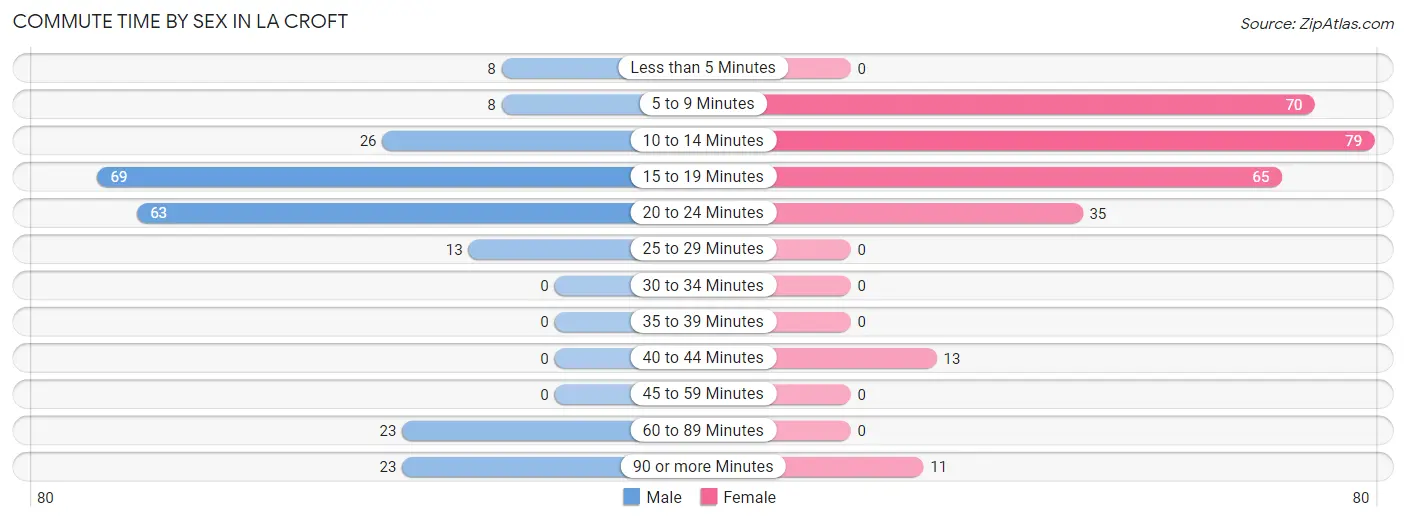
| Commute Time | Male | Female |
| Less than 5 Minutes | 8 (3.4%) | 0 (0.0%) |
| 5 to 9 Minutes | 8 (3.4%) | 70 (25.6%) |
| 10 to 14 Minutes | 26 (11.2%) | 79 (28.9%) |
| 15 to 19 Minutes | 69 (29.6%) | 65 (23.8%) |
| 20 to 24 Minutes | 63 (27.0%) | 35 (12.8%) |
| 25 to 29 Minutes | 13 (5.6%) | 0 (0.0%) |
| 30 to 34 Minutes | 0 (0.0%) | 0 (0.0%) |
| 35 to 39 Minutes | 0 (0.0%) | 0 (0.0%) |
| 40 to 44 Minutes | 0 (0.0%) | 13 (4.8%) |
| 45 to 59 Minutes | 0 (0.0%) | 0 (0.0%) |
| 60 to 89 Minutes | 23 (9.9%) | 0 (0.0%) |
| 90 or more Minutes | 23 (9.9%) | 11 (4.0%) |
Time of Departure to Work by Sex in La Croft
The most frequent times of departure to work in La Croft are 7:30 AM to 7:59 AM (69, 29.6%) for males and 7:30 AM to 7:59 AM (82, 30.0%) for females.
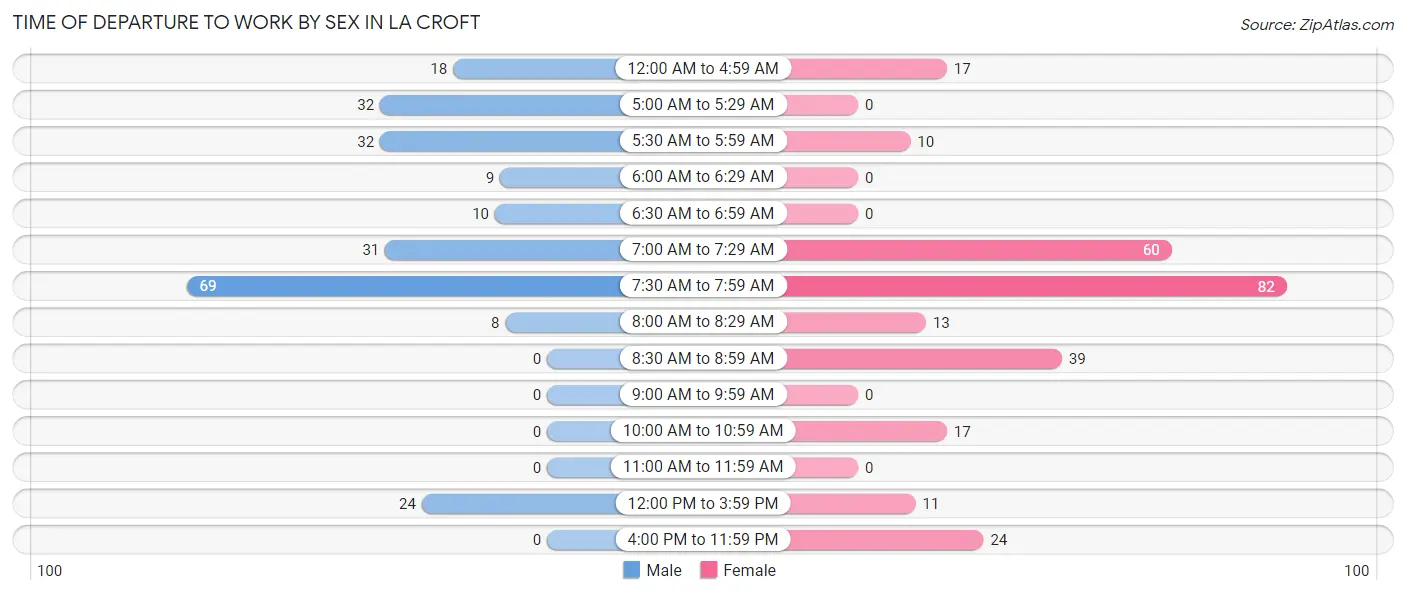
| Time of Departure | Male | Female |
| 12:00 AM to 4:59 AM | 18 (7.7%) | 17 (6.2%) |
| 5:00 AM to 5:29 AM | 32 (13.7%) | 0 (0.0%) |
| 5:30 AM to 5:59 AM | 32 (13.7%) | 10 (3.7%) |
| 6:00 AM to 6:29 AM | 9 (3.9%) | 0 (0.0%) |
| 6:30 AM to 6:59 AM | 10 (4.3%) | 0 (0.0%) |
| 7:00 AM to 7:29 AM | 31 (13.3%) | 60 (22.0%) |
| 7:30 AM to 7:59 AM | 69 (29.6%) | 82 (30.0%) |
| 8:00 AM to 8:29 AM | 8 (3.4%) | 13 (4.8%) |
| 8:30 AM to 8:59 AM | 0 (0.0%) | 39 (14.3%) |
| 9:00 AM to 9:59 AM | 0 (0.0%) | 0 (0.0%) |
| 10:00 AM to 10:59 AM | 0 (0.0%) | 17 (6.2%) |
| 11:00 AM to 11:59 AM | 0 (0.0%) | 0 (0.0%) |
| 12:00 PM to 3:59 PM | 24 (10.3%) | 11 (4.0%) |
| 4:00 PM to 11:59 PM | 0 (0.0%) | 24 (8.8%) |
| Total | 233 (100.0%) | 273 (100.0%) |
Housing Occupancy in La Croft
Occupancy by Ownership in La Croft
Of the total 563 dwellings in La Croft, owner-occupied units account for 483 (85.8%), while renter-occupied units make up 80 (14.2%).
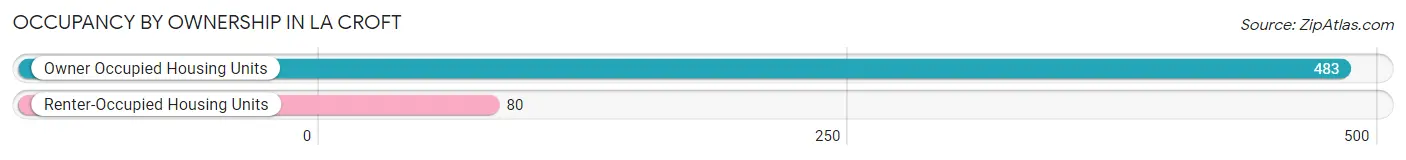
| Occupancy | # Housing Units | % Housing Units |
| Owner Occupied Housing Units | 483 | 85.8% |
| Renter-Occupied Housing Units | 80 | 14.2% |
| Total Occupied Housing Units | 563 | 100.0% |
Occupancy by Household Size in La Croft
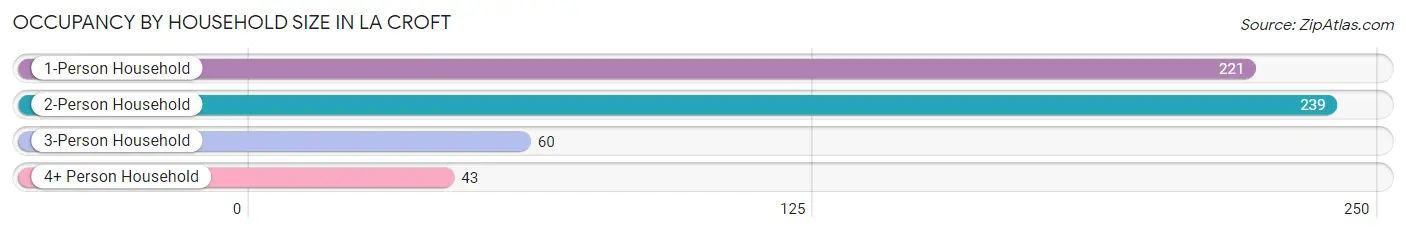
| Household Size | # Housing Units | % Housing Units |
| 1-Person Household | 221 | 39.3% |
| 2-Person Household | 239 | 42.4% |
| 3-Person Household | 60 | 10.7% |
| 4+ Person Household | 43 | 7.6% |
| Total Housing Units | 563 | 100.0% |
Occupancy by Ownership by Household Size in La Croft
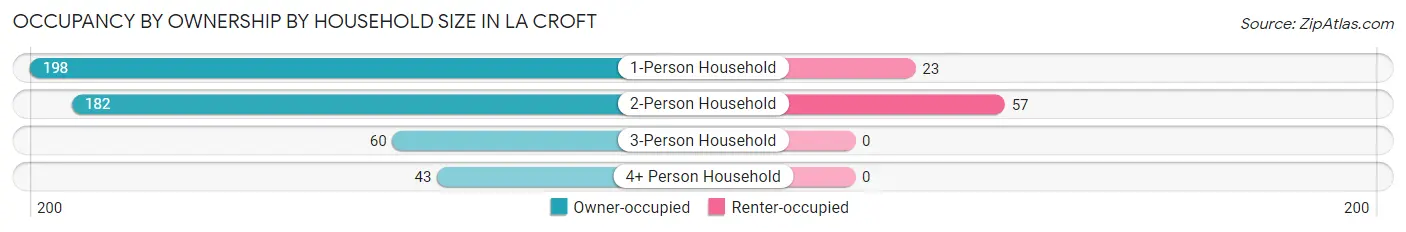
| Household Size | Owner-occupied | Renter-occupied |
| 1-Person Household | 198 (89.6%) | 23 (10.4%) |
| 2-Person Household | 182 (76.1%) | 57 (23.8%) |
| 3-Person Household | 60 (100.0%) | 0 (0.0%) |
| 4+ Person Household | 43 (100.0%) | 0 (0.0%) |
| Total Housing Units | 483 (85.8%) | 80 (14.2%) |
Occupancy by Educational Attainment in La Croft
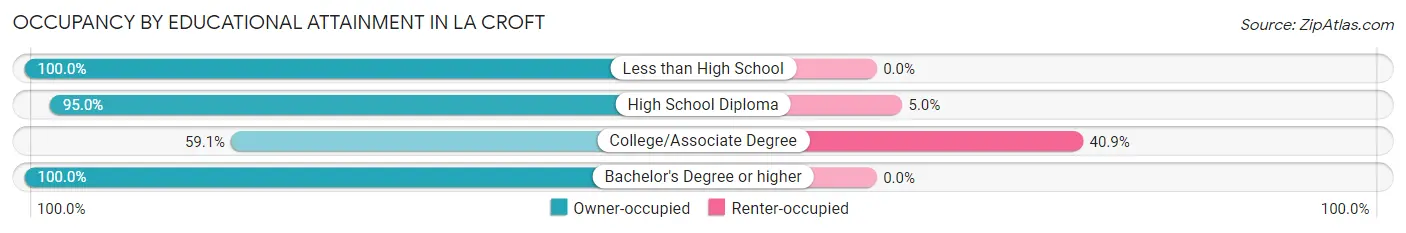
| Household Size | Owner-occupied | Renter-occupied |
| Less than High School | 10 (100.0%) | 0 (0.0%) |
| High School Diploma | 321 (95.0%) | 17 (5.0%) |
| College/Associate Degree | 91 (59.1%) | 63 (40.9%) |
| Bachelor's Degree or higher | 61 (100.0%) | 0 (0.0%) |
Occupancy by Age of Householder in La Croft
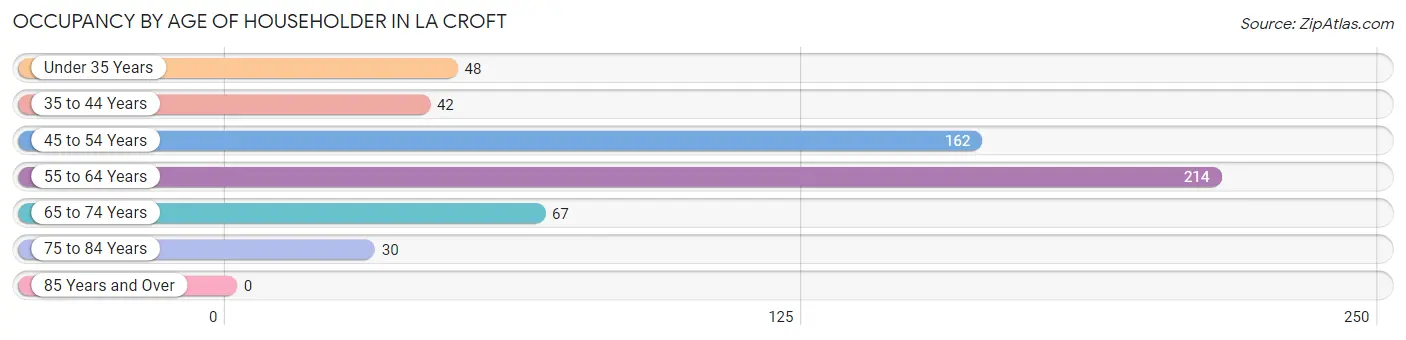
| Age Bracket | # Households | % Households |
| Under 35 Years | 48 | 8.5% |
| 35 to 44 Years | 42 | 7.5% |
| 45 to 54 Years | 162 | 28.8% |
| 55 to 64 Years | 214 | 38.0% |
| 65 to 74 Years | 67 | 11.9% |
| 75 to 84 Years | 30 | 5.3% |
| 85 Years and Over | 0 | 0.0% |
| Total | 563 | 100.0% |
Housing Finances in La Croft
Median Income by Occupancy in La Croft
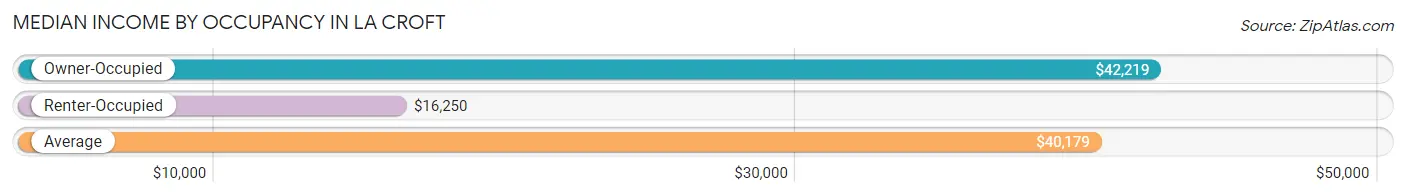
| Occupancy Type | # Households | Median Income |
| Owner-Occupied | 483 (85.8%) | $42,219 |
| Renter-Occupied | 80 (14.2%) | $16,250 |
| Average | 563 (100.0%) | $40,179 |
Occupancy by Householder Income Bracket in La Croft
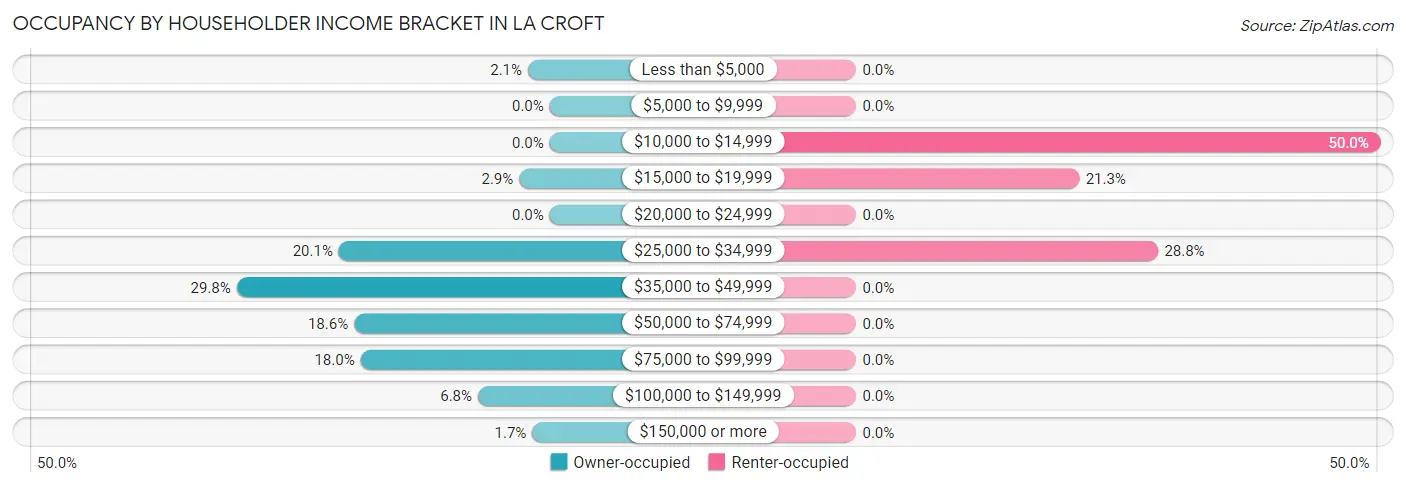
| Income Bracket | Owner-occupied | Renter-occupied |
| Less than $5,000 | 10 (2.1%) | 0 (0.0%) |
| $5,000 to $9,999 | 0 (0.0%) | 0 (0.0%) |
| $10,000 to $14,999 | 0 (0.0%) | 40 (50.0%) |
| $15,000 to $19,999 | 14 (2.9%) | 17 (21.2%) |
| $20,000 to $24,999 | 0 (0.0%) | 0 (0.0%) |
| $25,000 to $34,999 | 97 (20.1%) | 23 (28.7%) |
| $35,000 to $49,999 | 144 (29.8%) | 0 (0.0%) |
| $50,000 to $74,999 | 90 (18.6%) | 0 (0.0%) |
| $75,000 to $99,999 | 87 (18.0%) | 0 (0.0%) |
| $100,000 to $149,999 | 33 (6.8%) | 0 (0.0%) |
| $150,000 or more | 8 (1.7%) | 0 (0.0%) |
| Total | 483 (100.0%) | 80 (100.0%) |
Monthly Housing Cost Tiers in La Croft
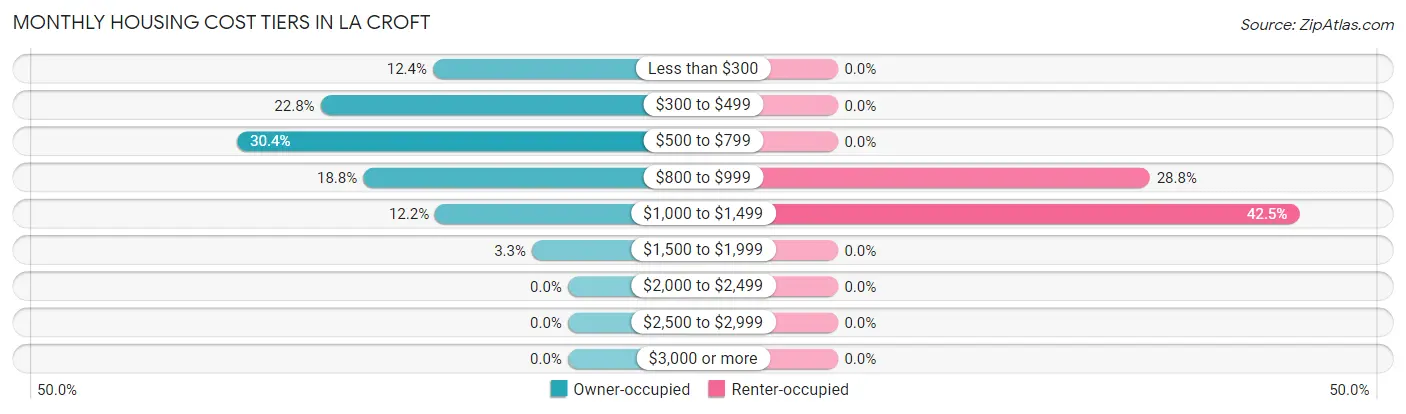
| Monthly Cost | Owner-occupied | Renter-occupied |
| Less than $300 | 60 (12.4%) | 0 (0.0%) |
| $300 to $499 | 110 (22.8%) | 0 (0.0%) |
| $500 to $799 | 147 (30.4%) | 0 (0.0%) |
| $800 to $999 | 91 (18.8%) | 23 (28.7%) |
| $1,000 to $1,499 | 59 (12.2%) | 34 (42.5%) |
| $1,500 to $1,999 | 16 (3.3%) | 0 (0.0%) |
| $2,000 to $2,499 | 0 (0.0%) | 0 (0.0%) |
| $2,500 to $2,999 | 0 (0.0%) | 0 (0.0%) |
| $3,000 or more | 0 (0.0%) | 0 (0.0%) |
| Total | 483 (100.0%) | 80 (100.0%) |
Physical Housing Characteristics in La Croft
Housing Structures in La Croft
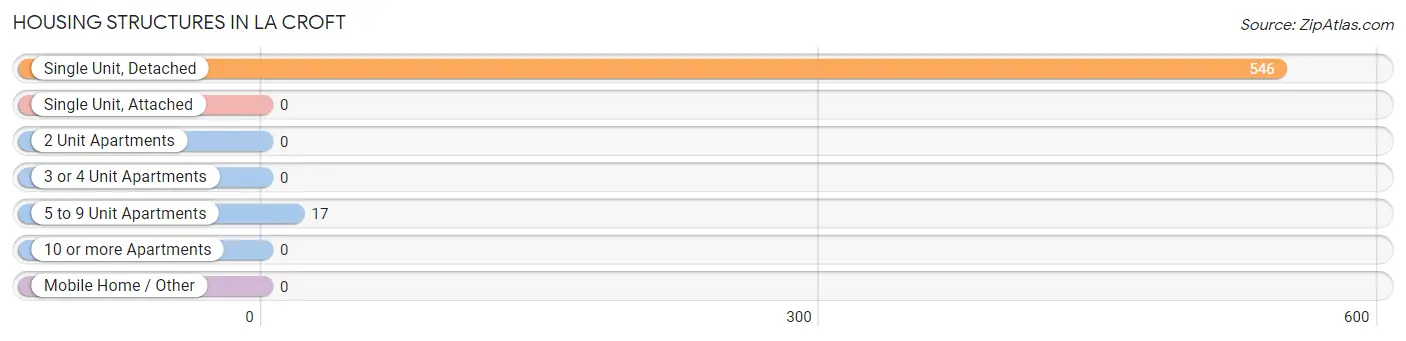
| Structure Type | # Housing Units | % Housing Units |
| Single Unit, Detached | 546 | 97.0% |
| Single Unit, Attached | 0 | 0.0% |
| 2 Unit Apartments | 0 | 0.0% |
| 3 or 4 Unit Apartments | 0 | 0.0% |
| 5 to 9 Unit Apartments | 17 | 3.0% |
| 10 or more Apartments | 0 | 0.0% |
| Mobile Home / Other | 0 | 0.0% |
| Total | 563 | 100.0% |
Housing Structures by Occupancy in La Croft
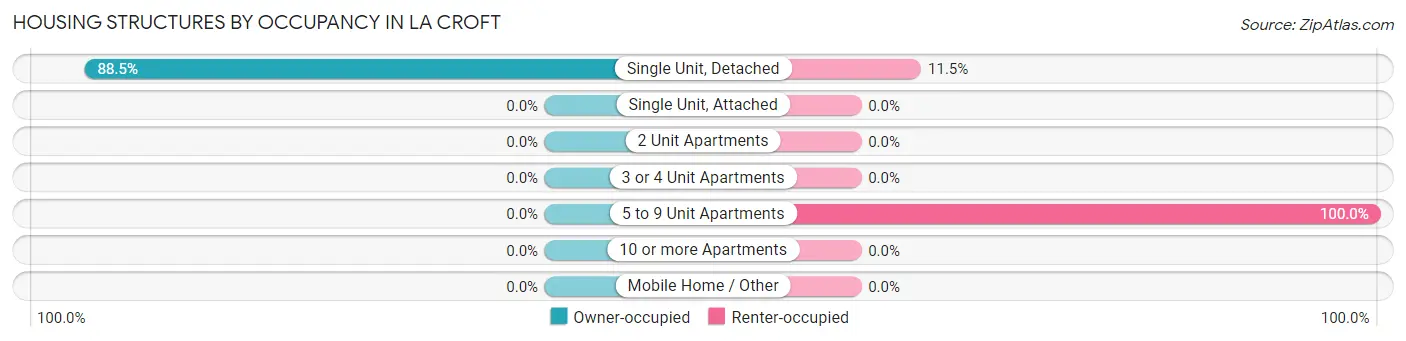
| Structure Type | Owner-occupied | Renter-occupied |
| Single Unit, Detached | 483 (88.5%) | 63 (11.5%) |
| Single Unit, Attached | 0 (0.0%) | 0 (0.0%) |
| 2 Unit Apartments | 0 (0.0%) | 0 (0.0%) |
| 3 or 4 Unit Apartments | 0 (0.0%) | 0 (0.0%) |
| 5 to 9 Unit Apartments | 0 (0.0%) | 17 (100.0%) |
| 10 or more Apartments | 0 (0.0%) | 0 (0.0%) |
| Mobile Home / Other | 0 (0.0%) | 0 (0.0%) |
| Total | 483 (85.8%) | 80 (14.2%) |
Housing Structures by Number of Rooms in La Croft
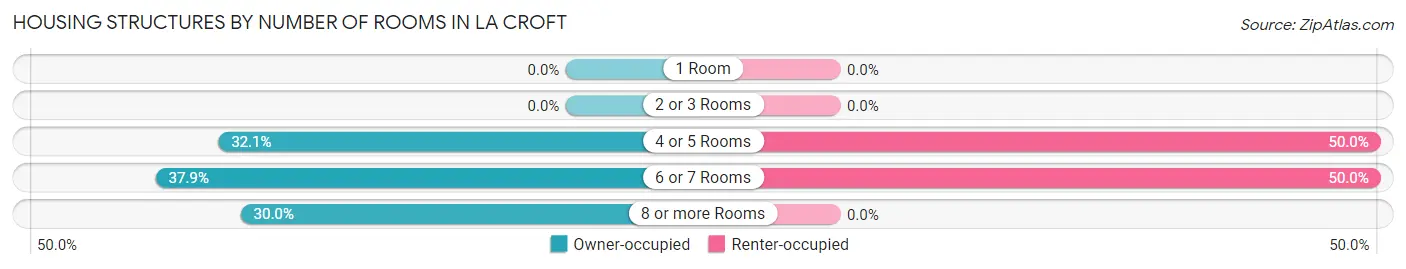
| Number of Rooms | Owner-occupied | Renter-occupied |
| 1 Room | 0 (0.0%) | 0 (0.0%) |
| 2 or 3 Rooms | 0 (0.0%) | 0 (0.0%) |
| 4 or 5 Rooms | 155 (32.1%) | 40 (50.0%) |
| 6 or 7 Rooms | 183 (37.9%) | 40 (50.0%) |
| 8 or more Rooms | 145 (30.0%) | 0 (0.0%) |
| Total | 483 (100.0%) | 80 (100.0%) |
Housing Structure by Heating Type in La Croft
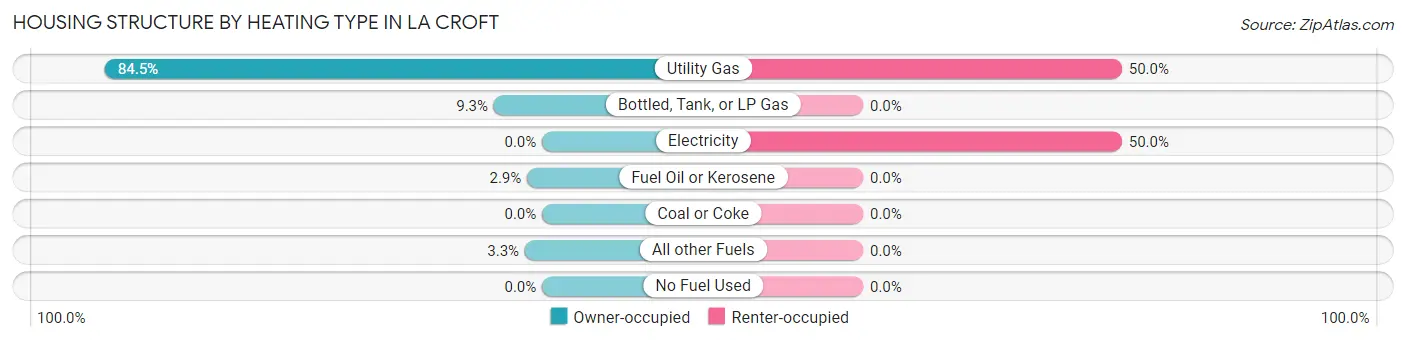
| Heating Type | Owner-occupied | Renter-occupied |
| Utility Gas | 408 (84.5%) | 40 (50.0%) |
| Bottled, Tank, or LP Gas | 45 (9.3%) | 0 (0.0%) |
| Electricity | 0 (0.0%) | 40 (50.0%) |
| Fuel Oil or Kerosene | 14 (2.9%) | 0 (0.0%) |
| Coal or Coke | 0 (0.0%) | 0 (0.0%) |
| All other Fuels | 16 (3.3%) | 0 (0.0%) |
| No Fuel Used | 0 (0.0%) | 0 (0.0%) |
| Total | 483 (100.0%) | 80 (100.0%) |
Household Vehicle Usage in La Croft
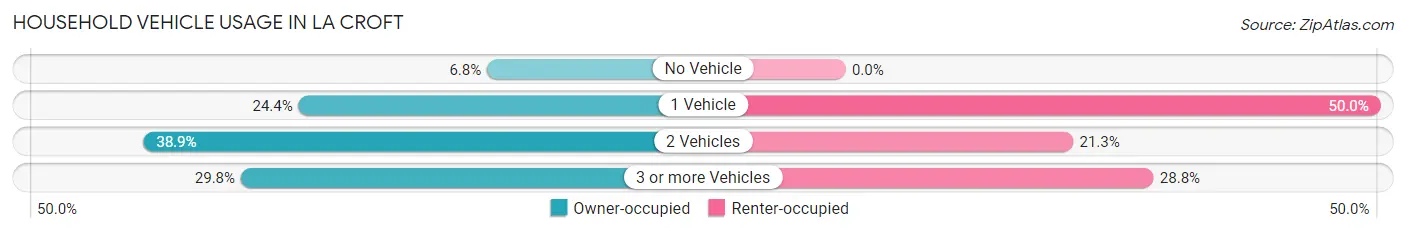
| Vehicles per Household | Owner-occupied | Renter-occupied |
| No Vehicle | 33 (6.8%) | 0 (0.0%) |
| 1 Vehicle | 118 (24.4%) | 40 (50.0%) |
| 2 Vehicles | 188 (38.9%) | 17 (21.2%) |
| 3 or more Vehicles | 144 (29.8%) | 23 (28.7%) |
| Total | 483 (100.0%) | 80 (100.0%) |
Real Estate & Mortgages in La Croft
Real Estate and Mortgage Overview in La Croft
| Characteristic | Without Mortgage | With Mortgage |
| Housing Units | 243 | 240 |
| Median Property Value | $98,100 | $77,100 |
| Median Household Income | $64,313 | $8 |
| Monthly Housing Costs | $435 | $0 |
| Real Estate Taxes | $1,137 | $22 |
Property Value by Mortgage Status in La Croft
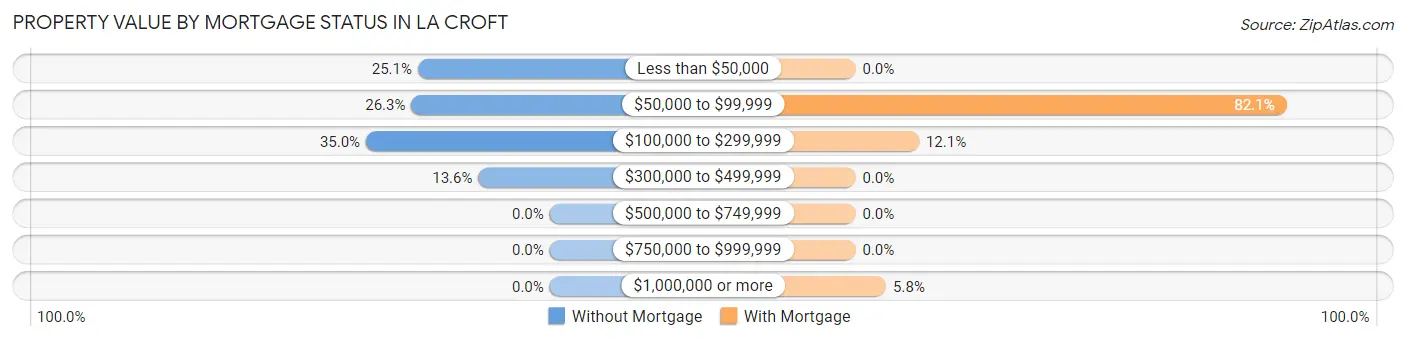
| Property Value | Without Mortgage | With Mortgage |
| Less than $50,000 | 61 (25.1%) | 0 (0.0%) |
| $50,000 to $99,999 | 64 (26.3%) | 197 (82.1%) |
| $100,000 to $299,999 | 85 (35.0%) | 29 (12.1%) |
| $300,000 to $499,999 | 33 (13.6%) | 0 (0.0%) |
| $500,000 to $749,999 | 0 (0.0%) | 0 (0.0%) |
| $750,000 to $999,999 | 0 (0.0%) | 0 (0.0%) |
| $1,000,000 or more | 0 (0.0%) | 14 (5.8%) |
| Total | 243 (100.0%) | 240 (100.0%) |
Household Income by Mortgage Status in La Croft
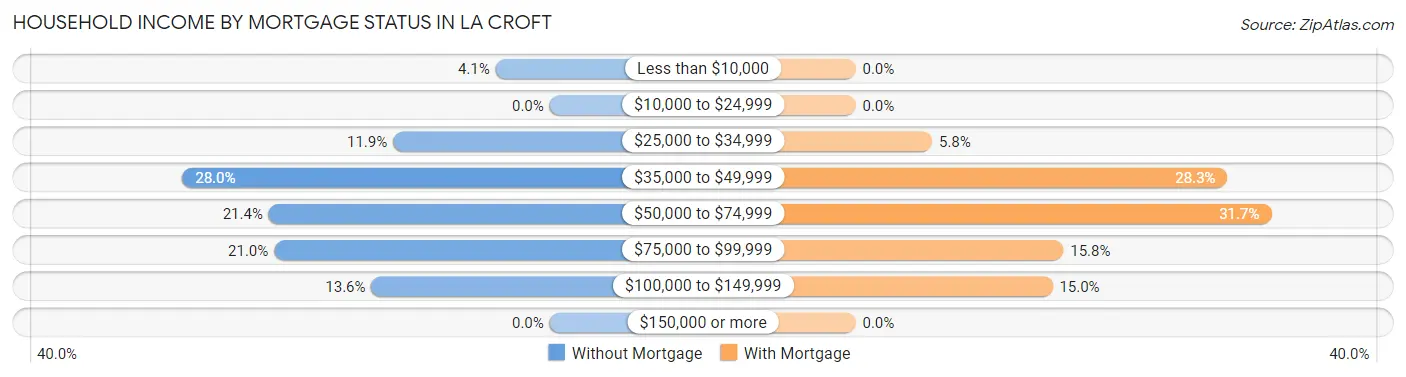
| Household Income | Without Mortgage | With Mortgage |
| Less than $10,000 | 10 (4.1%) | 0 (0.0%) |
| $10,000 to $24,999 | 0 (0.0%) | 0 (0.0%) |
| $25,000 to $34,999 | 29 (11.9%) | 14 (5.8%) |
| $35,000 to $49,999 | 68 (28.0%) | 68 (28.3%) |
| $50,000 to $74,999 | 52 (21.4%) | 76 (31.7%) |
| $75,000 to $99,999 | 51 (21.0%) | 38 (15.8%) |
| $100,000 to $149,999 | 33 (13.6%) | 36 (15.0%) |
| $150,000 or more | 0 (0.0%) | 0 (0.0%) |
| Total | 243 (100.0%) | 240 (100.0%) |
Property Value to Household Income Ratio in La Croft
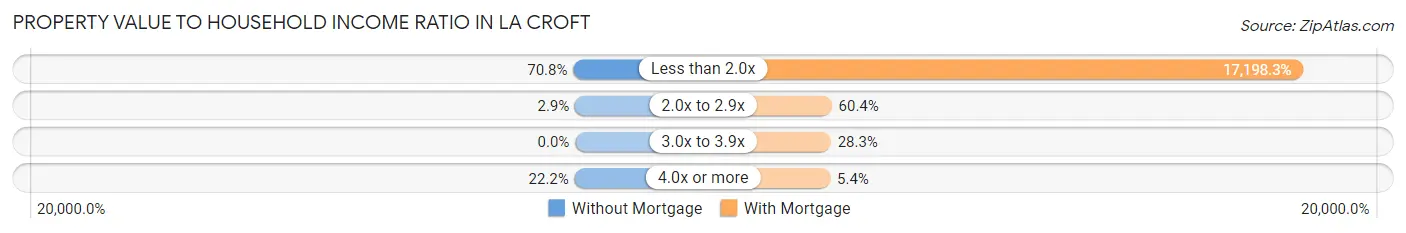
| Value-to-Income Ratio | Without Mortgage | With Mortgage |
| Less than 2.0x | 172 (70.8%) | 41,276 (17,198.3%) |
| 2.0x to 2.9x | 7 (2.9%) | 145 (60.4%) |
| 3.0x to 3.9x | 0 (0.0%) | 68 (28.3%) |
| 4.0x or more | 54 (22.2%) | 13 (5.4%) |
| Total | 243 (100.0%) | 240 (100.0%) |
Real Estate Taxes by Mortgage Status in La Croft

| Property Taxes | Without Mortgage | With Mortgage |
| Less than $800 | 49 (20.2%) | 0 (0.0%) |
| $800 to $1,499 | 140 (57.6%) | 28 (11.7%) |
| $800 to $1,499 | 54 (22.2%) | 128 (53.3%) |
| Total | 243 (100.0%) | 240 (100.0%) |
Health & Disability in La Croft
Health Insurance Coverage by Age in La Croft
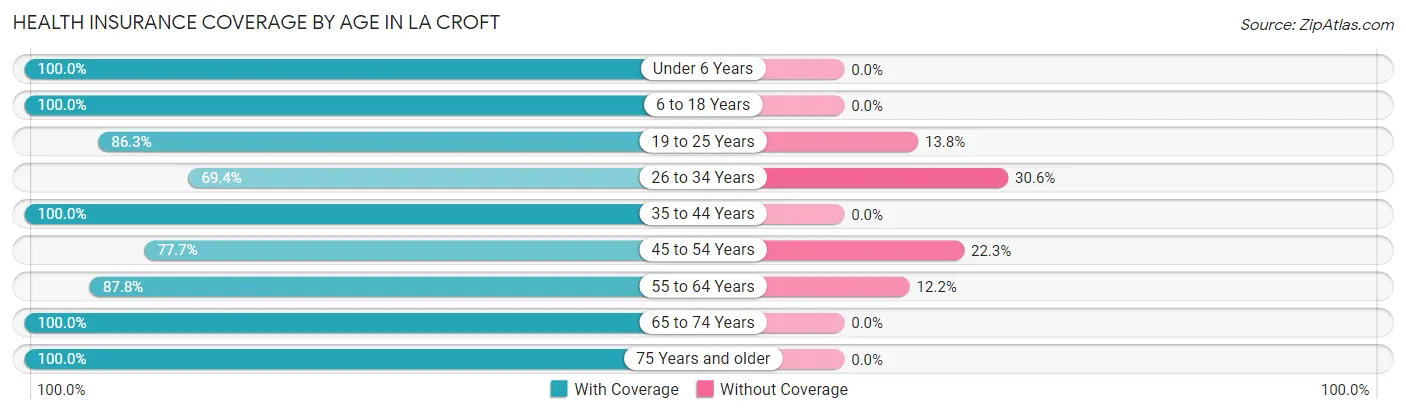
| Age Bracket | With Coverage | Without Coverage |
| Under 6 Years | 25 (100.0%) | 0 (0.0%) |
| 6 to 18 Years | 98 (100.0%) | 0 (0.0%) |
| 19 to 25 Years | 138 (86.3%) | 22 (13.8%) |
| 26 to 34 Years | 25 (69.4%) | 11 (30.6%) |
| 35 to 44 Years | 111 (100.0%) | 0 (0.0%) |
| 45 to 54 Years | 160 (77.7%) | 46 (22.3%) |
| 55 to 64 Years | 281 (87.8%) | 39 (12.2%) |
| 65 to 74 Years | 130 (100.0%) | 0 (0.0%) |
| 75 Years and older | 47 (100.0%) | 0 (0.0%) |
| Total | 1,015 (89.6%) | 118 (10.4%) |
Health Insurance Coverage by Citizenship Status in La Croft

| Citizenship Status | With Coverage | Without Coverage |
| Native Born | 25 (100.0%) | 0 (0.0%) |
| Foreign Born, Citizen | 98 (100.0%) | 0 (0.0%) |
| Foreign Born, not a Citizen | 138 (86.3%) | 22 (13.8%) |
Health Insurance Coverage by Household Income in La Croft

| Household Income | With Coverage | Without Coverage |
| Under $25,000 | 135 (86.0%) | 22 (14.0%) |
| $25,000 to $49,999 | 327 (82.6%) | 69 (17.4%) |
| $50,000 to $74,999 | 202 (100.0%) | 0 (0.0%) |
| $75,000 to $99,999 | 212 (93.0%) | 16 (7.0%) |
| $100,000 and over | 139 (92.7%) | 11 (7.3%) |
Public vs Private Health Insurance Coverage by Age in La Croft
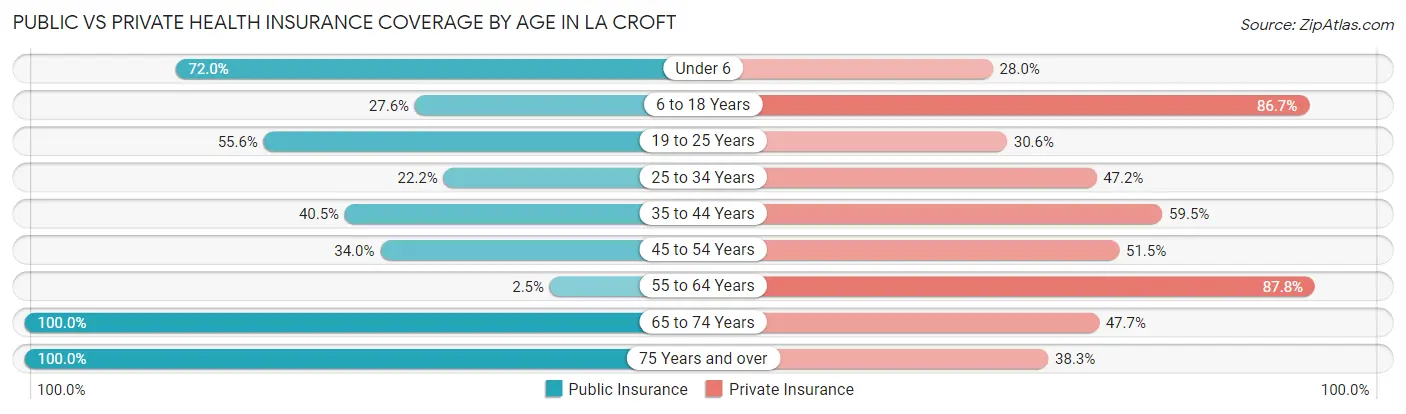
| Age Bracket | Public Insurance | Private Insurance |
| Under 6 | 18 (72.0%) | 7 (28.0%) |
| 6 to 18 Years | 27 (27.6%) | 85 (86.7%) |
| 19 to 25 Years | 89 (55.6%) | 49 (30.6%) |
| 25 to 34 Years | 8 (22.2%) | 17 (47.2%) |
| 35 to 44 Years | 45 (40.5%) | 66 (59.5%) |
| 45 to 54 Years | 70 (34.0%) | 106 (51.5%) |
| 55 to 64 Years | 8 (2.5%) | 281 (87.8%) |
| 65 to 74 Years | 130 (100.0%) | 62 (47.7%) |
| 75 Years and over | 47 (100.0%) | 18 (38.3%) |
| Total | 442 (39.0%) | 691 (61.0%) |
Disability Status by Sex by Age in La Croft
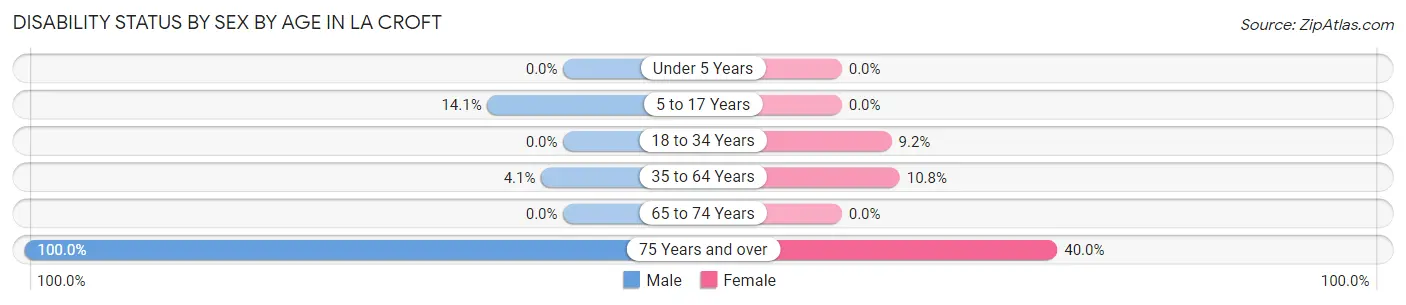
| Age Bracket | Male | Female |
| Under 5 Years | 0 (0.0%) | 0 (0.0%) |
| 5 to 17 Years | 10 (14.1%) | 0 (0.0%) |
| 18 to 34 Years | 0 (0.0%) | 11 (9.2%) |
| 35 to 64 Years | 12 (4.1%) | 37 (10.8%) |
| 65 to 74 Years | 0 (0.0%) | 0 (0.0%) |
| 75 Years and over | 17 (100.0%) | 12 (40.0%) |
Disability Class by Sex by Age in La Croft
Disability Class: Hearing Difficulty
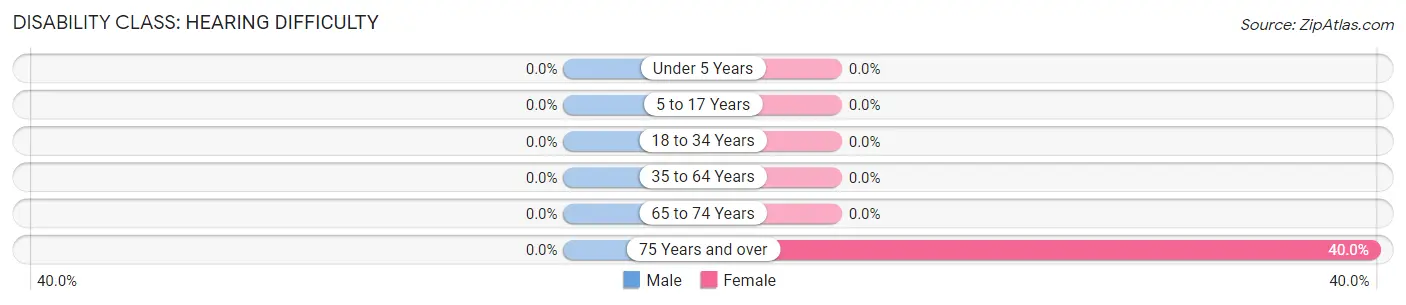
| Age Bracket | Male | Female |
| Under 5 Years | 0 (0.0%) | 0 (0.0%) |
| 5 to 17 Years | 0 (0.0%) | 0 (0.0%) |
| 18 to 34 Years | 0 (0.0%) | 0 (0.0%) |
| 35 to 64 Years | 0 (0.0%) | 0 (0.0%) |
| 65 to 74 Years | 0 (0.0%) | 0 (0.0%) |
| 75 Years and over | 0 (0.0%) | 12 (40.0%) |
Disability Class: Vision Difficulty
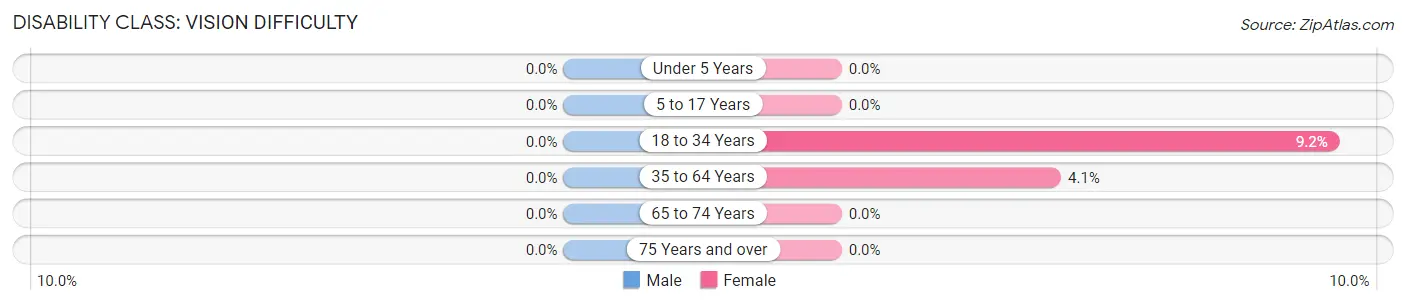
| Age Bracket | Male | Female |
| Under 5 Years | 0 (0.0%) | 0 (0.0%) |
| 5 to 17 Years | 0 (0.0%) | 0 (0.0%) |
| 18 to 34 Years | 0 (0.0%) | 11 (9.2%) |
| 35 to 64 Years | 0 (0.0%) | 14 (4.1%) |
| 65 to 74 Years | 0 (0.0%) | 0 (0.0%) |
| 75 Years and over | 0 (0.0%) | 0 (0.0%) |
Disability Class: Cognitive Difficulty
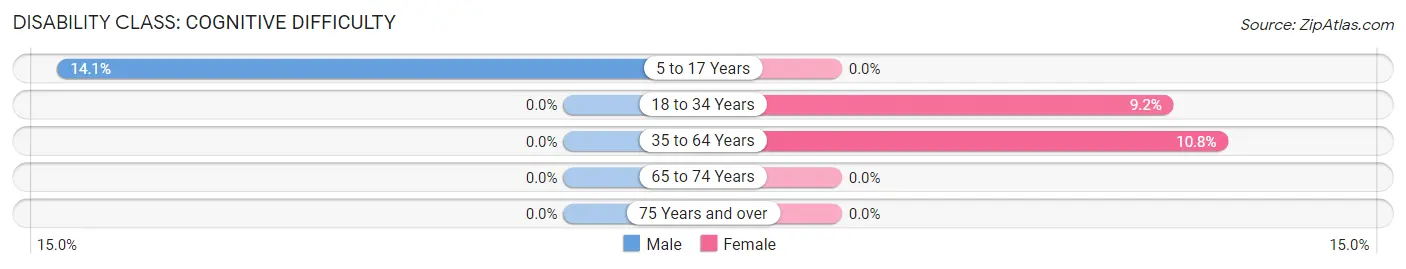
| Age Bracket | Male | Female |
| 5 to 17 Years | 10 (14.1%) | 0 (0.0%) |
| 18 to 34 Years | 0 (0.0%) | 11 (9.2%) |
| 35 to 64 Years | 0 (0.0%) | 37 (10.8%) |
| 65 to 74 Years | 0 (0.0%) | 0 (0.0%) |
| 75 Years and over | 0 (0.0%) | 0 (0.0%) |
Disability Class: Ambulatory Difficulty

| Age Bracket | Male | Female |
| 5 to 17 Years | 10 (14.1%) | 0 (0.0%) |
| 18 to 34 Years | 0 (0.0%) | 0 (0.0%) |
| 35 to 64 Years | 12 (4.1%) | 37 (10.8%) |
| 65 to 74 Years | 0 (0.0%) | 0 (0.0%) |
| 75 Years and over | 17 (100.0%) | 0 (0.0%) |
Disability Class: Self-Care Difficulty
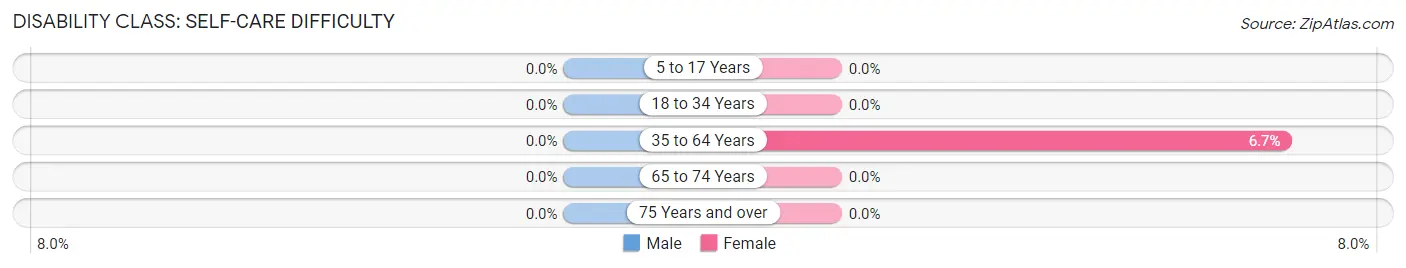
| Age Bracket | Male | Female |
| 5 to 17 Years | 0 (0.0%) | 0 (0.0%) |
| 18 to 34 Years | 0 (0.0%) | 0 (0.0%) |
| 35 to 64 Years | 0 (0.0%) | 23 (6.7%) |
| 65 to 74 Years | 0 (0.0%) | 0 (0.0%) |
| 75 Years and over | 0 (0.0%) | 0 (0.0%) |
Technology Access in La Croft
Computing Device Access in La Croft
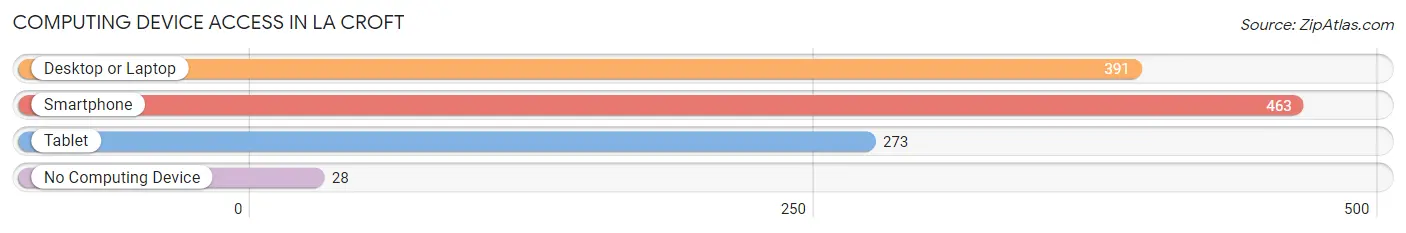
| Device Type | # Households | % Households |
| Desktop or Laptop | 391 | 69.5% |
| Smartphone | 463 | 82.2% |
| Tablet | 273 | 48.5% |
| No Computing Device | 28 | 5.0% |
| Total | 563 | 100.0% |
Internet Access in La Croft
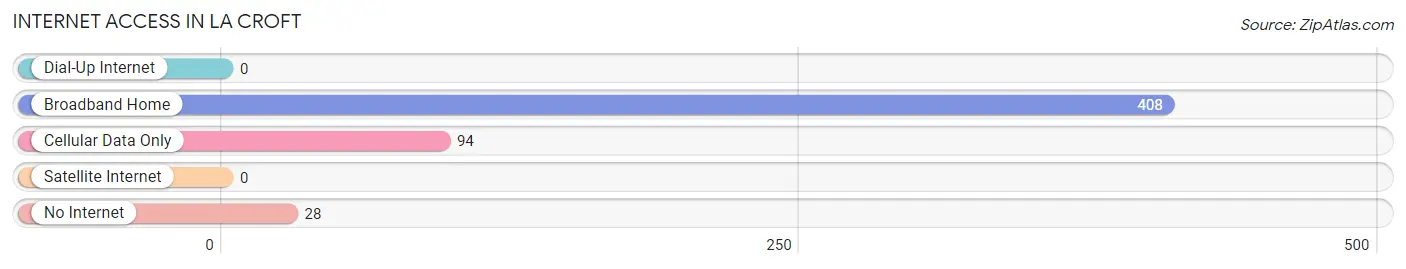
| Internet Type | # Households | % Households |
| Dial-Up Internet | 0 | 0.0% |
| Broadband Home | 408 | 72.5% |
| Cellular Data Only | 94 | 16.7% |
| Satellite Internet | 0 | 0.0% |
| No Internet | 28 | 5.0% |
| Total | 563 | 100.0% |
La Croft Summary
La Croft is a small village located in the state of Ohio, United States. It is situated in the county of Cuyahoga, and is part of the Greater Cleveland metropolitan area. The village has a population of approximately 1,000 people, and is located about 20 miles south of Cleveland.
History
La Croft was founded in 1819 by a group of settlers from New England. The village was originally known as “New England”, but was later changed to La Croft in 1825. The name was chosen to honor the French explorer, La Salle, who explored the area in the late 1600s.
The village was originally a farming community, and the main crops grown were wheat, corn, and oats. In the late 1800s, the village began to grow and develop, and by the early 1900s, it had become a popular tourist destination. The village was known for its beautiful scenery, and many people would come to visit the area for its natural beauty.
In the early 1900s, the village also began to attract industry, and several factories were built in the area. These factories included a paper mill, a furniture factory, and a canning factory. The village also had a railroad station, which allowed for easy transportation of goods and people.
Geography
La Croft is located in the northeastern part of Cuyahoga County, Ohio. It is situated on the banks of the Cuyahoga River, and is surrounded by the cities of Cleveland, Akron, and Canton. The village is located about 20 miles south of Cleveland, and is about 30 miles east of Akron.
The village is situated on a flat plain, and is surrounded by rolling hills and forests. The climate in La Croft is humid continental, with hot summers and cold winters. The average temperature in the summer is around 75 degrees Fahrenheit, and the average temperature in the winter is around 25 degrees Fahrenheit.
Economy
The economy of La Croft is largely based on agriculture and tourism. The village is home to several farms, which produce a variety of crops, including wheat, corn, and oats. The village also has several small businesses, including restaurants, shops, and a few small manufacturing companies.
The village is also a popular tourist destination, and many people come to visit the area for its natural beauty. The village is home to several parks, including the La Croft State Park, which offers camping, fishing, and hiking opportunities.
Demographics
As of the 2010 census, the population of La Croft was 1,000 people. The racial makeup of the village was 97.2% White, 0.7% African American, 0.3% Native American, 0.3% Asian, and 1.5% from other races. The median household income in the village was $45,000, and the median age was 40 years.
Conclusion
La Croft is a small village located in the state of Ohio, United States. It is situated in the county of Cuyahoga, and is part of the Greater Cleveland metropolitan area. The village has a population of approximately 1,000 people, and is located about 20 miles south of Cleveland. The village was founded in 1819 by a group of settlers from New England, and was originally known as “New England”. The economy of La Croft is largely based on agriculture and tourism, and the village is home to several farms, businesses, and parks. As of the 2010 census, the population of La Croft was 1,000 people, and the median household income was $45,000.
Common Questions
What is Per Capita Income in La Croft?
Per Capita income in La Croft is $27,882.
What is the Median Family Income in La Croft?
Median Family Income in La Croft is $58,783.
What is the Median Household income in La Croft?
Median Household Income in La Croft is $40,179.
What is Income or Wage Gap in La Croft?
Income or Wage Gap in La Croft is 15.4%.
Women in La Croft earn 84.6 cents for every dollar earned by a man.
What is Family Income Deficit in La Croft?
Family Income Deficit in La Croft is $7,043.
Families that are below poverty line in La Croft earn $7,043 less on average than the poverty threshold level.
What is Inequality or Gini Index in La Croft?
Inequality or Gini Index in La Croft is 0.33.
What is the Total Population of La Croft?
Total Population of La Croft is 1,133.
What is the Total Male Population of La Croft?
Total Male Population of La Croft is 577.
What is the Total Female Population of La Croft?
Total Female Population of La Croft is 556.
What is the Ratio of Males per 100 Females in La Croft?
There are 103.78 Males per 100 Females in La Croft.
What is the Ratio of Females per 100 Males in La Croft?
There are 96.36 Females per 100 Males in La Croft.
What is the Median Population Age in La Croft?
Median Population Age in La Croft is 50.6 Years.
What is the Average Family Size in La Croft
Average Family Size in La Croft is 2.6 People.
What is the Average Household Size in La Croft
Average Household Size in La Croft is 2.0 People.
How Large is the Labor Force in La Croft?
There are 609 People in the Labor Forcein in La Croft.
What is the Percentage of People in the Labor Force in La Croft?
57.9% of People are in the Labor Force in La Croft.
What is the Unemployment Rate in La Croft?
Unemployment Rate in La Croft is 8.7%.