Negley, OH Map & Demographics
Negley Map
Negley Overview
$53,568
PER CAPITA INCOME
$23,487
AVG FAMILY INCOME
0.40
INEQUALITY / GINI INDEX
305
TOTAL POPULATION
153
MALE POPULATION
152
FEMALE POPULATION
100.66
MALES / 100 FEMALES
99.35
FEMALES / 100 MALES
63.0
MEDIAN AGE
2.2
AVG FAMILY SIZE
1.7
AVG HOUSEHOLD SIZE
216
LABOR FORCE [ PEOPLE ]
83.1%
PERCENT IN LABOR FORCE
Negley Zip Codes
Negley Area Codes
Income in Negley
Income Overview in Negley
| Characteristic | Number | Measure |
| Per Capita Income | 305 | $53,568 |
| Median Family Income | 54 | $23,487 |
| Mean Family Income | 54 | $24,148 |
| Median Household Income | 183 | $0 |
| Mean Household Income | 183 | $100,205 |
| Income Deficit | 54 | $0 |
| Wage / Income Gap (%) | 305 | 0.00% |
| Wage / Income Gap ($) | 305 | 100.00¢ per $1 |
| Gini / Inequality Index | 305 | 0.40 |
Earnings by Sex in Negley
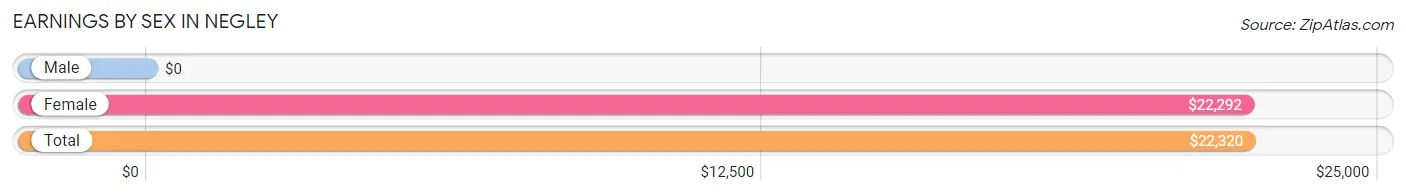
| Sex | Number | Average Earnings |
| Male | 97 (42.9%) | $0 |
| Female | 129 (57.1%) | $22,292 |
| Total | 226 (100.0%) | $22,320 |
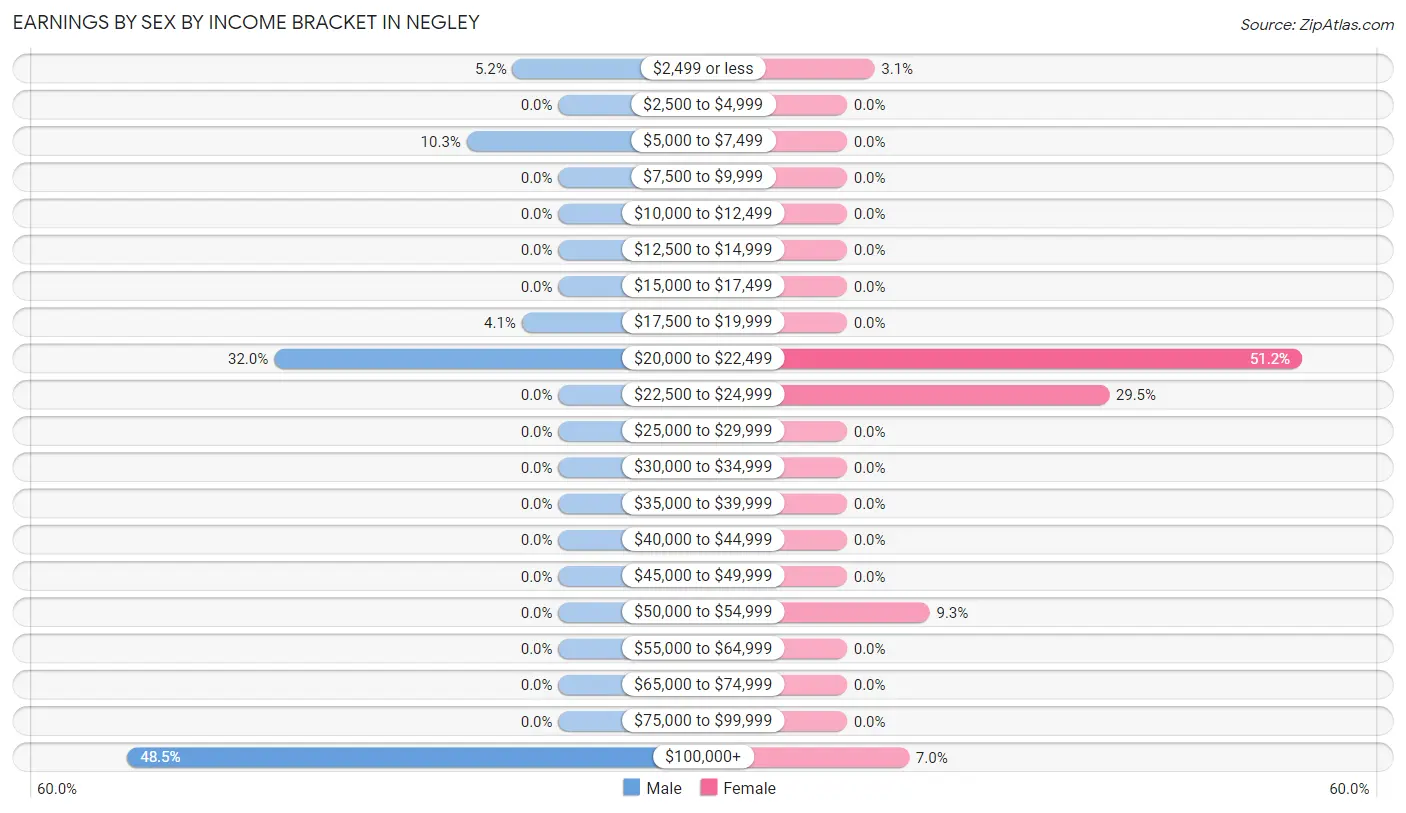
Earnings by Sex by Income Bracket in Negley
The most common earnings brackets in Negley are $100,000+ for men (47 | 48.4%) and $20,000 to $22,499 for women (66 | 51.2%).
| Income | Male | Female |
| $2,499 or less | 5 (5.1%) | 4 (3.1%) |
| $2,500 to $4,999 | 0 (0.0%) | 0 (0.0%) |
| $5,000 to $7,499 | 10 (10.3%) | 0 (0.0%) |
| $7,500 to $9,999 | 0 (0.0%) | 0 (0.0%) |
| $10,000 to $12,499 | 0 (0.0%) | 0 (0.0%) |
| $12,500 to $14,999 | 0 (0.0%) | 0 (0.0%) |
| $15,000 to $17,499 | 0 (0.0%) | 0 (0.0%) |
| $17,500 to $19,999 | 4 (4.1%) | 0 (0.0%) |
| $20,000 to $22,499 | 31 (32.0%) | 66 (51.2%) |
| $22,500 to $24,999 | 0 (0.0%) | 38 (29.5%) |
| $25,000 to $29,999 | 0 (0.0%) | 0 (0.0%) |
| $30,000 to $34,999 | 0 (0.0%) | 0 (0.0%) |
| $35,000 to $39,999 | 0 (0.0%) | 0 (0.0%) |
| $40,000 to $44,999 | 0 (0.0%) | 0 (0.0%) |
| $45,000 to $49,999 | 0 (0.0%) | 0 (0.0%) |
| $50,000 to $54,999 | 0 (0.0%) | 12 (9.3%) |
| $55,000 to $64,999 | 0 (0.0%) | 0 (0.0%) |
| $65,000 to $74,999 | 0 (0.0%) | 0 (0.0%) |
| $75,000 to $99,999 | 0 (0.0%) | 0 (0.0%) |
| $100,000+ | 47 (48.4%) | 9 (7.0%) |
| Total | 97 (100.0%) | 129 (100.0%) |
Earnings by Sex by Educational Attainment in Negley
| Educational Attainment | Male Income | Female Income |
| Less than High School | - | - |
| High School Diploma | - | - |
| College or Associate's Degree | - | - |
| Bachelor's Degree | - | - |
| Graduate Degree | - | - |
| Total | - | - |
Family Income in Negley
Family Income Brackets in Negley
According to the Negley family income data, there are 50 families falling into the $15,000 to $24,999 income range, which is the most common income bracket and makes up 92.6% of all families.
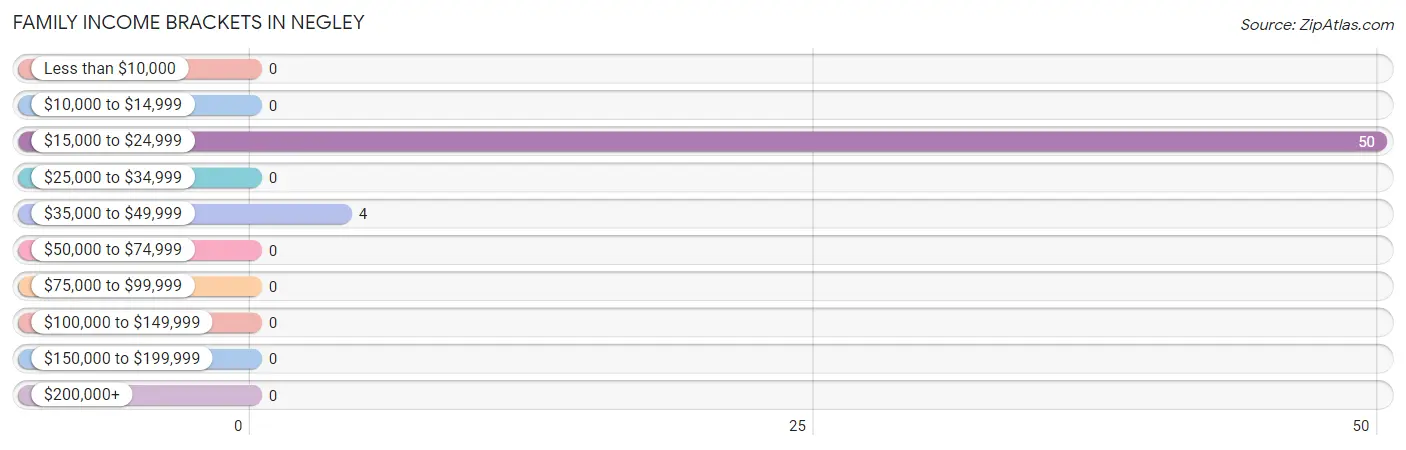
| Income Bracket | # Families | % Families |
| Less than $10,000 | 0 | 0.0% |
| $10,000 to $14,999 | 0 | 0.0% |
| $15,000 to $24,999 | 50 | 92.6% |
| $25,000 to $34,999 | 0 | 0.0% |
| $35,000 to $49,999 | 4 | 7.4% |
| $50,000 to $74,999 | 0 | 0.0% |
| $75,000 to $99,999 | 0 | 0.0% |
| $100,000 to $149,999 | 0 | 0.0% |
| $150,000 to $199,999 | 0 | 0.0% |
| $200,000+ | 0 | 0.0% |
Family Income by Famaliy Size in Negley
| Income Bracket | # Families | Median Income |
| 2-Person Families | 50 (92.6%) | $0 |
| 3-Person Families | 4 (7.4%) | $0 |
| 4-Person Families | 0 (0.0%) | $0 |
| 5-Person Families | 0 (0.0%) | $0 |
| 6-Person Families | 0 (0.0%) | $0 |
| 7+ Person Families | 0 (0.0%) | $0 |
| Total | 54 (100.0%) | $23,487 |
Family Income by Number of Earners in Negley
| Number of Earners | # Families | Median Income |
| No Earners | 12 (22.2%) | $0 |
| 1 Earner | 38 (70.4%) | $0 |
| 2 Earners | 0 (0.0%) | $0 |
| 3+ Earners | 4 (7.4%) | $0 |
| Total | 54 (100.0%) | $23,487 |
Household Income in Negley
Household Income Brackets in Negley
With 66 households falling in the category, the $150,000 to $199,999 income range is the most frequent in Negley, accounting for 36.1% of all households.
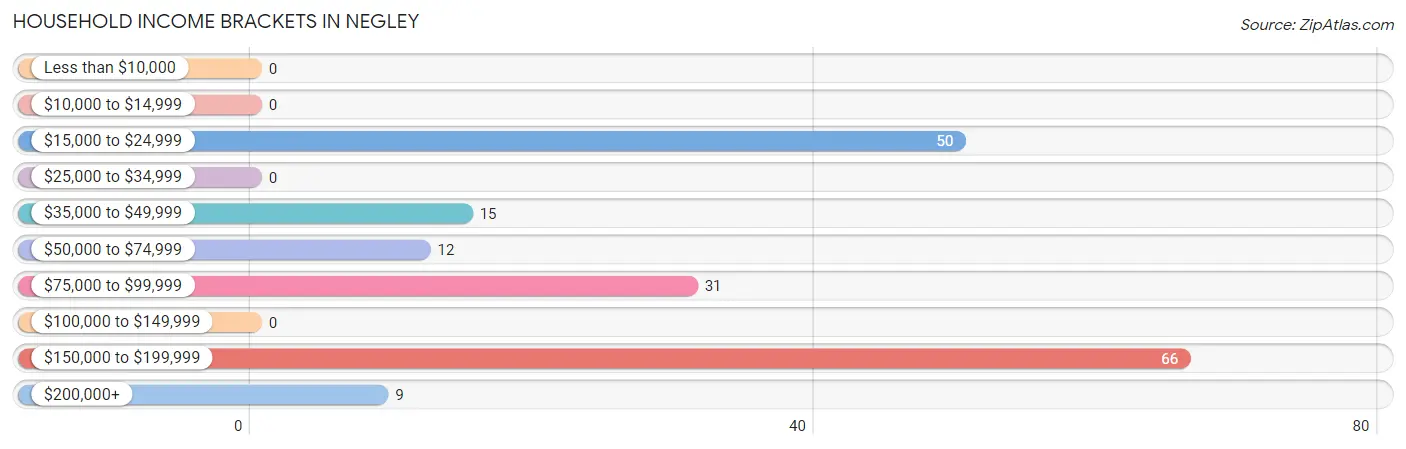
| Income Bracket | # Households | % Households |
| Less than $10,000 | 0 | 0.0% |
| $10,000 to $14,999 | 0 | 0.0% |
| $15,000 to $24,999 | 50 | 27.3% |
| $25,000 to $34,999 | 0 | 0.0% |
| $35,000 to $49,999 | 15 | 8.2% |
| $50,000 to $74,999 | 12 | 6.6% |
| $75,000 to $99,999 | 31 | 16.9% |
| $100,000 to $149,999 | 0 | 0.0% |
| $150,000 to $199,999 | 66 | 36.1% |
| $200,000+ | 9 | 4.9% |
Household Income by Householder Age in Negley
The median household income in Negley is $0, with the highest median household income of $88,024 found in the 65+ years age bracket for the primary householder. A total of 67 households (36.6%) fall into this category.
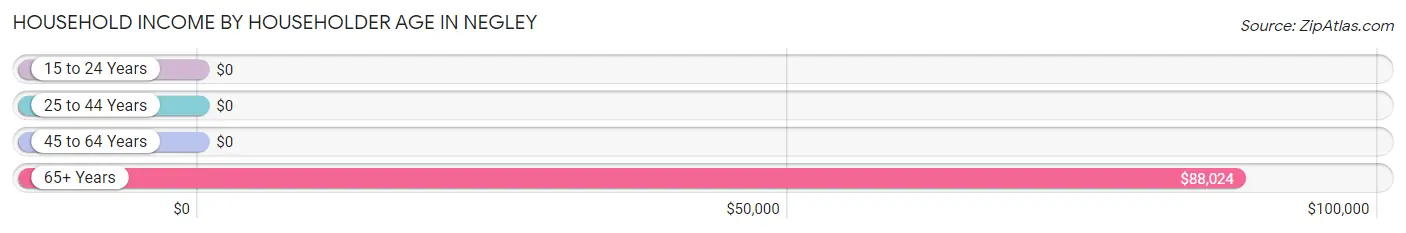
| Income Bracket | # Households | Median Income |
| 15 to 24 Years | 0 (0.0%) | $0 |
| 25 to 44 Years | 0 (0.0%) | $0 |
| 45 to 64 Years | 116 (63.4%) | $0 |
| 65+ Years | 67 (36.6%) | $88,024 |
| Total | 183 (100.0%) | $0 |
Poverty in Negley
Income Below Poverty by Sex and Age in Negley
With 7.2% poverty level for males and 15.1% for females among the residents of Negley, 75 year old and over males and 65 to 74 year old females are the most vulnerable to poverty, with 11 males (52.4%) and 11 females (55.0%) in their respective age groups living below the poverty level.
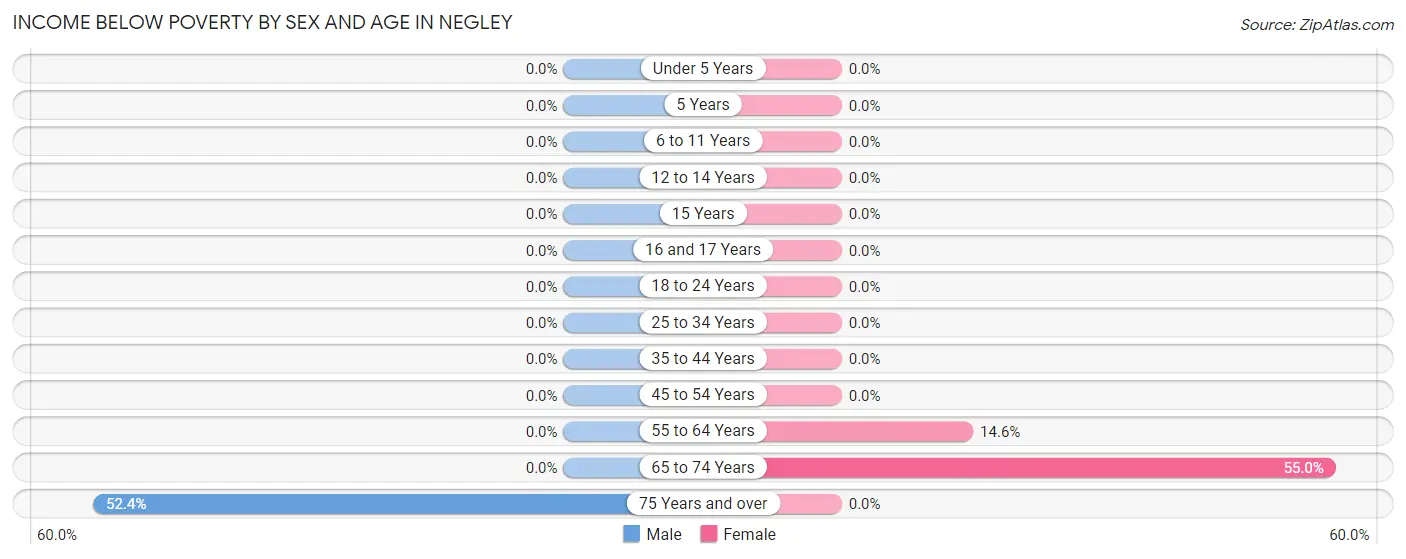
| Age Bracket | Male | Female |
| Under 5 Years | 0 (0.0%) | 0 (0.0%) |
| 5 Years | 0 (0.0%) | 0 (0.0%) |
| 6 to 11 Years | 0 (0.0%) | 0 (0.0%) |
| 12 to 14 Years | 0 (0.0%) | 0 (0.0%) |
| 15 Years | 0 (0.0%) | 0 (0.0%) |
| 16 and 17 Years | 0 (0.0%) | 0 (0.0%) |
| 18 to 24 Years | 0 (0.0%) | 0 (0.0%) |
| 25 to 34 Years | 0 (0.0%) | 0 (0.0%) |
| 35 to 44 Years | 0 (0.0%) | 0 (0.0%) |
| 45 to 54 Years | 0 (0.0%) | 0 (0.0%) |
| 55 to 64 Years | 0 (0.0%) | 12 (14.6%) |
| 65 to 74 Years | 0 (0.0%) | 11 (55.0%) |
| 75 Years and over | 11 (52.4%) | 0 (0.0%) |
| Total | 11 (7.2%) | 23 (15.1%) |
Income Above Poverty by Sex and Age in Negley
According to the poverty statistics in Negley, males aged 12 to 14 years and females aged 45 to 54 years are the age groups that are most secure financially, with 100.0% of males and 100.0% of females in these age groups living above the poverty line.
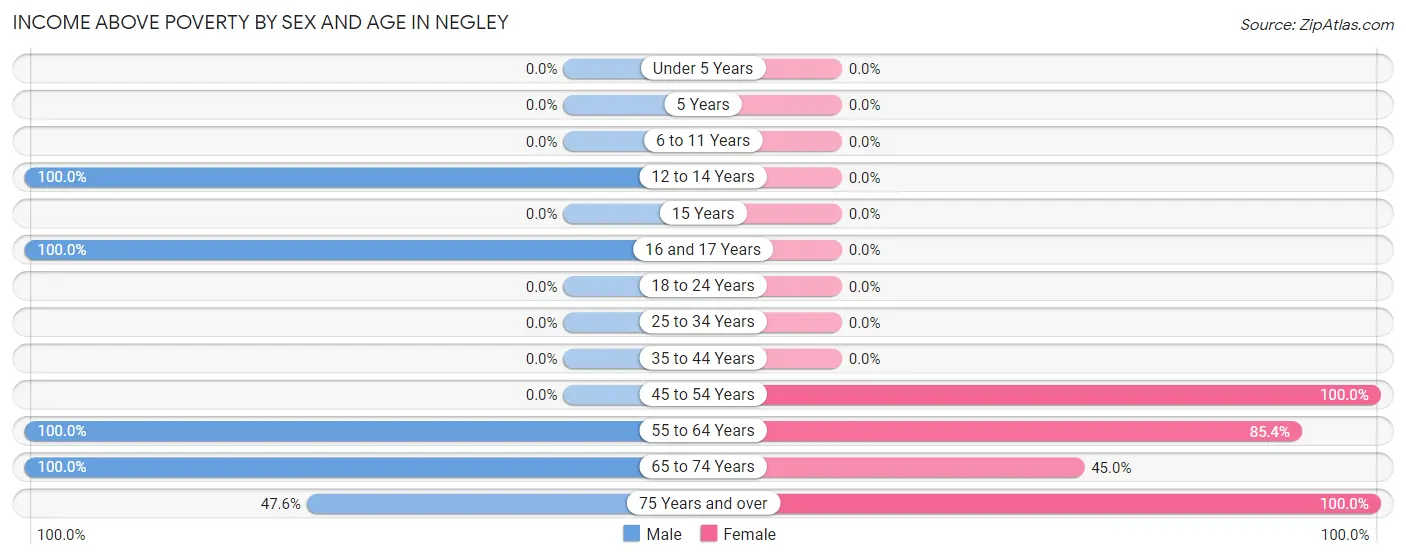
| Age Bracket | Male | Female |
| Under 5 Years | 0 (0.0%) | 0 (0.0%) |
| 5 Years | 0 (0.0%) | 0 (0.0%) |
| 6 to 11 Years | 0 (0.0%) | 0 (0.0%) |
| 12 to 14 Years | 45 (100.0%) | 0 (0.0%) |
| 15 Years | 0 (0.0%) | 0 (0.0%) |
| 16 and 17 Years | 5 (100.0%) | 0 (0.0%) |
| 18 to 24 Years | 0 (0.0%) | 0 (0.0%) |
| 25 to 34 Years | 0 (0.0%) | 0 (0.0%) |
| 35 to 44 Years | 0 (0.0%) | 0 (0.0%) |
| 45 to 54 Years | 0 (0.0%) | 38 (100.0%) |
| 55 to 64 Years | 47 (100.0%) | 70 (85.4%) |
| 65 to 74 Years | 35 (100.0%) | 9 (45.0%) |
| 75 Years and over | 10 (47.6%) | 12 (100.0%) |
| Total | 142 (92.8%) | 129 (84.9%) |
Income Below Poverty Among Married-Couple Families in Negley
The poverty statistics for married-couple families in Negley show that 75.0% or 12 of the total 16 families live below the poverty line. Families with no children have the highest poverty rate of 100.0%, comprising of 12 families. On the other hand, families with 1 or 2 children have the lowest poverty rate of 0.0%, which includes 0 families.
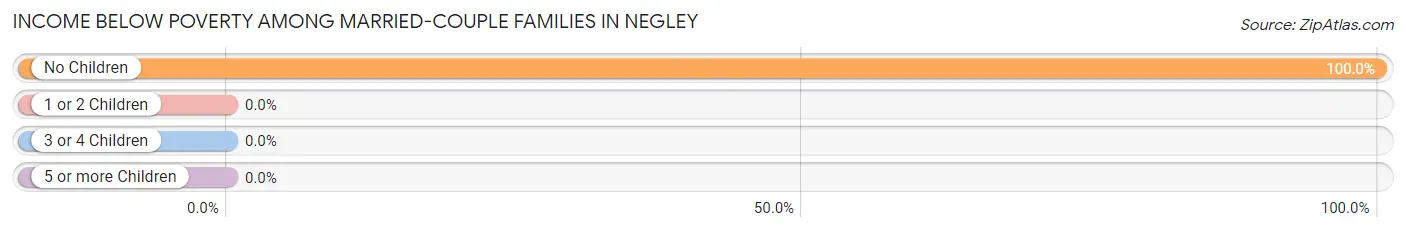
| Children | Above Poverty | Below Poverty |
| No Children | 0 (0.0%) | 12 (100.0%) |
| 1 or 2 Children | 4 (100.0%) | 0 (0.0%) |
| 3 or 4 Children | 0 (0.0%) | 0 (0.0%) |
| 5 or more Children | 0 (0.0%) | 0 (0.0%) |
| Total | 4 (25.0%) | 12 (75.0%) |
Income Below Poverty Among Single-Parent Households in Negley
| Children | Single Father | Single Mother |
| No Children | 0 (0.0%) | 0 (0.0%) |
| 1 or 2 Children | 0 (0.0%) | 0 (0.0%) |
| 3 or 4 Children | 0 (0.0%) | 0 (0.0%) |
| 5 or more Children | 0 (0.0%) | 0 (0.0%) |
| Total | 0 (0.0%) | 0 (0.0%) |
Income Below Poverty Among Married-Couple vs Single-Parent Households in Negley
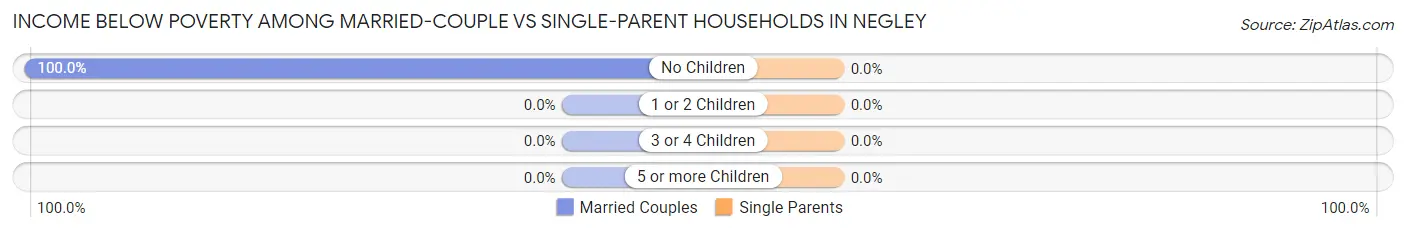
| Children | Married-Couple Families | Single-Parent Households |
| No Children | 12 (100.0%) | 0 (0.0%) |
| 1 or 2 Children | 0 (0.0%) | 0 (0.0%) |
| 3 or 4 Children | 0 (0.0%) | 0 (0.0%) |
| 5 or more Children | 0 (0.0%) | 0 (0.0%) |
| Total | 12 (75.0%) | 0 (0.0%) |
Race in Negley
The most populous races in Negley are , and White / Caucasian (305 | 100.0%).
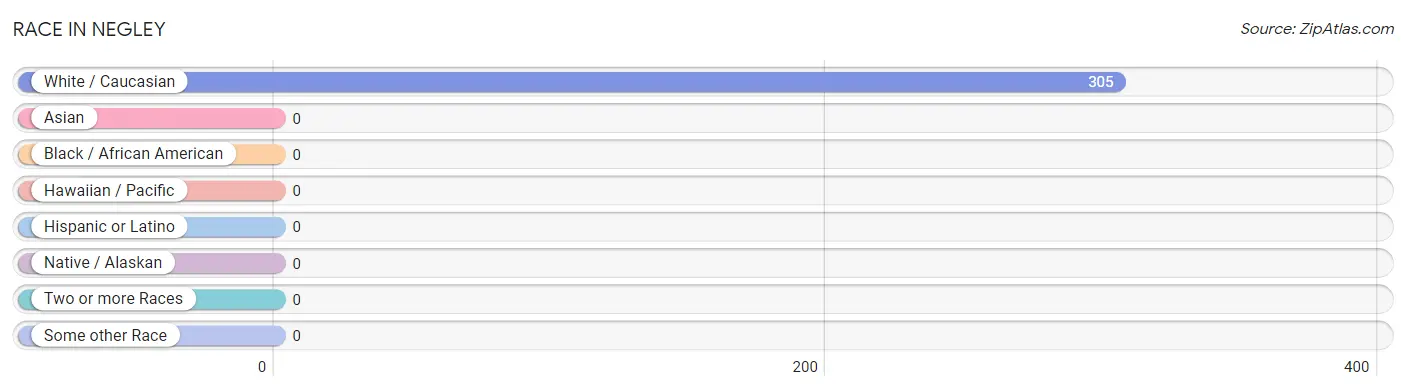
| Race | # Population | % Population |
| Asian | 0 | 0.0% |
| Black / African American | 0 | 0.0% |
| Hawaiian / Pacific | 0 | 0.0% |
| Hispanic or Latino | 0 | 0.0% |
| Native / Alaskan | 0 | 0.0% |
| White / Caucasian | 305 | 100.0% |
| Two or more Races | 0 | 0.0% |
| Some other Race | 0 | 0.0% |
| Total | 305 | 100.0% |
Ancestry in Negley
The most populous ancestries reported in Negley are Irish (50 | 16.4%), French (47 | 15.4%), English (41 | 13.4%), Scotch-Irish (31 | 10.2%), and American (13 | 4.3%), together accounting for 59.7% of all Negley residents.
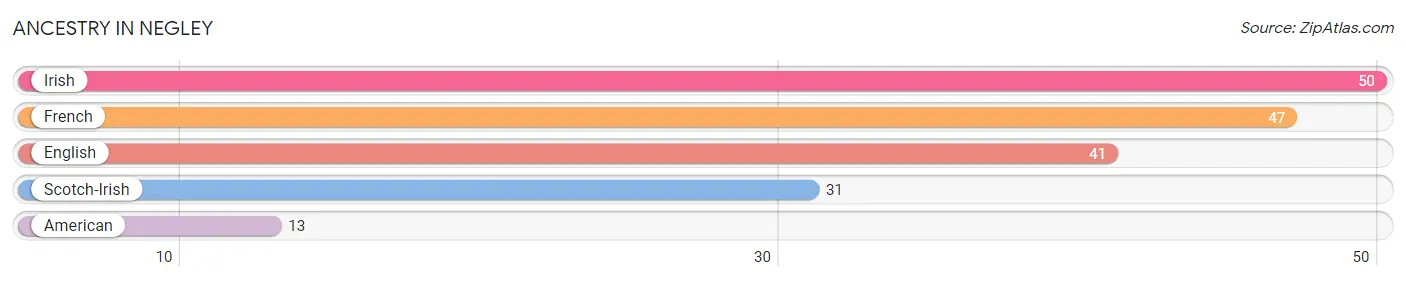
| Ancestry | # Population | % Population |
| American | 13 | 4.3% |
| English | 41 | 13.4% |
| French | 47 | 15.4% |
| Irish | 50 | 16.4% |
| Scotch-Irish | 31 | 10.2% | View All 5 Rows |
Immigrants in Negley

| Immigration Origin | # Population | % Population | View All 0 Rows |
Sex and Age in Negley
Sex and Age in Negley
The most populous age groups in Negley are 60 to 64 Years (47 | 30.7%) for men and 60 to 64 Years (70 | 46.1%) for women.
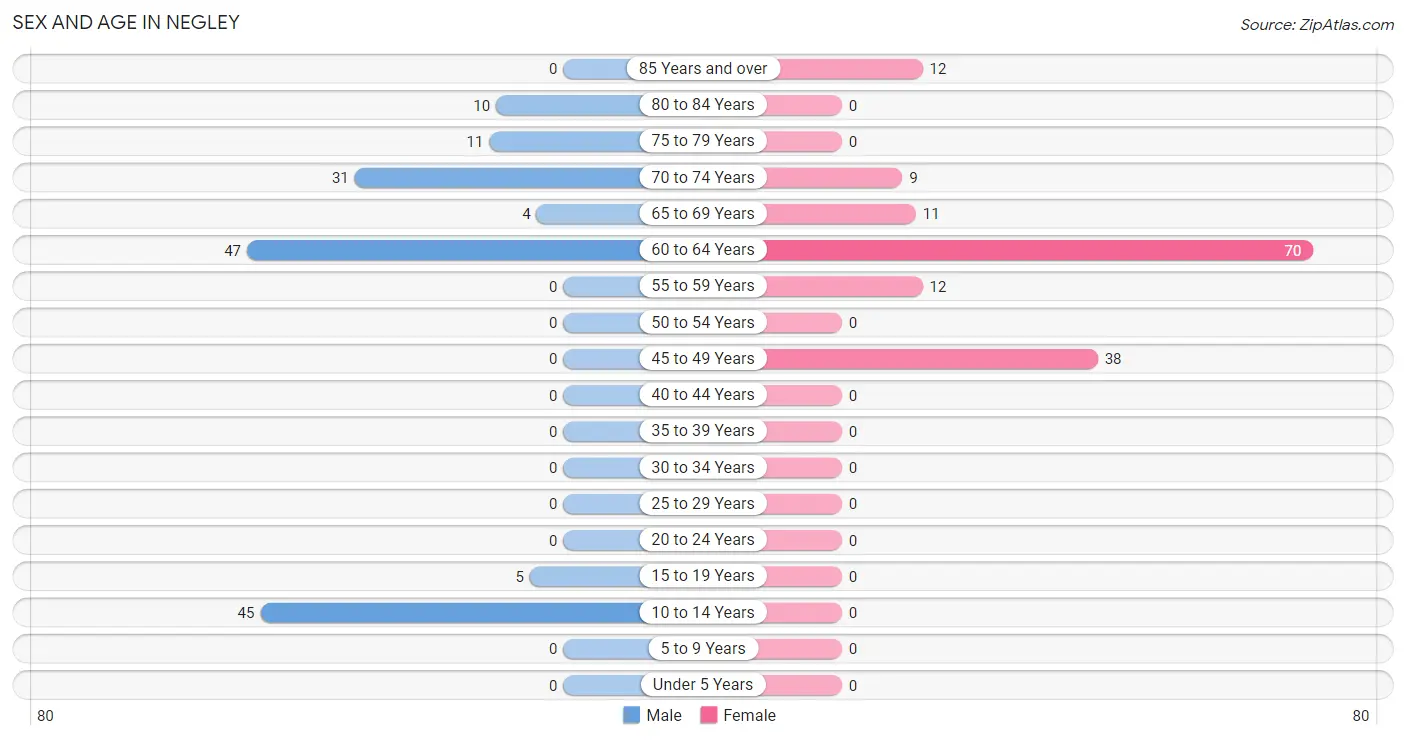
| Age Bracket | Male | Female |
| Under 5 Years | 0 (0.0%) | 0 (0.0%) |
| 5 to 9 Years | 0 (0.0%) | 0 (0.0%) |
| 10 to 14 Years | 45 (29.4%) | 0 (0.0%) |
| 15 to 19 Years | 5 (3.3%) | 0 (0.0%) |
| 20 to 24 Years | 0 (0.0%) | 0 (0.0%) |
| 25 to 29 Years | 0 (0.0%) | 0 (0.0%) |
| 30 to 34 Years | 0 (0.0%) | 0 (0.0%) |
| 35 to 39 Years | 0 (0.0%) | 0 (0.0%) |
| 40 to 44 Years | 0 (0.0%) | 0 (0.0%) |
| 45 to 49 Years | 0 (0.0%) | 38 (25.0%) |
| 50 to 54 Years | 0 (0.0%) | 0 (0.0%) |
| 55 to 59 Years | 0 (0.0%) | 12 (7.9%) |
| 60 to 64 Years | 47 (30.7%) | 70 (46.1%) |
| 65 to 69 Years | 4 (2.6%) | 11 (7.2%) |
| 70 to 74 Years | 31 (20.3%) | 9 (5.9%) |
| 75 to 79 Years | 11 (7.2%) | 0 (0.0%) |
| 80 to 84 Years | 10 (6.5%) | 0 (0.0%) |
| 85 Years and over | 0 (0.0%) | 12 (7.9%) |
| Total | 153 (100.0%) | 152 (100.0%) |
Families and Households in Negley
Median Family Size in Negley
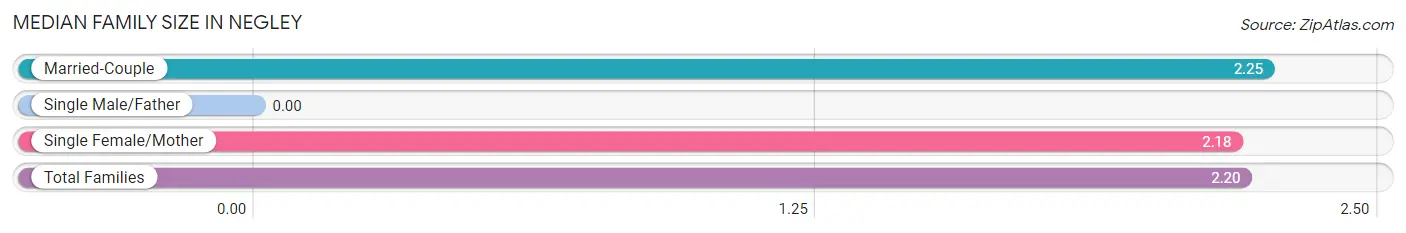
| Family Type | # Families | Family Size |
| Married-Couple | 16 (29.6%) | 2.25 |
| Single Male/Father | 0 (0.0%) | - |
| Single Female/Mother | 38 (70.4%) | 2.18 |
| Total Families | 54 (100.0%) | 2.20 |
Median Household Size in Negley
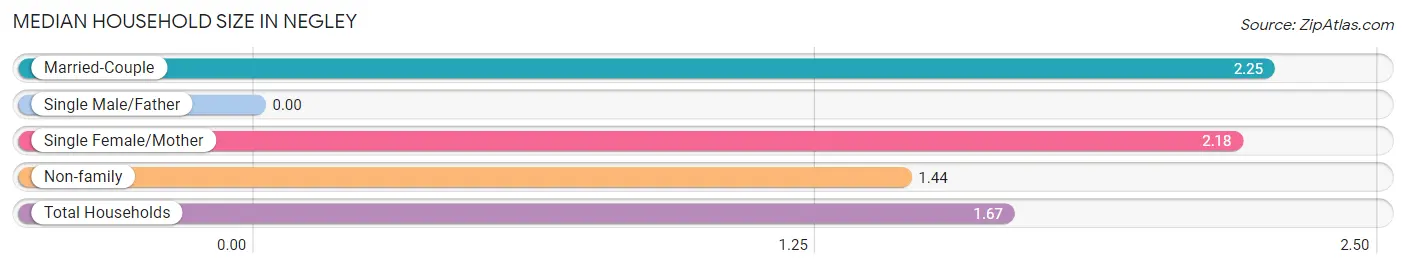
| Household Type | # Households | Household Size |
| Married-Couple | 16 (8.7%) | 2.25 |
| Single Male/Father | 0 (0.0%) | - |
| Single Female/Mother | 38 (20.8%) | 2.18 |
| Non-family | 129 (70.5%) | 1.44 |
| Total Households | 183 (100.0%) | 1.67 |
Household Size by Marriage Status in Negley
Out of a total of 183 households in Negley, 54 (29.5%) are family households, while 129 (70.5%) are nonfamily households. The most numerous type of family households are 2-person households, comprising 50, and the most common type of nonfamily households are 2-person households, comprising 77.
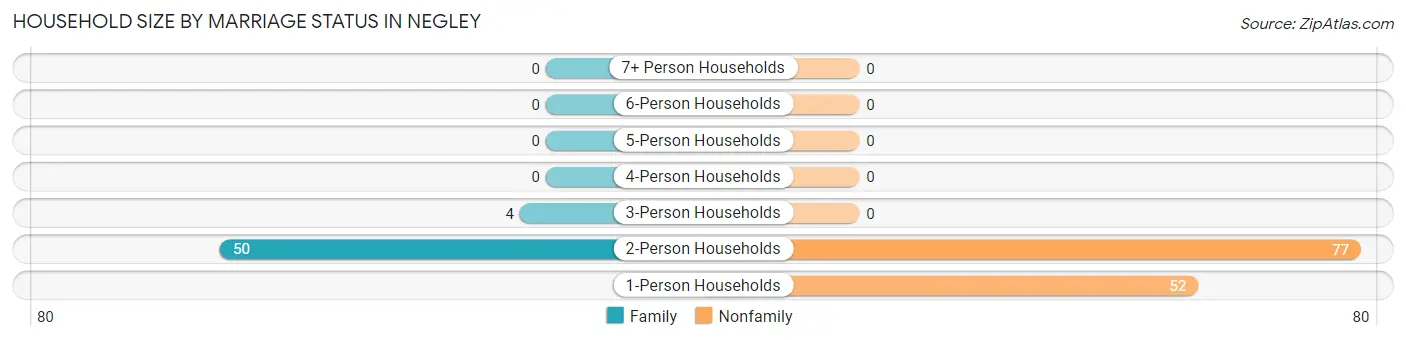
| Household Size | Family Households | Nonfamily Households |
| 1-Person Households | - | 52 (28.4%) |
| 2-Person Households | 50 (27.3%) | 77 (42.1%) |
| 3-Person Households | 4 (2.2%) | 0 (0.0%) |
| 4-Person Households | 0 (0.0%) | 0 (0.0%) |
| 5-Person Households | 0 (0.0%) | 0 (0.0%) |
| 6-Person Households | 0 (0.0%) | 0 (0.0%) |
| 7+ Person Households | 0 (0.0%) | 0 (0.0%) |
| Total | 54 (29.5%) | 129 (70.5%) |
Female Fertility in Negley
Fertility by Age in Negley
| Age Bracket | Women with Births | Births / 1,000 Women |
| 15 to 19 years | 0 (0.0%) | 0.0 |
| 20 to 34 years | 0 (0.0%) | 0.0 |
| 35 to 50 years | 0 (0.0%) | 0.0 |
| Total | 0 (0.0%) | 0.0 |
Fertility by Age by Marriage Status in Negley
| Age Bracket | Married | Unmarried |
| 15 to 19 years | 0 (0.0%) | 0 (0.0%) |
| 20 to 34 years | 0 (0.0%) | 0 (0.0%) |
| 35 to 50 years | 0 (0.0%) | 0 (0.0%) |
| Total | 0 (0.0%) | 0 (0.0%) |
Fertility by Education in Negley
| Educational Attainment | Women with Births | Births / 1,000 Women |
| Less than High School | 0 (0.0%) | 0.0 |
| High School Diploma | 0 (0.0%) | 0.0 |
| College or Associate's Degree | 0 (0.0%) | 0.0 |
| Bachelor's Degree | 0 (0.0%) | 0.0 |
| Graduate Degree | 0 (0.0%) | 0.0 |
| Total | 0 (0.0%) | 0.0 |
Fertility by Education by Marriage Status in Negley
| Educational Attainment | Married | Unmarried |
| Less than High School | 0 (0.0%) | 0 (0.0%) |
| High School Diploma | 0 (0.0%) | 0 (0.0%) |
| College or Associate's Degree | 0 (0.0%) | 0 (0.0%) |
| Bachelor's Degree | 0 (0.0%) | 0 (0.0%) |
| Graduate Degree | 0 (0.0%) | 0 (0.0%) |
| Total | 0 (0.0%) | 0 (0.0%) |
Employment Characteristics in Negley
Employment by Class of Employer in Negley
Among the 216 employed individuals in Negley, private company employees (69 | 31.9%), not-for-profit organizations (66 | 30.6%), and state government employees (38 | 17.6%) make up the most common classes of employment.
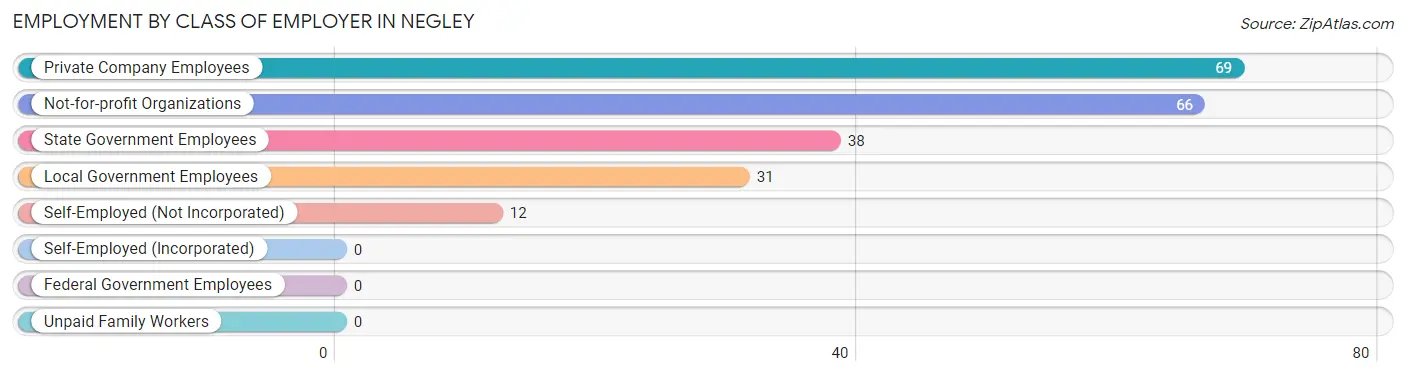
| Employer Class | # Employees | % Employees |
| Private Company Employees | 69 | 31.9% |
| Self-Employed (Incorporated) | 0 | 0.0% |
| Self-Employed (Not Incorporated) | 12 | 5.6% |
| Not-for-profit Organizations | 66 | 30.6% |
| Local Government Employees | 31 | 14.3% |
| State Government Employees | 38 | 17.6% |
| Federal Government Employees | 0 | 0.0% |
| Unpaid Family Workers | 0 | 0.0% |
| Total | 216 | 100.0% |
Employment Status by Age in Negley
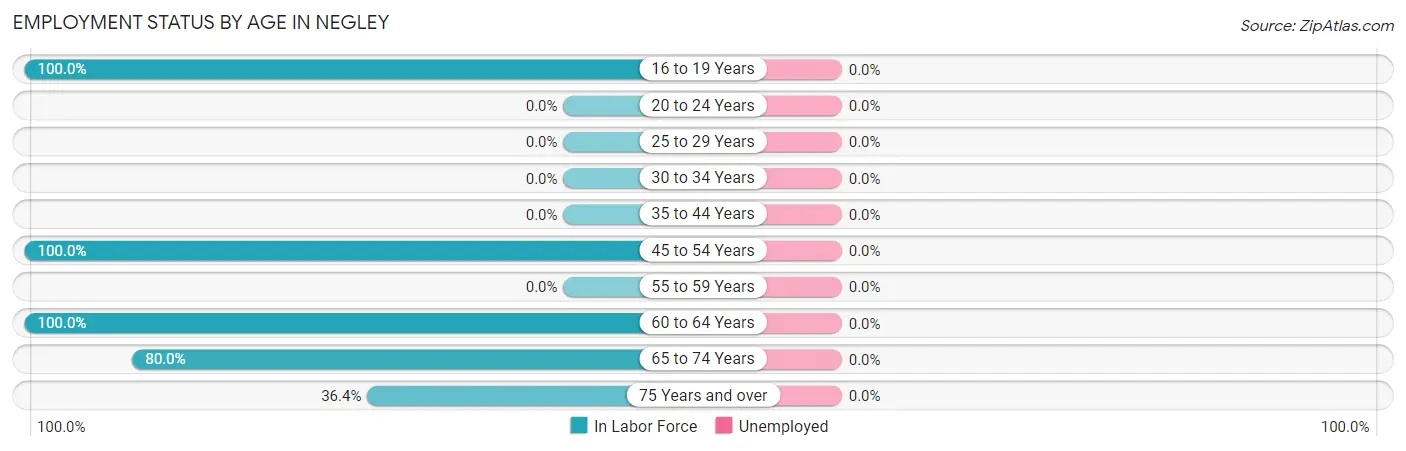
| Age Bracket | In Labor Force | Unemployed |
| 16 to 19 Years | 5 (100.0%) | 0 (0.0%) |
| 20 to 24 Years | 0 (0.0%) | 0 (0.0%) |
| 25 to 29 Years | 0 (0.0%) | 0 (0.0%) |
| 30 to 34 Years | 0 (0.0%) | 0 (0.0%) |
| 35 to 44 Years | 0 (0.0%) | 0 (0.0%) |
| 45 to 54 Years | 38 (100.0%) | 0 (0.0%) |
| 55 to 59 Years | 0 (0.0%) | 0 (0.0%) |
| 60 to 64 Years | 117 (100.0%) | 0 (0.0%) |
| 65 to 74 Years | 44 (80.0%) | 0 (0.0%) |
| 75 Years and over | 12 (36.4%) | 0 (0.0%) |
| Total | 216 (83.1%) | 0 (0.0%) |
Employment Status by Educational Attainment in Negley
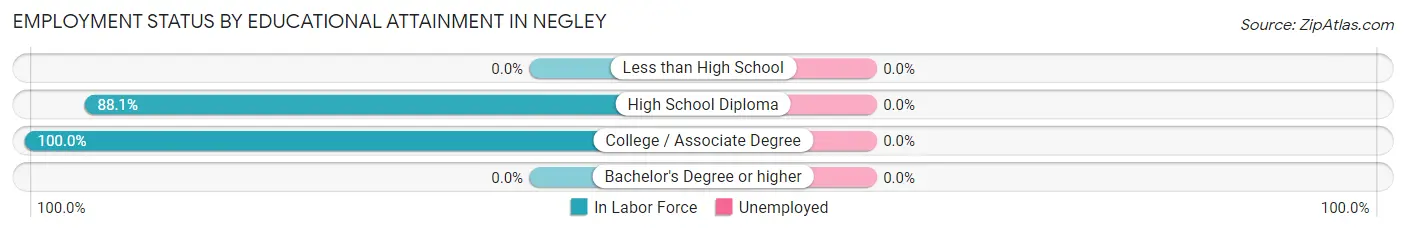
| Educational Attainment | In Labor Force | Unemployed |
| Less than High School | 0 (0.0%) | 0 (0.0%) |
| High School Diploma | 89 (88.1%) | 0 (0.0%) |
| College / Associate Degree | 66 (100.0%) | 0 (0.0%) |
| Bachelor's Degree or higher | 0 (0.0%) | 0 (0.0%) |
| Total | 155 (92.8%) | 0 (0.0%) |
Employment Occupations by Sex in Negley
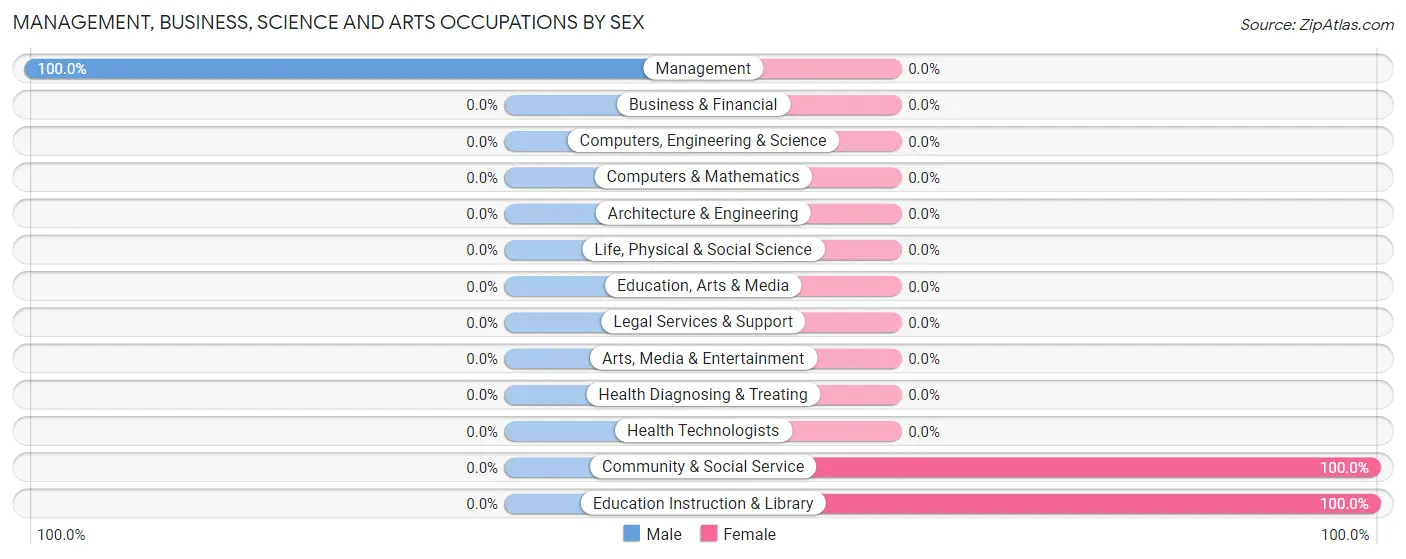
Management, Business, Science and Arts Occupations
The most common Management, Business, Science and Arts occupations in Negley are Community & Social Service (38 | 17.6%), Education Instruction & Library (38 | 17.6%), and Management (31 | 14.3%).
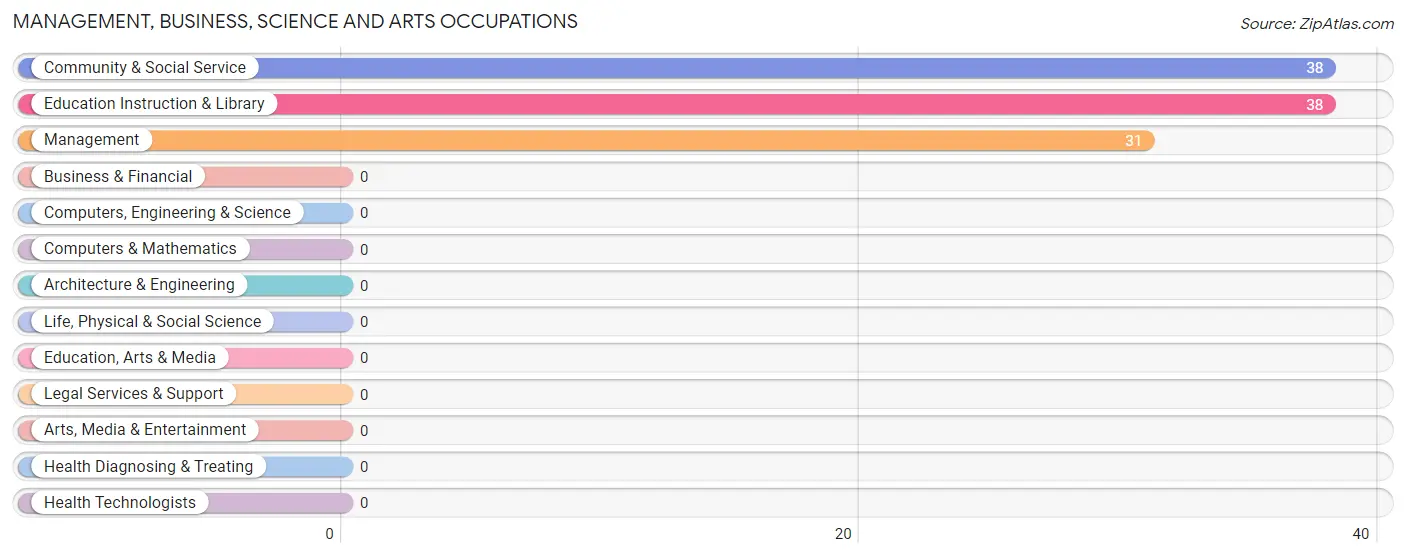
Management, Business, Science and Arts Occupations by Sex
| Occupation | Male | Female |
| Management | 31 (100.0%) | 0 (0.0%) |
| Business & Financial | 0 (0.0%) | 0 (0.0%) |
| Computers, Engineering & Science | 0 (0.0%) | 0 (0.0%) |
| Computers & Mathematics | 0 (0.0%) | 0 (0.0%) |
| Architecture & Engineering | 0 (0.0%) | 0 (0.0%) |
| Life, Physical & Social Science | 0 (0.0%) | 0 (0.0%) |
| Community & Social Service | 0 (0.0%) | 38 (100.0%) |
| Education, Arts & Media | 0 (0.0%) | 0 (0.0%) |
| Legal Services & Support | 0 (0.0%) | 0 (0.0%) |
| Education Instruction & Library | 0 (0.0%) | 38 (100.0%) |
| Arts, Media & Entertainment | 0 (0.0%) | 0 (0.0%) |
| Health Diagnosing & Treating | 0 (0.0%) | 0 (0.0%) |
| Health Technologists | 0 (0.0%) | 0 (0.0%) |
| Total (Category) | 31 (44.9%) | 38 (55.1%) |
| Total (Overall) | 87 (40.3%) | 129 (59.7%) |
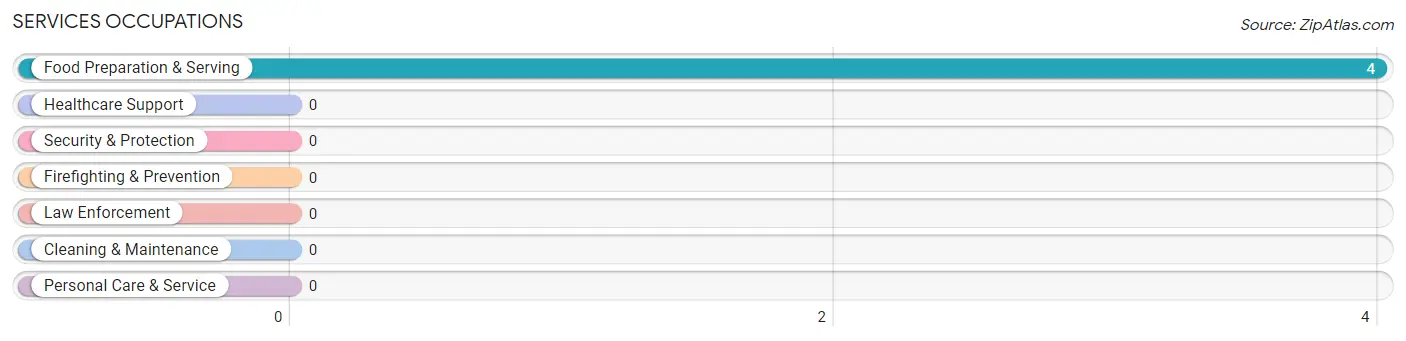
Services Occupations
The most common Services occupations in Negley are , and Food Preparation & Serving (4 | 1.8%).
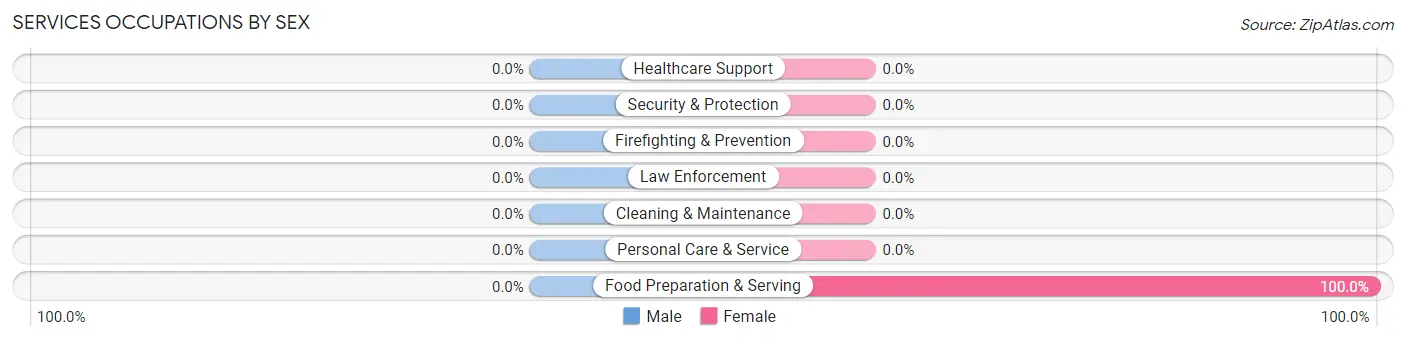
Services Occupations by Sex
| Occupation | Male | Female |
| Healthcare Support | 0 (0.0%) | 0 (0.0%) |
| Security & Protection | 0 (0.0%) | 0 (0.0%) |
| Firefighting & Prevention | 0 (0.0%) | 0 (0.0%) |
| Law Enforcement | 0 (0.0%) | 0 (0.0%) |
| Food Preparation & Serving | 0 (0.0%) | 4 (100.0%) |
| Cleaning & Maintenance | 0 (0.0%) | 0 (0.0%) |
| Personal Care & Service | 0 (0.0%) | 0 (0.0%) |
| Total (Category) | 0 (0.0%) | 4 (100.0%) |
| Total (Overall) | 87 (40.3%) | 129 (59.7%) |
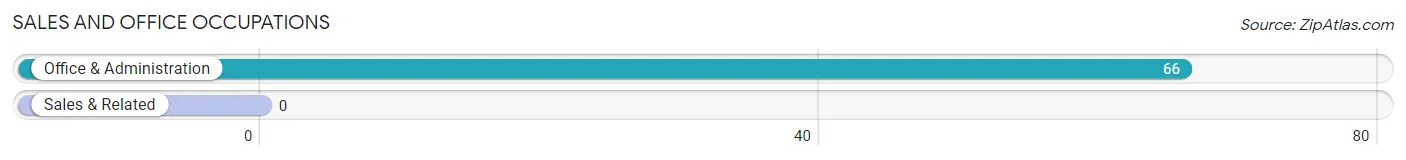
Sales and Office Occupations
The most common Sales and Office occupations in Negley are , and Office & Administration (66 | 30.6%).
Sales and Office Occupations by Sex
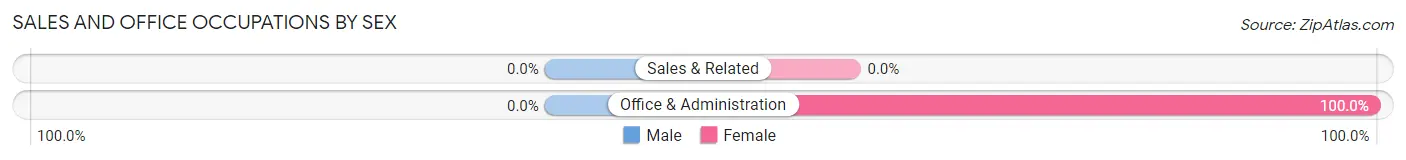
| Occupation | Male | Female |
| Sales & Related | 0 (0.0%) | 0 (0.0%) |
| Office & Administration | 0 (0.0%) | 66 (100.0%) |
| Total (Category) | 0 (0.0%) | 66 (100.0%) |
| Total (Overall) | 87 (40.3%) | 129 (59.7%) |
Natural Resources, Construction and Maintenance Occupations
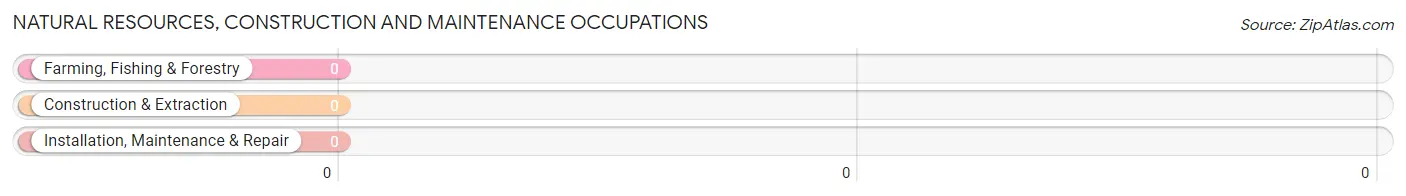
Natural Resources, Construction and Maintenance Occupations by Sex
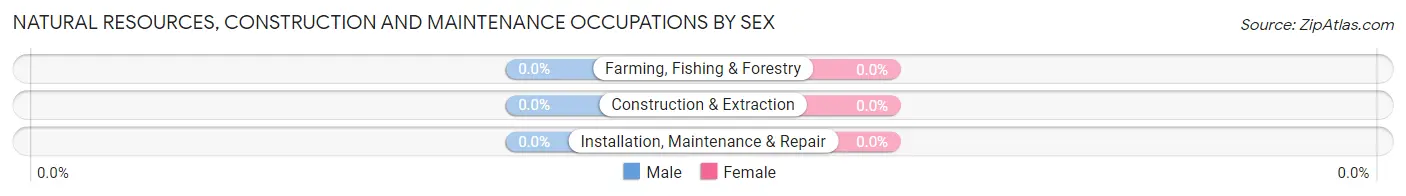
| Occupation | Male | Female |
| Farming, Fishing & Forestry | 0 (0.0%) | 0 (0.0%) |
| Construction & Extraction | 0 (0.0%) | 0 (0.0%) |
| Installation, Maintenance & Repair | 0 (0.0%) | 0 (0.0%) |
| Total (Category) | 0 (0.0%) | 0 (0.0%) |
| Total (Overall) | 87 (40.3%) | 129 (59.7%) |
Production, Transportation and Moving Occupations
The most common Production, Transportation and Moving occupations in Negley are Transportation (52 | 24.1%), and Production (25 | 11.6%).
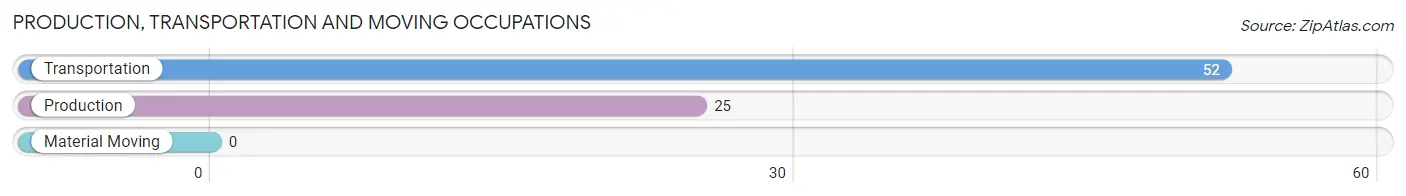
Production, Transportation and Moving Occupations by Sex
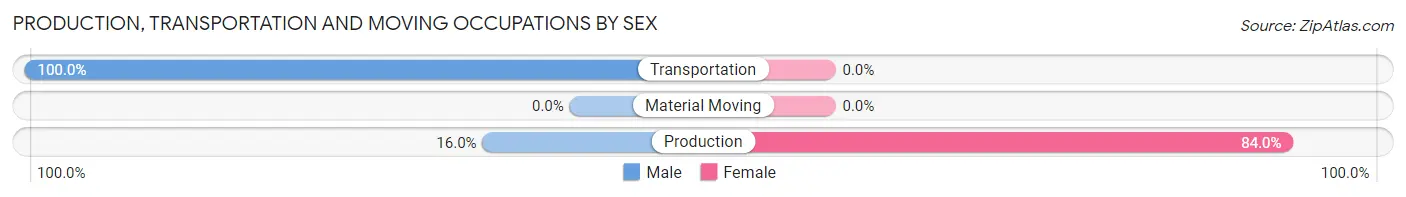
| Occupation | Male | Female |
| Production | 4 (16.0%) | 21 (84.0%) |
| Transportation | 52 (100.0%) | 0 (0.0%) |
| Material Moving | 0 (0.0%) | 0 (0.0%) |
| Total (Category) | 56 (72.7%) | 21 (27.3%) |
| Total (Overall) | 87 (40.3%) | 129 (59.7%) |
Employment Industries by Sex in Negley
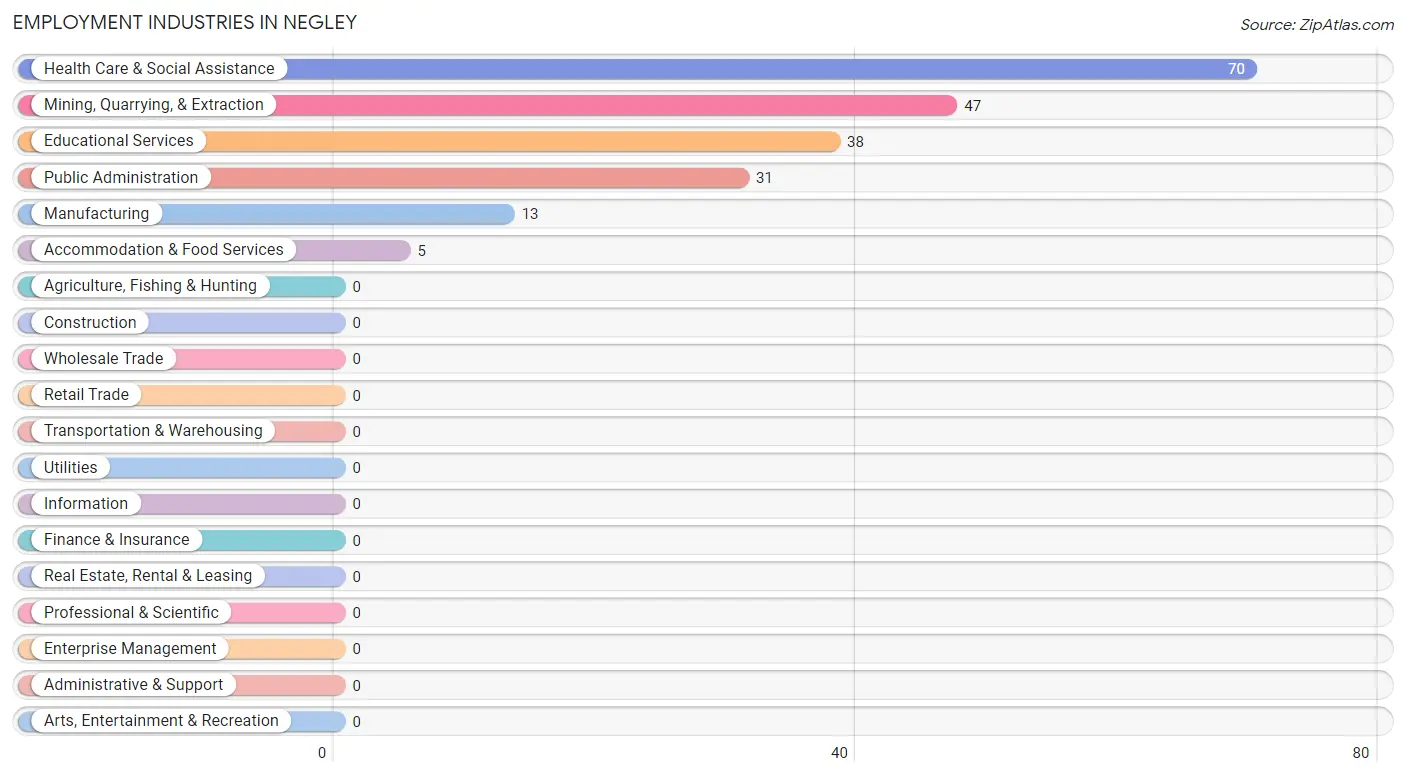
Employment Industries in Negley
The major employment industries in Negley include Health Care & Social Assistance (70 | 32.4%), Mining, Quarrying, & Extraction (47 | 21.8%), Educational Services (38 | 17.6%), Public Administration (31 | 14.3%), and Manufacturing (13 | 6.0%).
Employment Industries by Sex in Negley
The Negley industries that see more men than women are Mining, Quarrying, & Extraction (100.0%), Accommodation & Food Services (100.0%), and Public Administration (100.0%), whereas the industries that tend to have a higher number of women are Educational Services (100.0%), Health Care & Social Assistance (100.0%), and Manufacturing (69.2%).
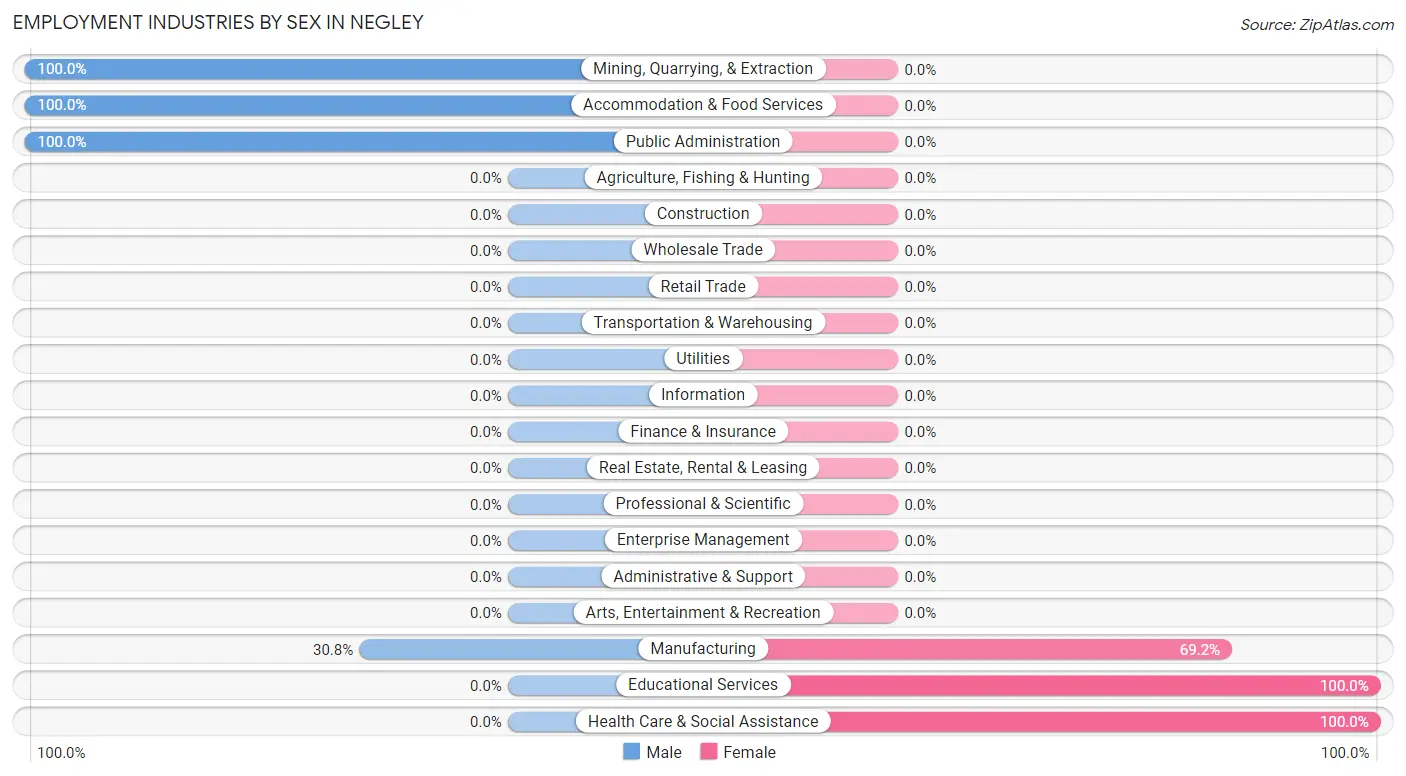
| Industry | Male | Female |
| Agriculture, Fishing & Hunting | 0 (0.0%) | 0 (0.0%) |
| Mining, Quarrying, & Extraction | 47 (100.0%) | 0 (0.0%) |
| Construction | 0 (0.0%) | 0 (0.0%) |
| Manufacturing | 4 (30.8%) | 9 (69.2%) |
| Wholesale Trade | 0 (0.0%) | 0 (0.0%) |
| Retail Trade | 0 (0.0%) | 0 (0.0%) |
| Transportation & Warehousing | 0 (0.0%) | 0 (0.0%) |
| Utilities | 0 (0.0%) | 0 (0.0%) |
| Information | 0 (0.0%) | 0 (0.0%) |
| Finance & Insurance | 0 (0.0%) | 0 (0.0%) |
| Real Estate, Rental & Leasing | 0 (0.0%) | 0 (0.0%) |
| Professional & Scientific | 0 (0.0%) | 0 (0.0%) |
| Enterprise Management | 0 (0.0%) | 0 (0.0%) |
| Administrative & Support | 0 (0.0%) | 0 (0.0%) |
| Educational Services | 0 (0.0%) | 38 (100.0%) |
| Health Care & Social Assistance | 0 (0.0%) | 70 (100.0%) |
| Arts, Entertainment & Recreation | 0 (0.0%) | 0 (0.0%) |
| Accommodation & Food Services | 5 (100.0%) | 0 (0.0%) |
| Public Administration | 31 (100.0%) | 0 (0.0%) |
| Total | 87 (40.3%) | 129 (59.7%) |
Education in Negley
School Enrollment in Negley
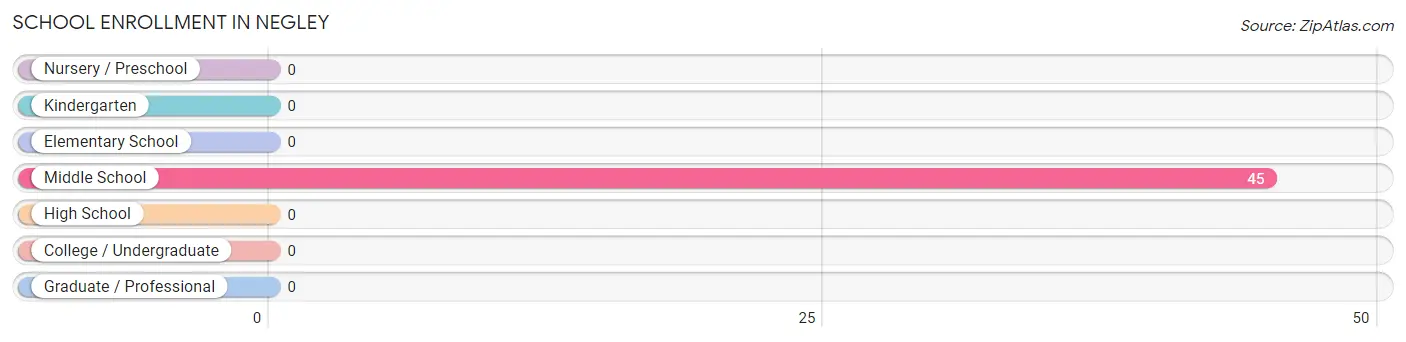
| School Level | # Students | % Students |
| Nursery / Preschool | 0 | 0.0% |
| Kindergarten | 0 | 0.0% |
| Elementary School | 0 | 0.0% |
| Middle School | 45 | 100.0% |
| High School | 0 | 0.0% |
| College / Undergraduate | 0 | 0.0% |
| Graduate / Professional | 0 | 0.0% |
| Total | 45 | 100.0% |
School Enrollment by Age by Funding Source in Negley
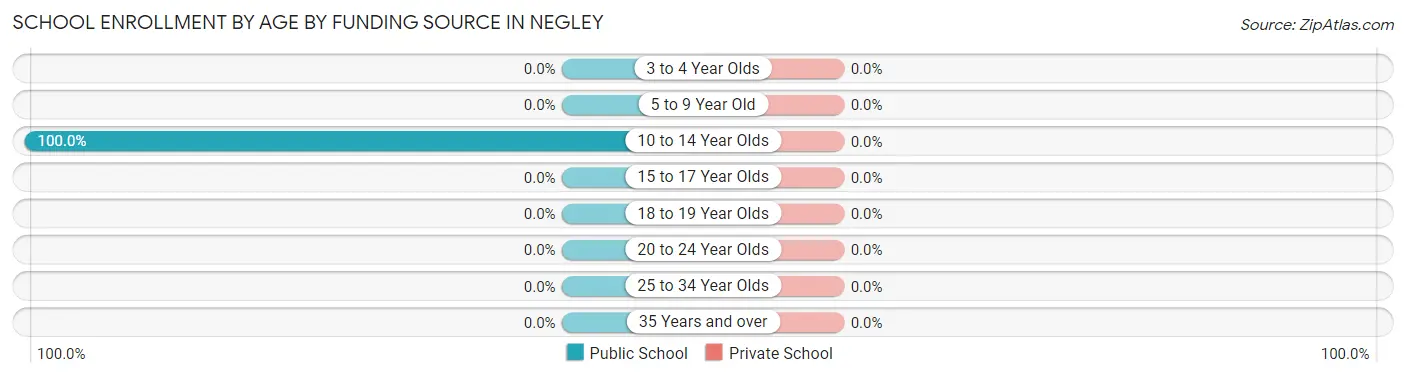
| Age Bracket | Public School | Private School |
| 3 to 4 Year Olds | 0 (0.0%) | 0 (0.0%) |
| 5 to 9 Year Old | 0 (0.0%) | 0 (0.0%) |
| 10 to 14 Year Olds | 45 (100.0%) | 0 (0.0%) |
| 15 to 17 Year Olds | 0 (0.0%) | 0 (0.0%) |
| 18 to 19 Year Olds | 0 (0.0%) | 0 (0.0%) |
| 20 to 24 Year Olds | 0 (0.0%) | 0 (0.0%) |
| 25 to 34 Year Olds | 0 (0.0%) | 0 (0.0%) |
| 35 Years and over | 0 (0.0%) | 0 (0.0%) |
| Total | 45 (100.0%) | 0 (0.0%) |
Educational Attainment by Field of Study in Negley
| Field of Study | # Graduates | % Graduates |
| Computers & Mathematics | 0 | 0.0% |
| Bio, Nature & Agricultural | 0 | 0.0% |
| Physical & Health Sciences | 0 | 0.0% |
| Psychology | 0 | 0.0% |
| Social Sciences | 0 | 0.0% |
| Engineering | 0 | 0.0% |
| Multidisciplinary Studies | 0 | 0.0% |
| Science & Technology | 0 | 0.0% |
| Business | 0 | 0.0% |
| Education | 0 | 0.0% |
| Literature & Languages | 0 | 0.0% |
| Liberal Arts & History | 0 | 0.0% |
| Visual & Performing Arts | 0 | 0.0% |
| Communications | 0 | 0.0% |
| Arts & Humanities | 0 | 0.0% |
| Total | 0 | 0.0% |
Transportation & Commute in Negley
Vehicle Availability by Sex in Negley
The most prevalent vehicle ownership categories in Negley are males with 2 vehicles (56, accounting for 64.4%) and females with 2 vehicles (70, making up 43.4%).
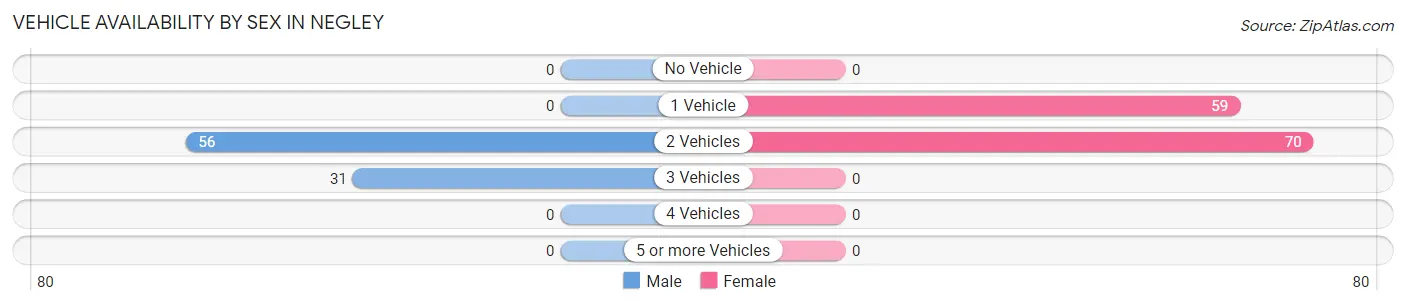
| Vehicles Available | Male | Female |
| No Vehicle | 0 (0.0%) | 0 (0.0%) |
| 1 Vehicle | 0 (0.0%) | 59 (45.7%) |
| 2 Vehicles | 56 (64.4%) | 70 (54.3%) |
| 3 Vehicles | 31 (35.6%) | 0 (0.0%) |
| 4 Vehicles | 0 (0.0%) | 0 (0.0%) |
| 5 or more Vehicles | 0 (0.0%) | 0 (0.0%) |
| Total | 87 (100.0%) | 129 (100.0%) |
Commute Time in Negley
The most frequently occuring commute durations in Negley are 20 to 24 minutes (70 commuters, 34.3%), less than 5 minutes (69 commuters, 33.8%), and 35 to 39 minutes (56 commuters, 27.5%).
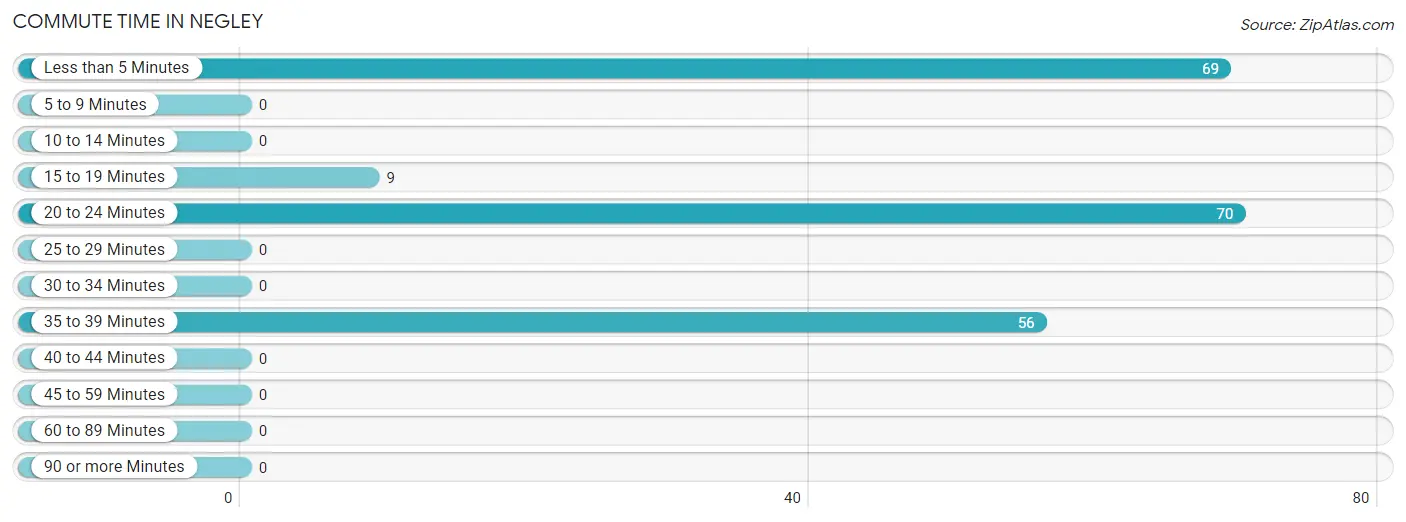
| Commute Time | # Commuters | % Commuters |
| Less than 5 Minutes | 69 | 33.8% |
| 5 to 9 Minutes | 0 | 0.0% |
| 10 to 14 Minutes | 0 | 0.0% |
| 15 to 19 Minutes | 9 | 4.4% |
| 20 to 24 Minutes | 70 | 34.3% |
| 25 to 29 Minutes | 0 | 0.0% |
| 30 to 34 Minutes | 0 | 0.0% |
| 35 to 39 Minutes | 56 | 27.5% |
| 40 to 44 Minutes | 0 | 0.0% |
| 45 to 59 Minutes | 0 | 0.0% |
| 60 to 89 Minutes | 0 | 0.0% |
| 90 or more Minutes | 0 | 0.0% |
Commute Time by Sex in Negley
The most common commute times in Negley are 35 to 39 minutes (47 commuters, 54.0%) for males and 20 to 24 minutes (66 commuters, 56.4%) for females.
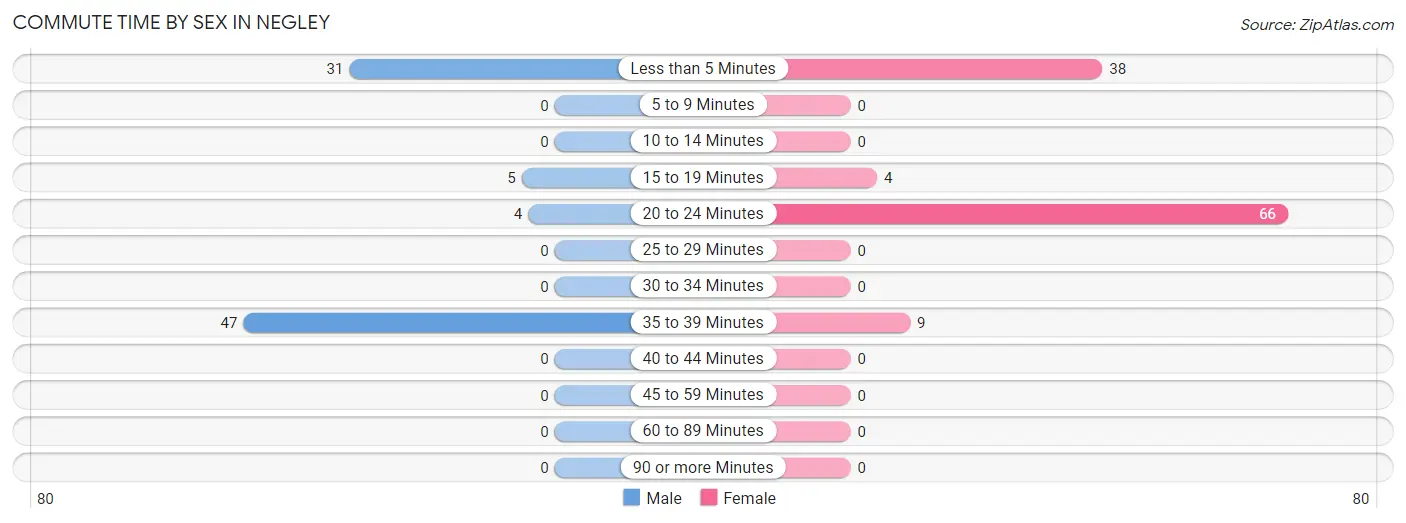
| Commute Time | Male | Female |
| Less than 5 Minutes | 31 (35.6%) | 38 (32.5%) |
| 5 to 9 Minutes | 0 (0.0%) | 0 (0.0%) |
| 10 to 14 Minutes | 0 (0.0%) | 0 (0.0%) |
| 15 to 19 Minutes | 5 (5.8%) | 4 (3.4%) |
| 20 to 24 Minutes | 4 (4.6%) | 66 (56.4%) |
| 25 to 29 Minutes | 0 (0.0%) | 0 (0.0%) |
| 30 to 34 Minutes | 0 (0.0%) | 0 (0.0%) |
| 35 to 39 Minutes | 47 (54.0%) | 9 (7.7%) |
| 40 to 44 Minutes | 0 (0.0%) | 0 (0.0%) |
| 45 to 59 Minutes | 0 (0.0%) | 0 (0.0%) |
| 60 to 89 Minutes | 0 (0.0%) | 0 (0.0%) |
| 90 or more Minutes | 0 (0.0%) | 0 (0.0%) |
Time of Departure to Work by Sex in Negley
The most frequent times of departure to work in Negley are 5:30 AM to 5:59 AM (47, 54.0%) for males and 5:30 AM to 5:59 AM (66, 56.4%) for females.
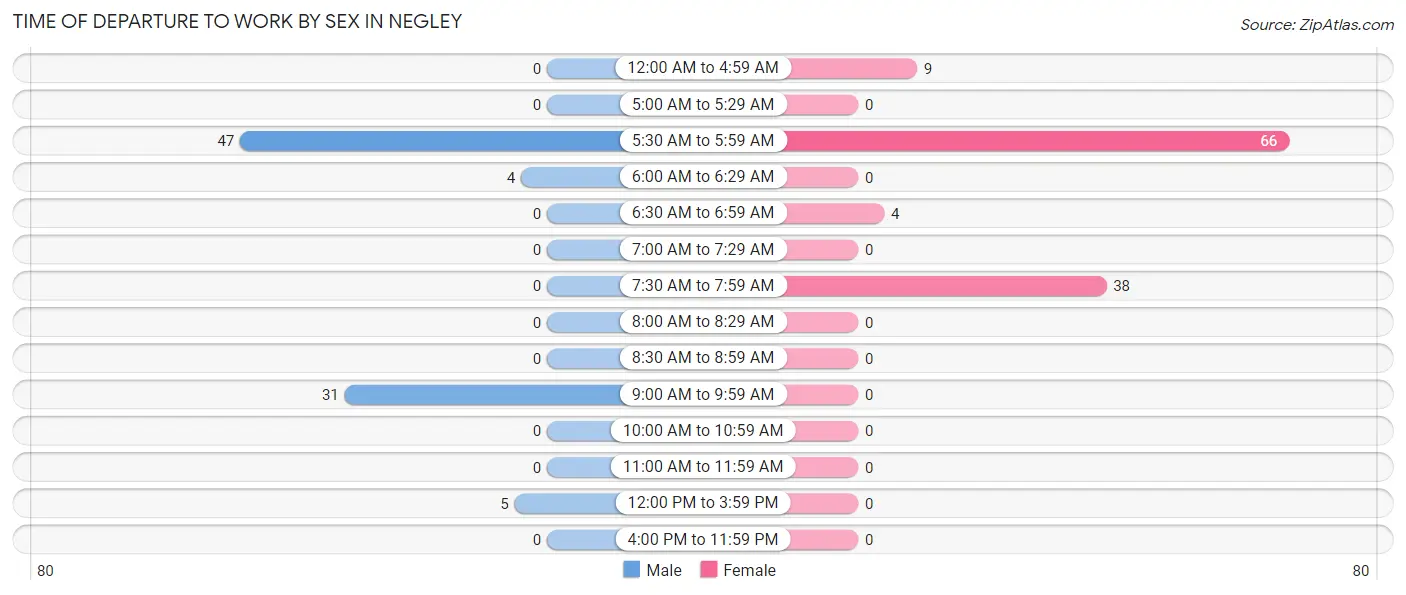
| Time of Departure | Male | Female |
| 12:00 AM to 4:59 AM | 0 (0.0%) | 9 (7.7%) |
| 5:00 AM to 5:29 AM | 0 (0.0%) | 0 (0.0%) |
| 5:30 AM to 5:59 AM | 47 (54.0%) | 66 (56.4%) |
| 6:00 AM to 6:29 AM | 4 (4.6%) | 0 (0.0%) |
| 6:30 AM to 6:59 AM | 0 (0.0%) | 4 (3.4%) |
| 7:00 AM to 7:29 AM | 0 (0.0%) | 0 (0.0%) |
| 7:30 AM to 7:59 AM | 0 (0.0%) | 38 (32.5%) |
| 8:00 AM to 8:29 AM | 0 (0.0%) | 0 (0.0%) |
| 8:30 AM to 8:59 AM | 0 (0.0%) | 0 (0.0%) |
| 9:00 AM to 9:59 AM | 31 (35.6%) | 0 (0.0%) |
| 10:00 AM to 10:59 AM | 0 (0.0%) | 0 (0.0%) |
| 11:00 AM to 11:59 AM | 0 (0.0%) | 0 (0.0%) |
| 12:00 PM to 3:59 PM | 5 (5.8%) | 0 (0.0%) |
| 4:00 PM to 11:59 PM | 0 (0.0%) | 0 (0.0%) |
| Total | 87 (100.0%) | 117 (100.0%) |
Housing Occupancy in Negley
Occupancy by Ownership in Negley
Of the total 183 dwellings in Negley, owner-occupied units account for 172 (94.0%), while renter-occupied units make up 11 (6.0%).
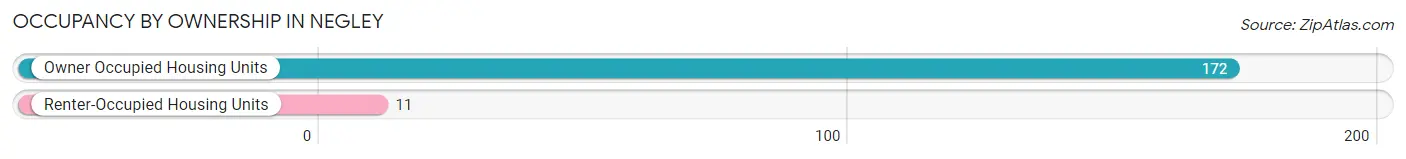
| Occupancy | # Housing Units | % Housing Units |
| Owner Occupied Housing Units | 172 | 94.0% |
| Renter-Occupied Housing Units | 11 | 6.0% |
| Total Occupied Housing Units | 183 | 100.0% |
Occupancy by Household Size in Negley
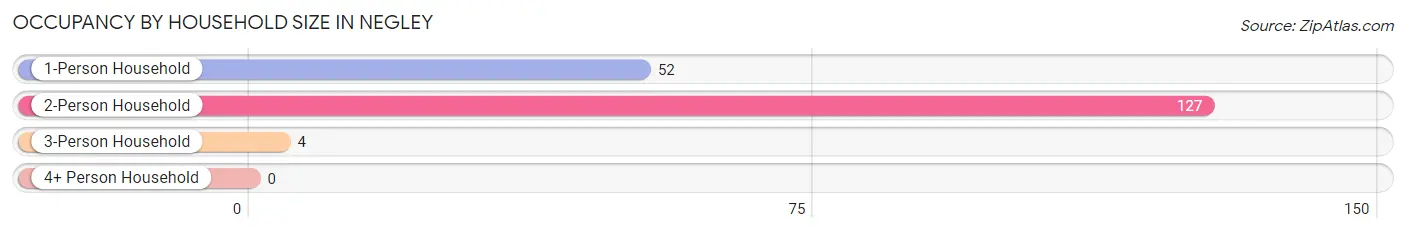
| Household Size | # Housing Units | % Housing Units |
| 1-Person Household | 52 | 28.4% |
| 2-Person Household | 127 | 69.4% |
| 3-Person Household | 4 | 2.2% |
| 4+ Person Household | 0 | 0.0% |
| Total Housing Units | 183 | 100.0% |
Occupancy by Ownership by Household Size in Negley
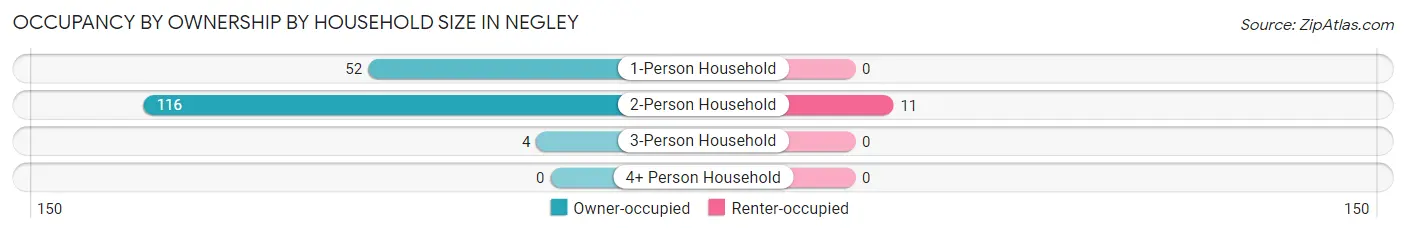
| Household Size | Owner-occupied | Renter-occupied |
| 1-Person Household | 52 (100.0%) | 0 (0.0%) |
| 2-Person Household | 116 (91.3%) | 11 (8.7%) |
| 3-Person Household | 4 (100.0%) | 0 (0.0%) |
| 4+ Person Household | 0 (0.0%) | 0 (0.0%) |
| Total Housing Units | 172 (94.0%) | 11 (6.0%) |
Occupancy by Educational Attainment in Negley
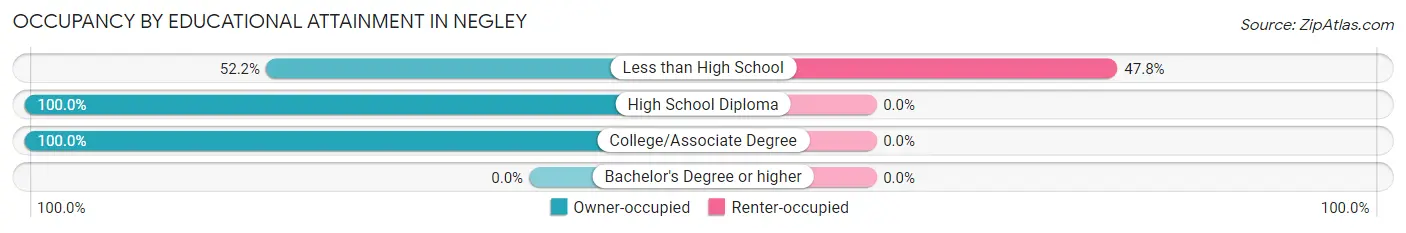
| Household Size | Owner-occupied | Renter-occupied |
| Less than High School | 12 (52.2%) | 11 (47.8%) |
| High School Diploma | 94 (100.0%) | 0 (0.0%) |
| College/Associate Degree | 66 (100.0%) | 0 (0.0%) |
| Bachelor's Degree or higher | 0 (0.0%) | 0 (0.0%) |
Occupancy by Age of Householder in Negley
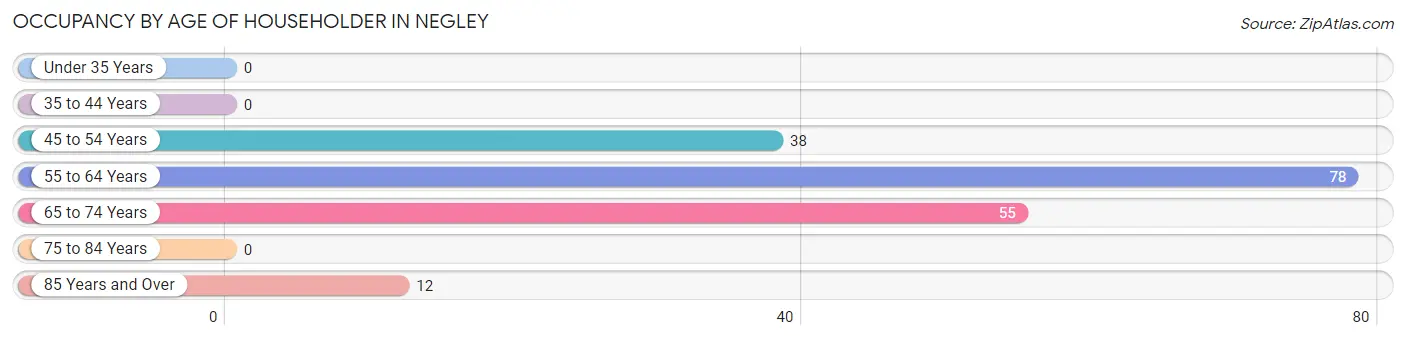
| Age Bracket | # Households | % Households |
| Under 35 Years | 0 | 0.0% |
| 35 to 44 Years | 0 | 0.0% |
| 45 to 54 Years | 38 | 20.8% |
| 55 to 64 Years | 78 | 42.6% |
| 65 to 74 Years | 55 | 30.0% |
| 75 to 84 Years | 0 | 0.0% |
| 85 Years and Over | 12 | 6.6% |
| Total | 183 | 100.0% |
Housing Finances in Negley
Median Income by Occupancy in Negley
| Occupancy Type | # Households | Median Income |
| Owner-Occupied | 172 (94.0%) | $0 |
| Renter-Occupied | 11 (6.0%) | $0 |
| Average | 183 (100.0%) | $0 |
Occupancy by Householder Income Bracket in Negley
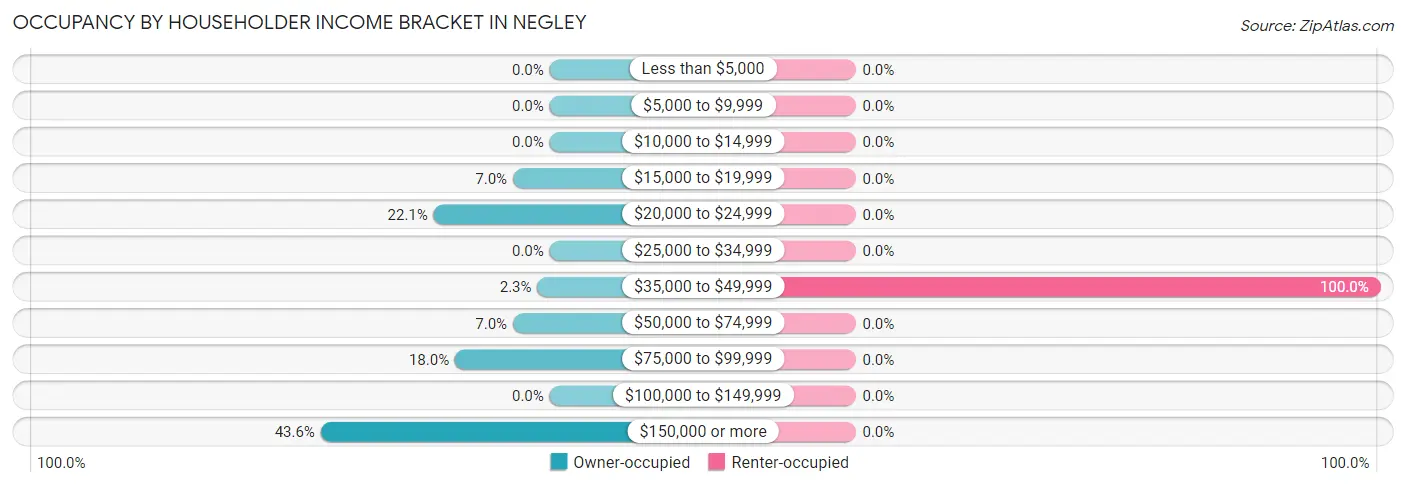
| Income Bracket | Owner-occupied | Renter-occupied |
| Less than $5,000 | 0 (0.0%) | 0 (0.0%) |
| $5,000 to $9,999 | 0 (0.0%) | 0 (0.0%) |
| $10,000 to $14,999 | 0 (0.0%) | 0 (0.0%) |
| $15,000 to $19,999 | 12 (7.0%) | 0 (0.0%) |
| $20,000 to $24,999 | 38 (22.1%) | 0 (0.0%) |
| $25,000 to $34,999 | 0 (0.0%) | 0 (0.0%) |
| $35,000 to $49,999 | 4 (2.3%) | 11 (100.0%) |
| $50,000 to $74,999 | 12 (7.0%) | 0 (0.0%) |
| $75,000 to $99,999 | 31 (18.0%) | 0 (0.0%) |
| $100,000 to $149,999 | 0 (0.0%) | 0 (0.0%) |
| $150,000 or more | 75 (43.6%) | 0 (0.0%) |
| Total | 172 (100.0%) | 11 (100.0%) |
Monthly Housing Cost Tiers in Negley
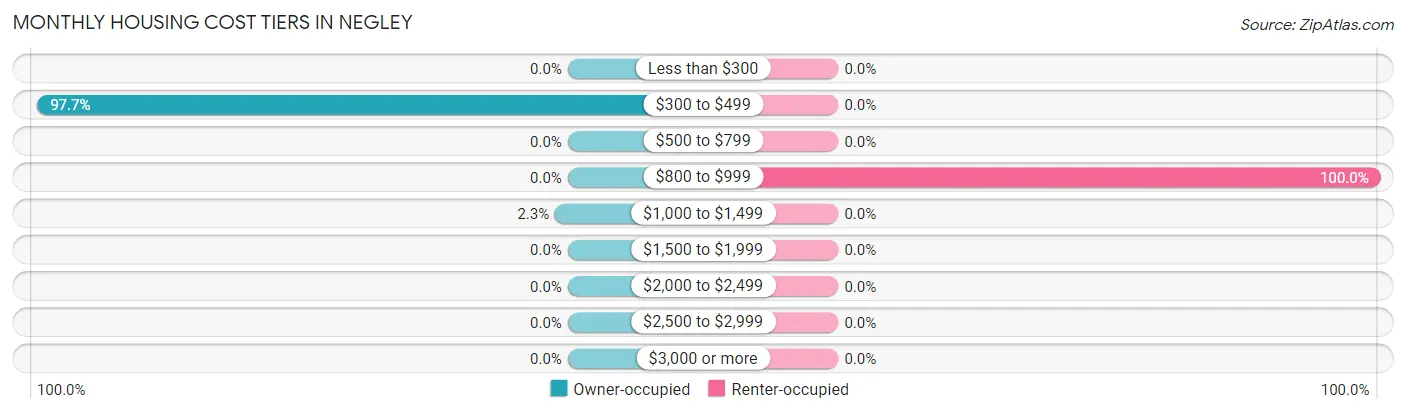
| Monthly Cost | Owner-occupied | Renter-occupied |
| Less than $300 | 0 (0.0%) | 0 (0.0%) |
| $300 to $499 | 168 (97.7%) | 0 (0.0%) |
| $500 to $799 | 0 (0.0%) | 0 (0.0%) |
| $800 to $999 | 0 (0.0%) | 11 (100.0%) |
| $1,000 to $1,499 | 4 (2.3%) | 0 (0.0%) |
| $1,500 to $1,999 | 0 (0.0%) | 0 (0.0%) |
| $2,000 to $2,499 | 0 (0.0%) | 0 (0.0%) |
| $2,500 to $2,999 | 0 (0.0%) | 0 (0.0%) |
| $3,000 or more | 0 (0.0%) | 0 (0.0%) |
| Total | 172 (100.0%) | 11 (100.0%) |
Physical Housing Characteristics in Negley
Housing Structures in Negley
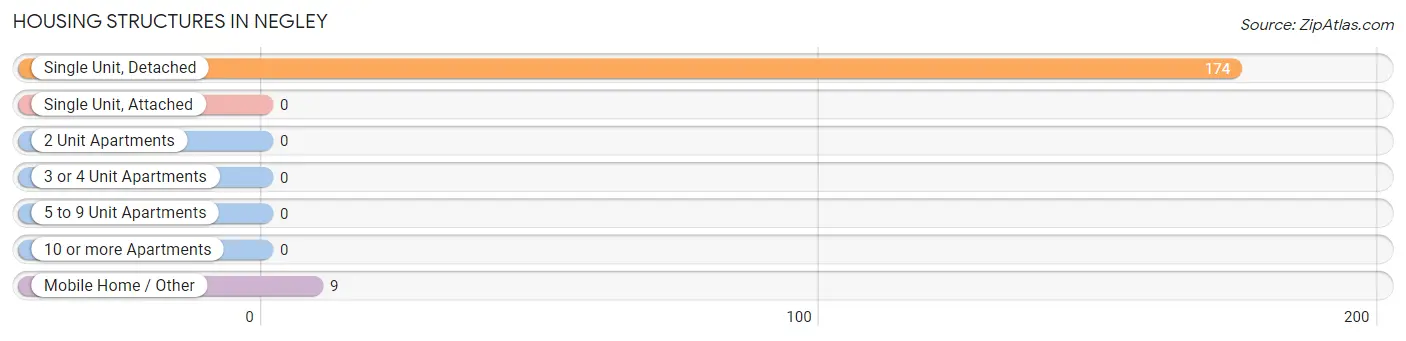
| Structure Type | # Housing Units | % Housing Units |
| Single Unit, Detached | 174 | 95.1% |
| Single Unit, Attached | 0 | 0.0% |
| 2 Unit Apartments | 0 | 0.0% |
| 3 or 4 Unit Apartments | 0 | 0.0% |
| 5 to 9 Unit Apartments | 0 | 0.0% |
| 10 or more Apartments | 0 | 0.0% |
| Mobile Home / Other | 9 | 4.9% |
| Total | 183 | 100.0% |
Housing Structures by Occupancy in Negley
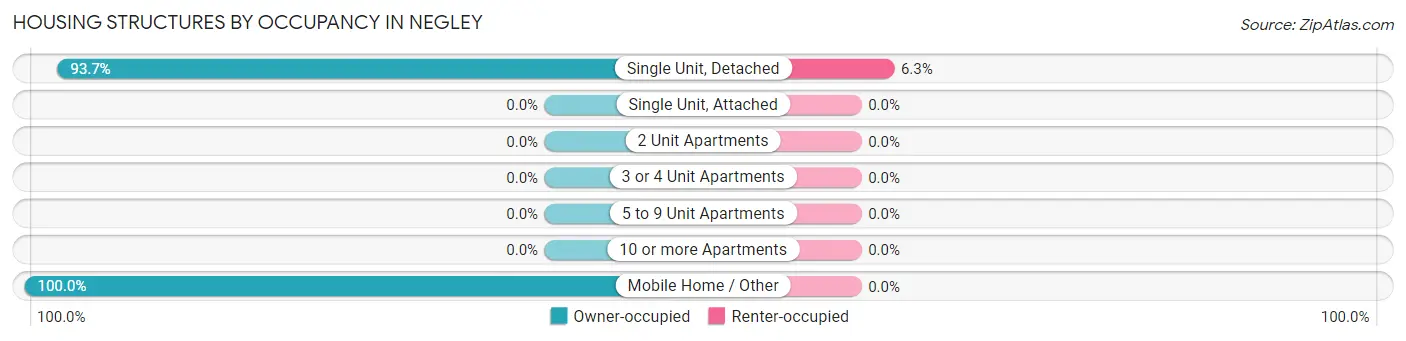
| Structure Type | Owner-occupied | Renter-occupied |
| Single Unit, Detached | 163 (93.7%) | 11 (6.3%) |
| Single Unit, Attached | 0 (0.0%) | 0 (0.0%) |
| 2 Unit Apartments | 0 (0.0%) | 0 (0.0%) |
| 3 or 4 Unit Apartments | 0 (0.0%) | 0 (0.0%) |
| 5 to 9 Unit Apartments | 0 (0.0%) | 0 (0.0%) |
| 10 or more Apartments | 0 (0.0%) | 0 (0.0%) |
| Mobile Home / Other | 9 (100.0%) | 0 (0.0%) |
| Total | 172 (94.0%) | 11 (6.0%) |
Housing Structures by Number of Rooms in Negley
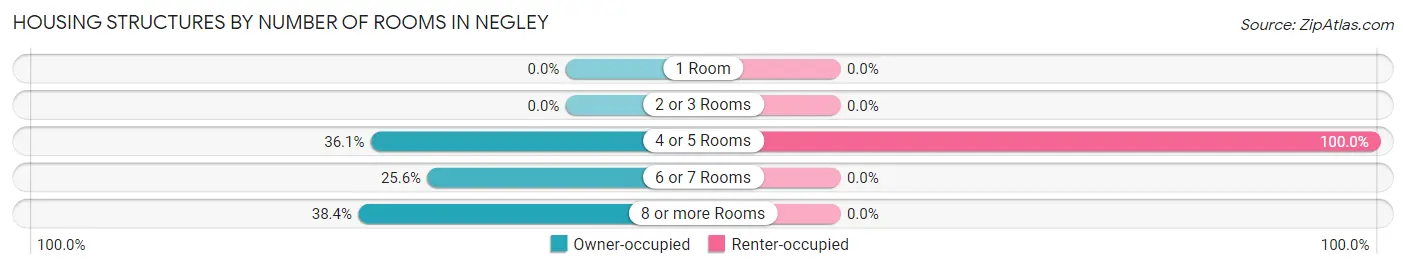
| Number of Rooms | Owner-occupied | Renter-occupied |
| 1 Room | 0 (0.0%) | 0 (0.0%) |
| 2 or 3 Rooms | 0 (0.0%) | 0 (0.0%) |
| 4 or 5 Rooms | 62 (36.0%) | 11 (100.0%) |
| 6 or 7 Rooms | 44 (25.6%) | 0 (0.0%) |
| 8 or more Rooms | 66 (38.4%) | 0 (0.0%) |
| Total | 172 (100.0%) | 11 (100.0%) |
Housing Structure by Heating Type in Negley
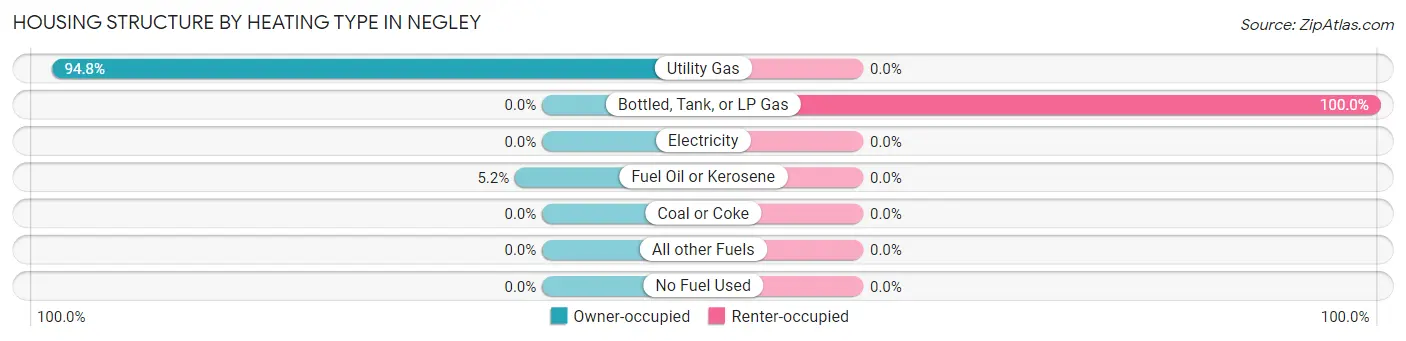
| Heating Type | Owner-occupied | Renter-occupied |
| Utility Gas | 163 (94.8%) | 0 (0.0%) |
| Bottled, Tank, or LP Gas | 0 (0.0%) | 11 (100.0%) |
| Electricity | 0 (0.0%) | 0 (0.0%) |
| Fuel Oil or Kerosene | 9 (5.2%) | 0 (0.0%) |
| Coal or Coke | 0 (0.0%) | 0 (0.0%) |
| All other Fuels | 0 (0.0%) | 0 (0.0%) |
| No Fuel Used | 0 (0.0%) | 0 (0.0%) |
| Total | 172 (100.0%) | 11 (100.0%) |
Household Vehicle Usage in Negley
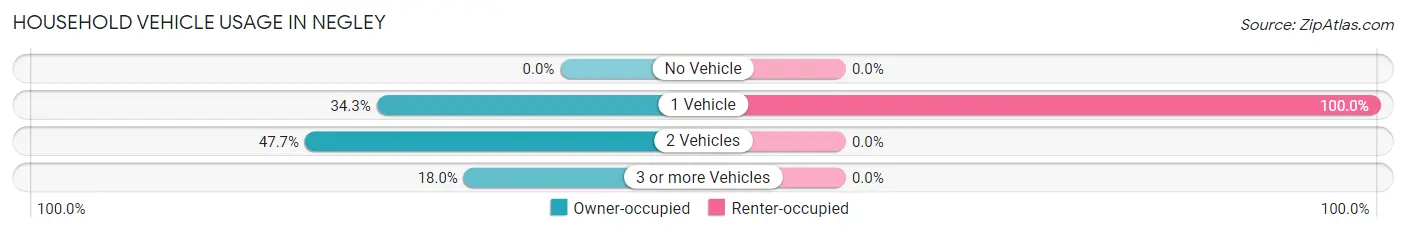
| Vehicles per Household | Owner-occupied | Renter-occupied |
| No Vehicle | 0 (0.0%) | 0 (0.0%) |
| 1 Vehicle | 59 (34.3%) | 11 (100.0%) |
| 2 Vehicles | 82 (47.7%) | 0 (0.0%) |
| 3 or more Vehicles | 31 (18.0%) | 0 (0.0%) |
| Total | 172 (100.0%) | 11 (100.0%) |
Real Estate & Mortgages in Negley
Real Estate and Mortgage Overview in Negley
| Characteristic | Without Mortgage | With Mortgage |
| Housing Units | 168 | 4 |
| Median Property Value | $78,600 | $0 |
| Median Household Income | - | - |
| Monthly Housing Costs | $339 | $0 |
| Real Estate Taxes | $669 | $0 |
Property Value by Mortgage Status in Negley
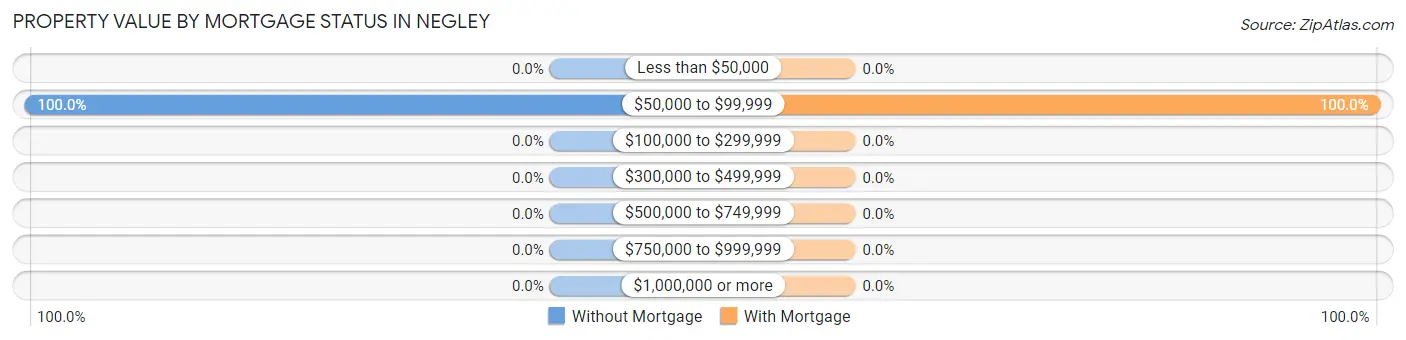
| Property Value | Without Mortgage | With Mortgage |
| Less than $50,000 | 0 (0.0%) | 0 (0.0%) |
| $50,000 to $99,999 | 168 (100.0%) | 4 (100.0%) |
| $100,000 to $299,999 | 0 (0.0%) | 0 (0.0%) |
| $300,000 to $499,999 | 0 (0.0%) | 0 (0.0%) |
| $500,000 to $749,999 | 0 (0.0%) | 0 (0.0%) |
| $750,000 to $999,999 | 0 (0.0%) | 0 (0.0%) |
| $1,000,000 or more | 0 (0.0%) | 0 (0.0%) |
| Total | 168 (100.0%) | 4 (100.0%) |
Household Income by Mortgage Status in Negley
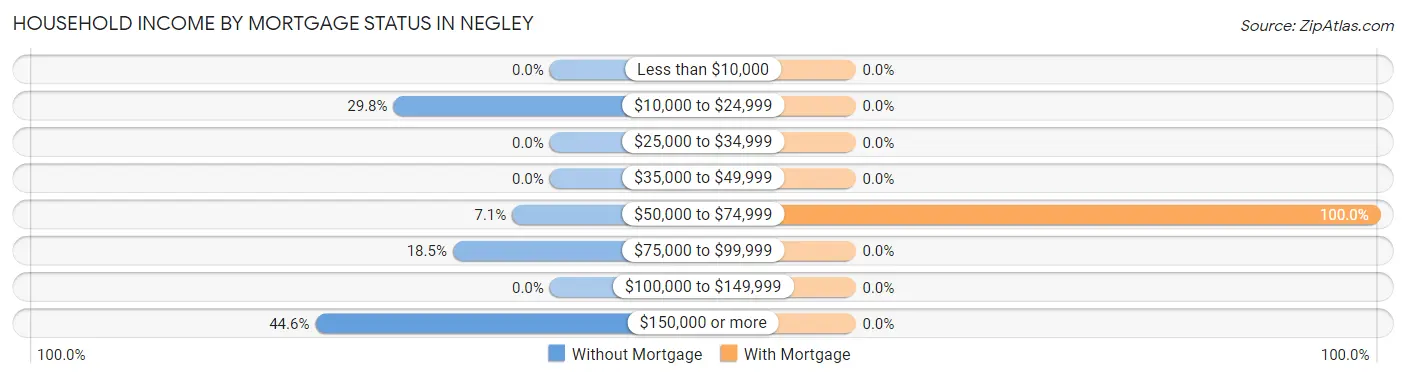
| Household Income | Without Mortgage | With Mortgage |
| Less than $10,000 | 0 (0.0%) | 0 (0.0%) |
| $10,000 to $24,999 | 50 (29.8%) | 0 (0.0%) |
| $25,000 to $34,999 | 0 (0.0%) | 0 (0.0%) |
| $35,000 to $49,999 | 0 (0.0%) | 0 (0.0%) |
| $50,000 to $74,999 | 12 (7.1%) | 4 (100.0%) |
| $75,000 to $99,999 | 31 (18.4%) | 0 (0.0%) |
| $100,000 to $149,999 | 0 (0.0%) | 0 (0.0%) |
| $150,000 or more | 75 (44.6%) | 0 (0.0%) |
| Total | 168 (100.0%) | 4 (100.0%) |
Property Value to Household Income Ratio in Negley
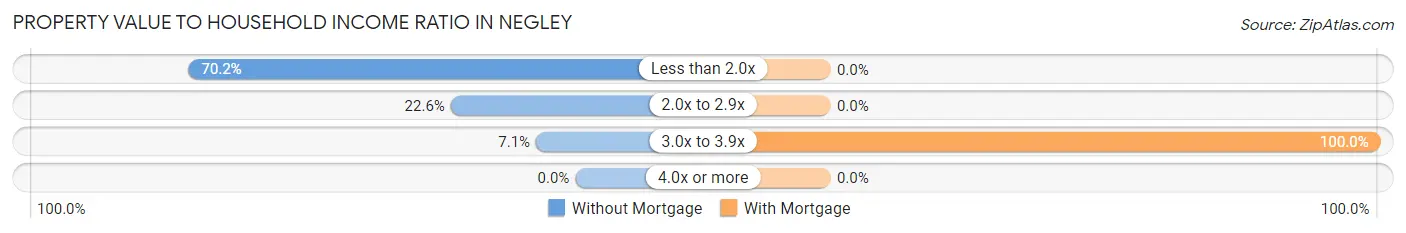
| Value-to-Income Ratio | Without Mortgage | With Mortgage |
| Less than 2.0x | 118 (70.2%) | 0 (0.0%) |
| 2.0x to 2.9x | 38 (22.6%) | 0 (0.0%) |
| 3.0x to 3.9x | 12 (7.1%) | 4 (100.0%) |
| 4.0x or more | 0 (0.0%) | 0 (0.0%) |
| Total | 168 (100.0%) | 4 (100.0%) |
Real Estate Taxes by Mortgage Status in Negley
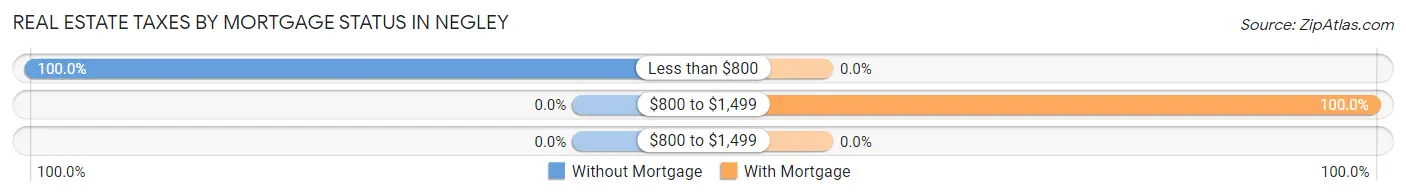
| Property Taxes | Without Mortgage | With Mortgage |
| Less than $800 | 168 (100.0%) | 0 (0.0%) |
| $800 to $1,499 | 0 (0.0%) | 4 (100.0%) |
| $800 to $1,499 | 0 (0.0%) | 0 (0.0%) |
| Total | 168 (100.0%) | 4 (100.0%) |
Health & Disability in Negley
Health Insurance Coverage by Age in Negley
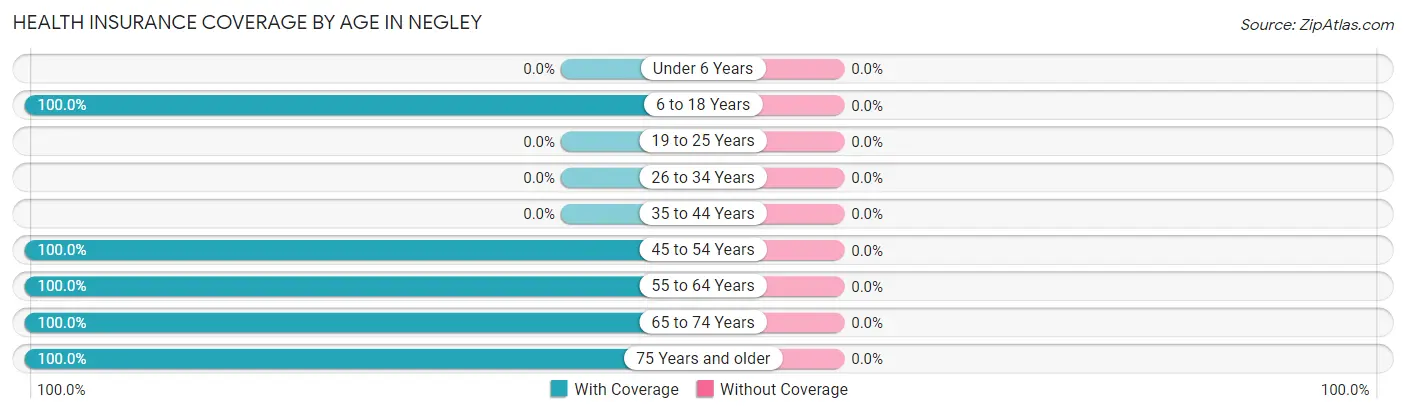
| Age Bracket | With Coverage | Without Coverage |
| Under 6 Years | 0 (0.0%) | 0 (0.0%) |
| 6 to 18 Years | 50 (100.0%) | 0 (0.0%) |
| 19 to 25 Years | 0 (0.0%) | 0 (0.0%) |
| 26 to 34 Years | 0 (0.0%) | 0 (0.0%) |
| 35 to 44 Years | 0 (0.0%) | 0 (0.0%) |
| 45 to 54 Years | 38 (100.0%) | 0 (0.0%) |
| 55 to 64 Years | 129 (100.0%) | 0 (0.0%) |
| 65 to 74 Years | 55 (100.0%) | 0 (0.0%) |
| 75 Years and older | 33 (100.0%) | 0 (0.0%) |
| Total | 305 (100.0%) | 0 (0.0%) |
Health Insurance Coverage by Citizenship Status in Negley
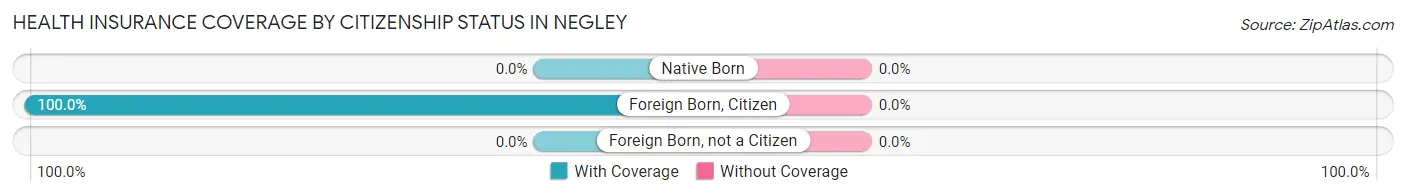
| Citizenship Status | With Coverage | Without Coverage |
| Native Born | 0 (0.0%) | 0 (0.0%) |
| Foreign Born, Citizen | 50 (100.0%) | 0 (0.0%) |
| Foreign Born, not a Citizen | 0 (0.0%) | 0 (0.0%) |
Health Insurance Coverage by Household Income in Negley
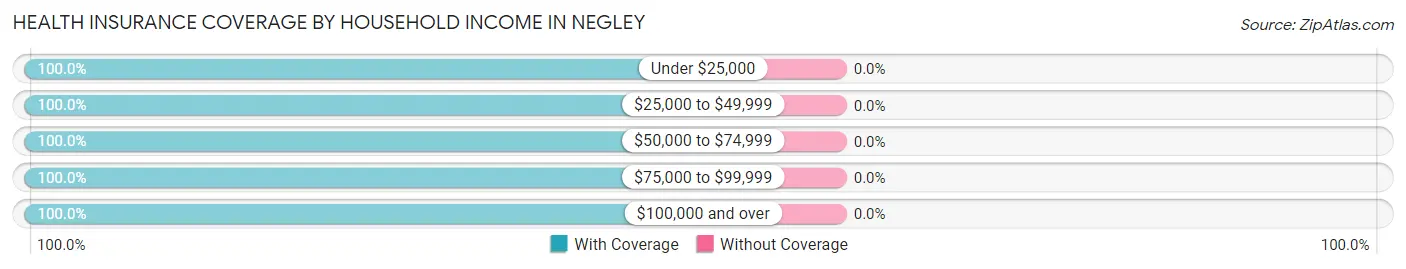
| Household Income | With Coverage | Without Coverage |
| Under $25,000 | 106 (100.0%) | 0 (0.0%) |
| $25,000 to $49,999 | 34 (100.0%) | 0 (0.0%) |
| $50,000 to $74,999 | 12 (100.0%) | 0 (0.0%) |
| $75,000 to $99,999 | 31 (100.0%) | 0 (0.0%) |
| $100,000 and over | 122 (100.0%) | 0 (0.0%) |
Public vs Private Health Insurance Coverage by Age in Negley
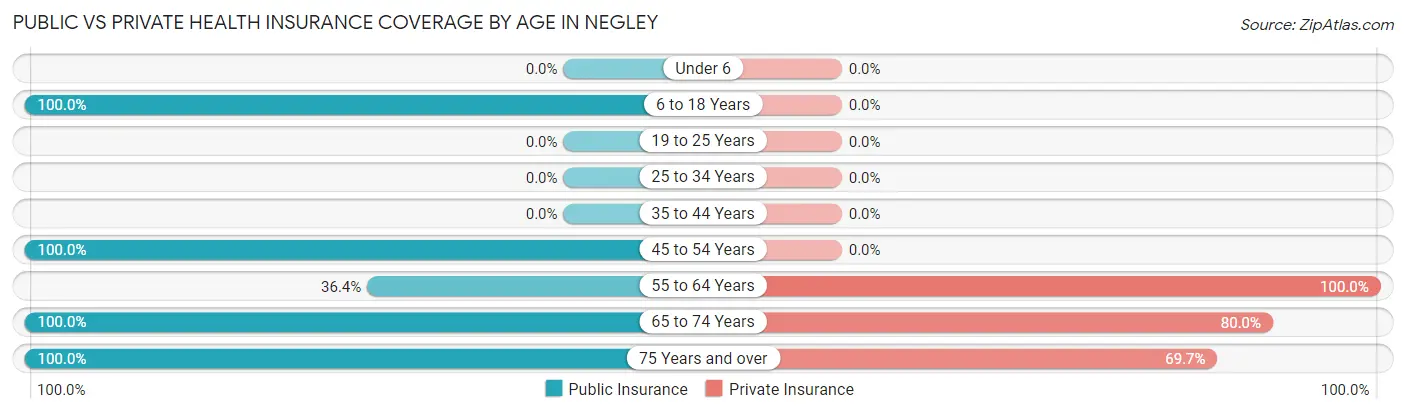
| Age Bracket | Public Insurance | Private Insurance |
| Under 6 | 0 (0.0%) | 0 (0.0%) |
| 6 to 18 Years | 50 (100.0%) | 0 (0.0%) |
| 19 to 25 Years | 0 (0.0%) | 0 (0.0%) |
| 25 to 34 Years | 0 (0.0%) | 0 (0.0%) |
| 35 to 44 Years | 0 (0.0%) | 0 (0.0%) |
| 45 to 54 Years | 38 (100.0%) | 0 (0.0%) |
| 55 to 64 Years | 47 (36.4%) | 129 (100.0%) |
| 65 to 74 Years | 55 (100.0%) | 44 (80.0%) |
| 75 Years and over | 33 (100.0%) | 23 (69.7%) |
| Total | 223 (73.1%) | 196 (64.3%) |
Disability Status by Sex by Age in Negley
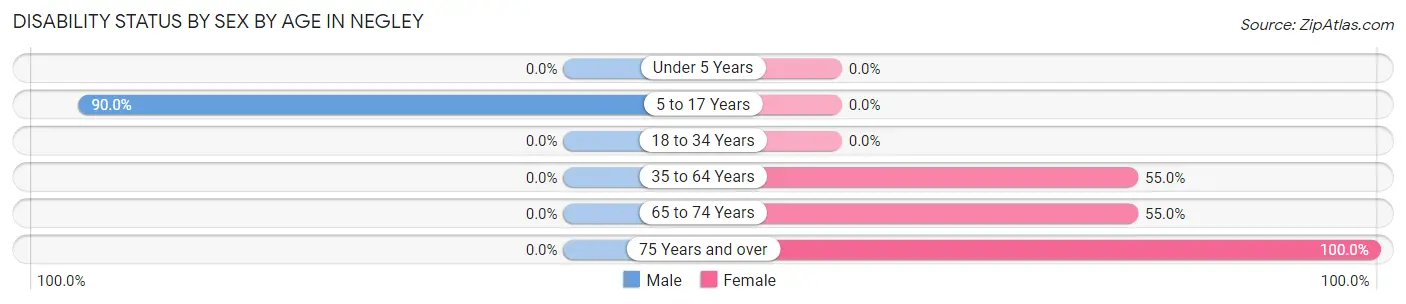
| Age Bracket | Male | Female |
| Under 5 Years | 0 (0.0%) | 0 (0.0%) |
| 5 to 17 Years | 45 (90.0%) | 0 (0.0%) |
| 18 to 34 Years | 0 (0.0%) | 0 (0.0%) |
| 35 to 64 Years | 0 (0.0%) | 66 (55.0%) |
| 65 to 74 Years | 0 (0.0%) | 11 (55.0%) |
| 75 Years and over | 0 (0.0%) | 12 (100.0%) |
Disability Class by Sex by Age in Negley
Disability Class: Hearing Difficulty
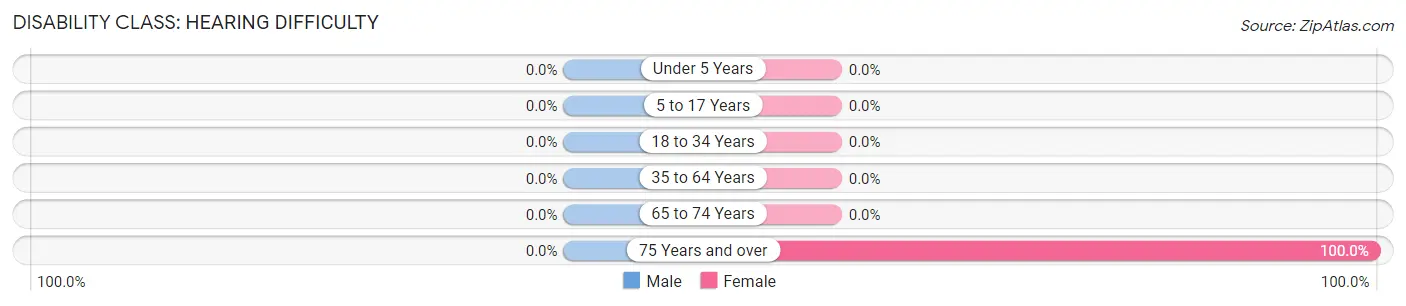
| Age Bracket | Male | Female |
| Under 5 Years | 0 (0.0%) | 0 (0.0%) |
| 5 to 17 Years | 0 (0.0%) | 0 (0.0%) |
| 18 to 34 Years | 0 (0.0%) | 0 (0.0%) |
| 35 to 64 Years | 0 (0.0%) | 0 (0.0%) |
| 65 to 74 Years | 0 (0.0%) | 0 (0.0%) |
| 75 Years and over | 0 (0.0%) | 12 (100.0%) |
Disability Class: Vision Difficulty
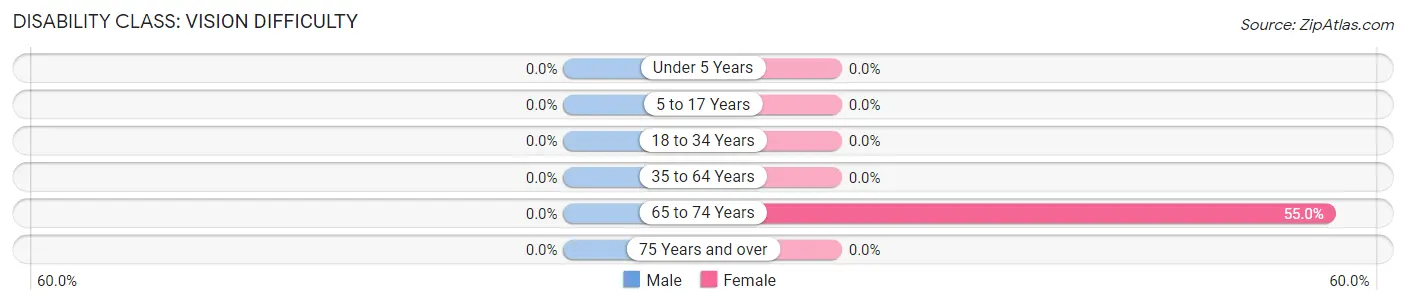
| Age Bracket | Male | Female |
| Under 5 Years | 0 (0.0%) | 0 (0.0%) |
| 5 to 17 Years | 0 (0.0%) | 0 (0.0%) |
| 18 to 34 Years | 0 (0.0%) | 0 (0.0%) |
| 35 to 64 Years | 0 (0.0%) | 0 (0.0%) |
| 65 to 74 Years | 0 (0.0%) | 11 (55.0%) |
| 75 Years and over | 0 (0.0%) | 0 (0.0%) |
Disability Class: Cognitive Difficulty
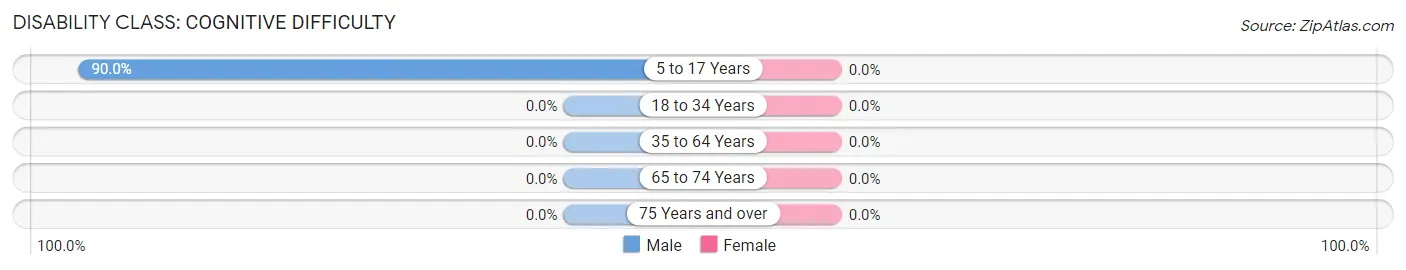
| Age Bracket | Male | Female |
| 5 to 17 Years | 45 (90.0%) | 0 (0.0%) |
| 18 to 34 Years | 0 (0.0%) | 0 (0.0%) |
| 35 to 64 Years | 0 (0.0%) | 0 (0.0%) |
| 65 to 74 Years | 0 (0.0%) | 0 (0.0%) |
| 75 Years and over | 0 (0.0%) | 0 (0.0%) |
Disability Class: Ambulatory Difficulty
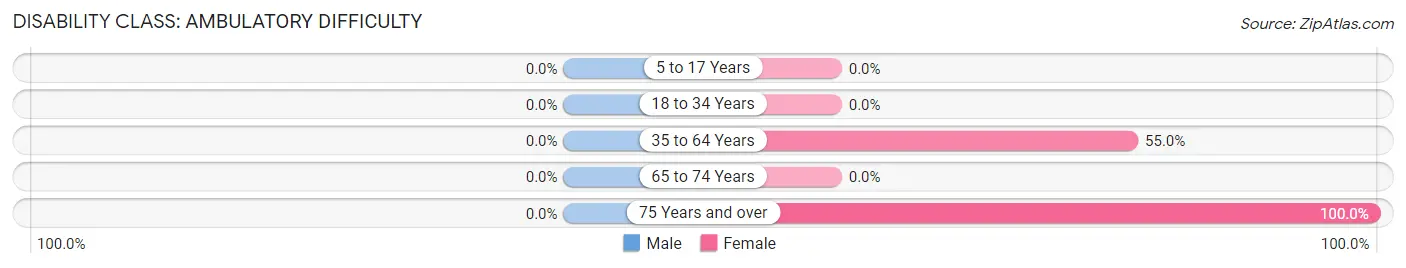
| Age Bracket | Male | Female |
| 5 to 17 Years | 0 (0.0%) | 0 (0.0%) |
| 18 to 34 Years | 0 (0.0%) | 0 (0.0%) |
| 35 to 64 Years | 0 (0.0%) | 66 (55.0%) |
| 65 to 74 Years | 0 (0.0%) | 0 (0.0%) |
| 75 Years and over | 0 (0.0%) | 12 (100.0%) |
Disability Class: Self-Care Difficulty

| Age Bracket | Male | Female |
| 5 to 17 Years | 45 (90.0%) | 0 (0.0%) |
| 18 to 34 Years | 0 (0.0%) | 0 (0.0%) |
| 35 to 64 Years | 0 (0.0%) | 0 (0.0%) |
| 65 to 74 Years | 0 (0.0%) | 0 (0.0%) |
| 75 Years and over | 0 (0.0%) | 0 (0.0%) |
Technology Access in Negley
Computing Device Access in Negley
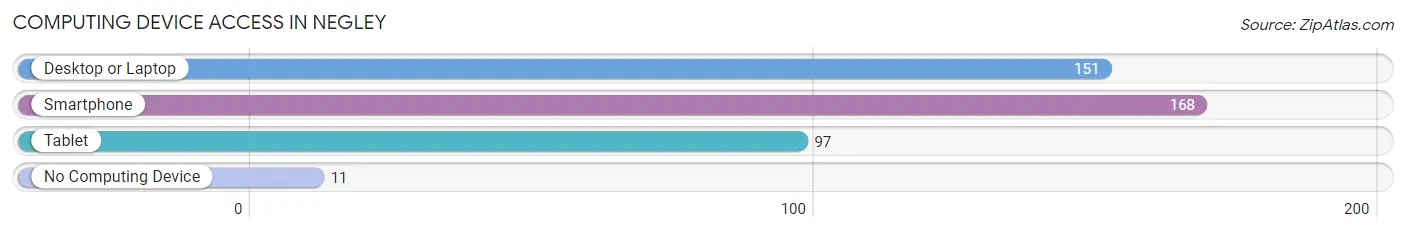
| Device Type | # Households | % Households |
| Desktop or Laptop | 151 | 82.5% |
| Smartphone | 168 | 91.8% |
| Tablet | 97 | 53.0% |
| No Computing Device | 11 | 6.0% |
| Total | 183 | 100.0% |
Internet Access in Negley
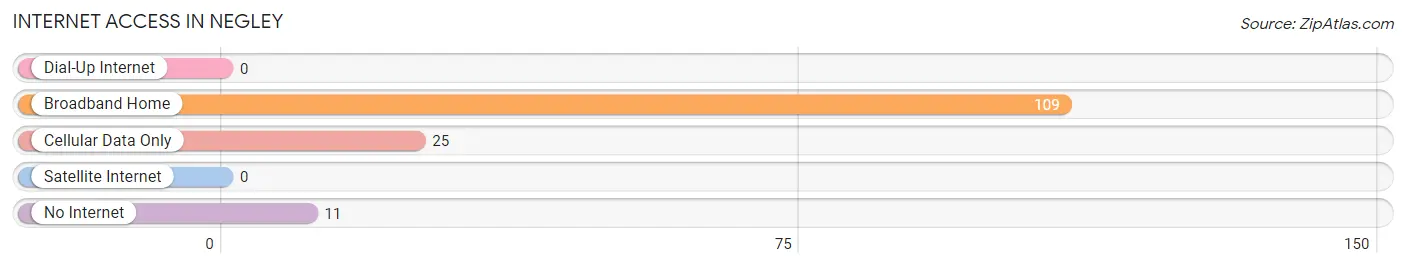
| Internet Type | # Households | % Households |
| Dial-Up Internet | 0 | 0.0% |
| Broadband Home | 109 | 59.6% |
| Cellular Data Only | 25 | 13.7% |
| Satellite Internet | 0 | 0.0% |
| No Internet | 11 | 6.0% |
| Total | 183 | 100.0% |
Negley Summary
History
Negley, Ohio is a small village located in Columbiana County, Ohio. It was founded in 1817 by John Negley, a Revolutionary War veteran. The village was originally known as Negley’s Station, and was a stop on the stagecoach line between Pittsburgh and Cleveland. The village was officially incorporated in 1837.
In the late 19th century, Negley was a thriving agricultural community. The village was home to several mills, including a grist mill, a saw mill, and a woolen mill. The village also had a blacksmith shop, a general store, and a post office.
In the early 20th century, Negley began to decline. The mills closed, and the population began to dwindle. By the 1950s, the village was nearly abandoned.
In the late 20th century, Negley began to experience a resurgence. The village was designated a historic district in 1978, and several of the original buildings were restored. Today, Negley is a small, rural community with a population of about 500.
Geography
Negley is located in Columbiana County, Ohio, about 25 miles east of Youngstown. The village is situated on the banks of the Little Beaver Creek, a tributary of the Mahoning River. The village is surrounded by rolling hills and farmland.
The climate in Negley is typical of the Midwest, with hot summers and cold winters. The average annual temperature is around 50 degrees Fahrenheit. The average annual precipitation is around 40 inches.
Economy
The economy of Negley is largely based on agriculture. The village is home to several farms, which produce a variety of crops, including corn, soybeans, and wheat. The village also has a few small businesses, including a general store and a restaurant.
Demographics
As of the 2010 census, the population of Negley was 498. The racial makeup of the village was 97.2% White, 0.6% African American, 0.2% Native American, 0.2% Asian, and 1.8% from other races. The median household income was $37,500, and the median family income was $45,000. The per capita income was $17,000. About 11.2% of the population was below the poverty line.
Common Questions
What is Per Capita Income in Negley?
Per Capita income in Negley is $53,568.
What is the Median Family Income in Negley?
Median Family Income in Negley is $23,487.
What is Inequality or Gini Index in Negley?
Inequality or Gini Index in Negley is 0.40.
What is the Total Population of Negley?
Total Population of Negley is 305.
What is the Total Male Population of Negley?
Total Male Population of Negley is 153.
What is the Total Female Population of Negley?
Total Female Population of Negley is 152.
What is the Ratio of Males per 100 Females in Negley?
There are 100.66 Males per 100 Females in Negley.
What is the Ratio of Females per 100 Males in Negley?
There are 99.35 Females per 100 Males in Negley.
What is the Median Population Age in Negley?
Median Population Age in Negley is 63.0 Years.
What is the Average Family Size in Negley
Average Family Size in Negley is 2.2 People.
What is the Average Household Size in Negley
Average Household Size in Negley is 1.7 People.
How Large is the Labor Force in Negley?
There are 216 People in the Labor Forcein in Negley.
What is the Percentage of People in the Labor Force in Negley?
83.1% of People are in the Labor Force in Negley.