Zip Codes with the Highest Percentage of Population Employed in Office & Administration in Dayton, OH
RELATED REPORTS & OPTIONS
Office & Administration
Dayton
Compare Zip Codes
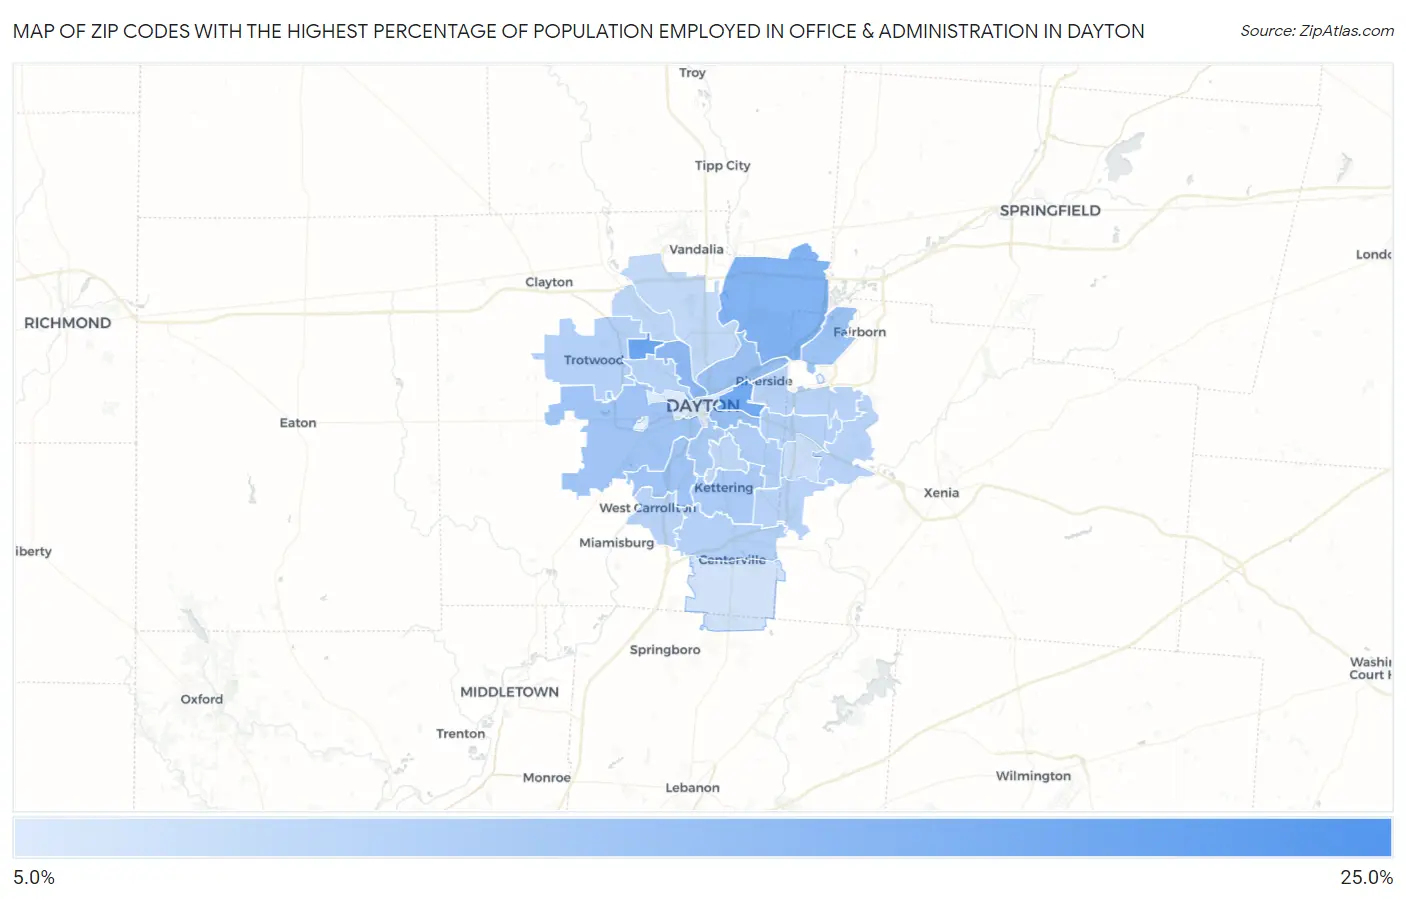
Map of Zip Codes with the Highest Percentage of Population Employed in Office & Administration in Dayton
6.2%
22.0%
Zip Codes with the Highest Percentage of Population Employed in Office & Administration in Dayton, OH
| Zip Code | % Employed | vs State | vs National | |
| 1. | 45469 | 22.0% | 11.3%(+10.8)#49 | 10.9%(+11.2)#1,300 |
| 2. | 45416 | 17.9% | 11.3%(+6.66)#89 | 10.9%(+7.06)#2,398 |
| 3. | 45403 | 17.2% | 11.3%(+5.93)#108 | 10.9%(+6.33)#2,751 |
| 4. | 45424 | 15.6% | 11.3%(+4.38)#156 | 10.9%(+4.78)#3,883 |
| 5. | 45405 | 14.3% | 11.3%(+3.08)#212 | 10.9%(+3.48)#5,477 |
| 6. | 45410 | 13.3% | 11.3%(+2.00)#296 | 10.9%(+2.40)#7,466 |
| 7. | 45404 | 12.9% | 11.3%(+1.63)#325 | 10.9%(+2.03)#8,337 |
| 8. | 45433 | 12.6% | 11.3%(+1.31)#348 | 10.9%(+1.71)#9,120 |
| 9. | 45439 | 12.3% | 11.3%(+1.06)#381 | 10.9%(+1.46)#9,819 |
| 10. | 45417 | 12.2% | 11.3%(+0.967)#392 | 10.9%(+1.37)#10,074 |
| 11. | 45409 | 11.3% | 11.3%(+0.004)#523 | 10.9%(+0.404)#13,014 |
| 12. | 45429 | 11.2% | 11.3%(-0.072)#537 | 10.9%(+0.328)#13,254 |
| 13. | 45420 | 10.8% | 11.3%(-0.420)#583 | 10.9%(-0.020)#14,403 |
| 14. | 45432 | 10.4% | 11.3%(-0.851)#640 | 10.9%(-0.451)#15,807 |
| 15. | 45459 | 10.3% | 11.3%(-0.950)#657 | 10.9%(-0.550)#16,138 |
| 16. | 45426 | 10.3% | 11.3%(-0.950)#658 | 10.9%(-0.550)#16,141 |
| 17. | 45406 | 10.2% | 11.3%(-1.10)#673 | 10.9%(-0.699)#16,611 |
| 18. | 45431 | 9.9% | 11.3%(-1.36)#702 | 10.9%(-0.964)#17,485 |
| 19. | 45449 | 9.9% | 11.3%(-1.39)#709 | 10.9%(-0.990)#17,562 |
| 20. | 45440 | 9.9% | 11.3%(-1.39)#711 | 10.9%(-0.994)#17,575 |
| 21. | 45434 | 9.8% | 11.3%(-1.47)#720 | 10.9%(-1.07)#17,789 |
| 22. | 45419 | 9.5% | 11.3%(-1.74)#745 | 10.9%(-1.34)#18,704 |
| 23. | 45415 | 9.4% | 11.3%(-1.82)#751 | 10.9%(-1.42)#18,966 |
| 24. | 45414 | 8.9% | 11.3%(-2.40)#808 | 10.9%(-2.00)#20,670 |
| 25. | 45430 | 8.1% | 11.3%(-3.18)#883 | 10.9%(-2.78)#22,834 |
| 26. | 45458 | 7.3% | 11.3%(-3.92)#940 | 10.9%(-3.52)#24,531 |
| 27. | 45402 | 6.2% | 11.3%(-5.08)#1,010 | 10.9%(-4.68)#26,596 |
1
Common Questions
What are the Top 10 Zip Codes with the Highest Percentage of Population Employed in Office & Administration in Dayton, OH?
Top 10 Zip Codes with the Highest Percentage of Population Employed in Office & Administration in Dayton, OH are:
What zip code has the Highest Percentage of Population Employed in Office & Administration in Dayton, OH?
45469 has the Highest Percentage of Population Employed in Office & Administration in Dayton, OH with 22.0%.
What is the Percentage of Population Employed in Office & Administration in Dayton, OH?
Percentage of Population Employed in Office & Administration in Dayton is 12.7%.
What is the Percentage of Population Employed in Office & Administration in Ohio?
Percentage of Population Employed in Office & Administration in Ohio is 11.3%.
What is the Percentage of Population Employed in Office & Administration in the United States?
Percentage of Population Employed in Office & Administration in the United States is 10.9%.