Port Jefferson, OH Map & Demographics
Port Jefferson Map
Port Jefferson Overview
$33,651
PER CAPITA INCOME
$73,594
AVG FAMILY INCOME
$36,250
AVG HOUSEHOLD INCOME
59.4%
WAGE / INCOME GAP [ % ]
40.6¢/ $1
WAGE / INCOME GAP [ $ ]
0.53
INEQUALITY / GINI INDEX
387
TOTAL POPULATION
199
MALE POPULATION
188
FEMALE POPULATION
105.85
MALES / 100 FEMALES
94.47
FEMALES / 100 MALES
46.5
MEDIAN AGE
2.8
AVG FAMILY SIZE
2.0
AVG HOUSEHOLD SIZE
203
LABOR FORCE [ PEOPLE ]
60.6%
PERCENT IN LABOR FORCE
13.3%
UNEMPLOYMENT RATE
Port Jefferson Zip Codes
Port Jefferson Area Codes
Income in Port Jefferson
Income Overview in Port Jefferson
Per Capita Income in Port Jefferson is $33,651, while median incomes of families and households are $73,594 and $36,250 respectively.
| Characteristic | Number | Measure |
| Per Capita Income | 387 | $33,651 |
| Median Family Income | 87 | $73,594 |
| Mean Family Income | 87 | $99,137 |
| Median Household Income | 192 | $36,250 |
| Mean Household Income | 192 | $61,119 |
| Income Deficit | 87 | $0 |
| Wage / Income Gap (%) | 387 | 59.35% |
| Wage / Income Gap ($) | 387 | 40.65¢ per $1 |
| Gini / Inequality Index | 387 | 0.53 |
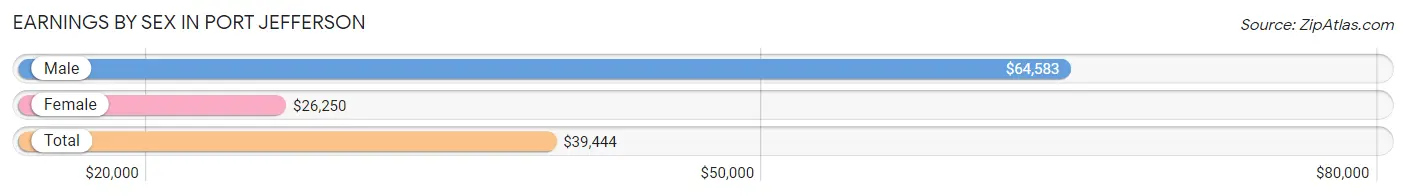
Earnings by Sex in Port Jefferson
Average Earnings in Port Jefferson are $39,444, $64,583 for men and $26,250 for women, a difference of 59.4%.
| Sex | Number | Average Earnings |
| Male | 99 (51.0%) | $64,583 |
| Female | 95 (49.0%) | $26,250 |
| Total | 194 (100.0%) | $39,444 |
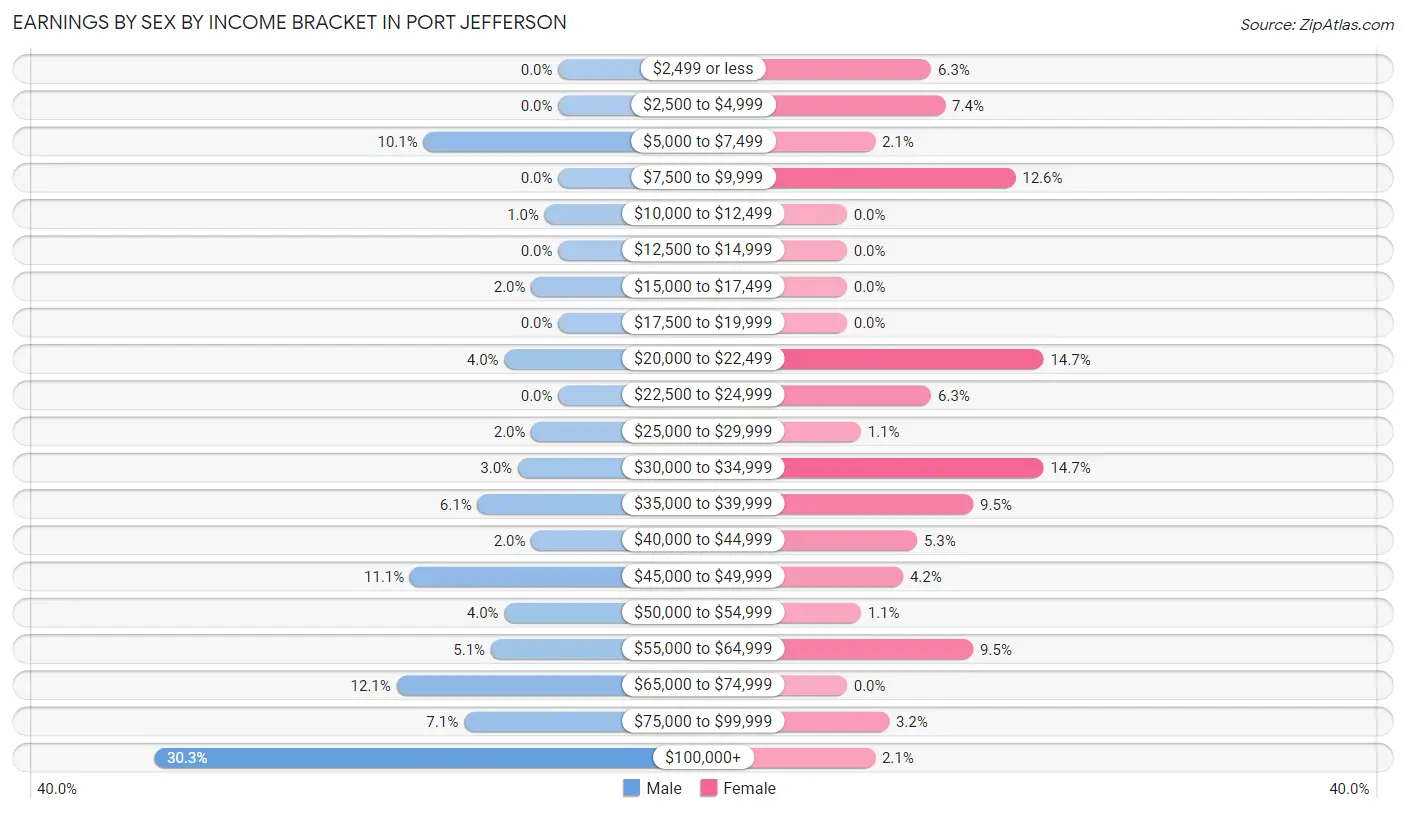
Earnings by Sex by Income Bracket in Port Jefferson
The most common earnings brackets in Port Jefferson are $100,000+ for men (30 | 30.3%) and $20,000 to $22,499 for women (14 | 14.7%).
| Income | Male | Female |
| $2,499 or less | 0 (0.0%) | 6 (6.3%) |
| $2,500 to $4,999 | 0 (0.0%) | 7 (7.4%) |
| $5,000 to $7,499 | 10 (10.1%) | 2 (2.1%) |
| $7,500 to $9,999 | 0 (0.0%) | 12 (12.6%) |
| $10,000 to $12,499 | 1 (1.0%) | 0 (0.0%) |
| $12,500 to $14,999 | 0 (0.0%) | 0 (0.0%) |
| $15,000 to $17,499 | 2 (2.0%) | 0 (0.0%) |
| $17,500 to $19,999 | 0 (0.0%) | 0 (0.0%) |
| $20,000 to $22,499 | 4 (4.0%) | 14 (14.7%) |
| $22,500 to $24,999 | 0 (0.0%) | 6 (6.3%) |
| $25,000 to $29,999 | 2 (2.0%) | 1 (1.1%) |
| $30,000 to $34,999 | 3 (3.0%) | 14 (14.7%) |
| $35,000 to $39,999 | 6 (6.1%) | 9 (9.5%) |
| $40,000 to $44,999 | 2 (2.0%) | 5 (5.3%) |
| $45,000 to $49,999 | 11 (11.1%) | 4 (4.2%) |
| $50,000 to $54,999 | 4 (4.0%) | 1 (1.1%) |
| $55,000 to $64,999 | 5 (5.1%) | 9 (9.5%) |
| $65,000 to $74,999 | 12 (12.1%) | 0 (0.0%) |
| $75,000 to $99,999 | 7 (7.1%) | 3 (3.2%) |
| $100,000+ | 30 (30.3%) | 2 (2.1%) |
| Total | 99 (100.0%) | 95 (100.0%) |
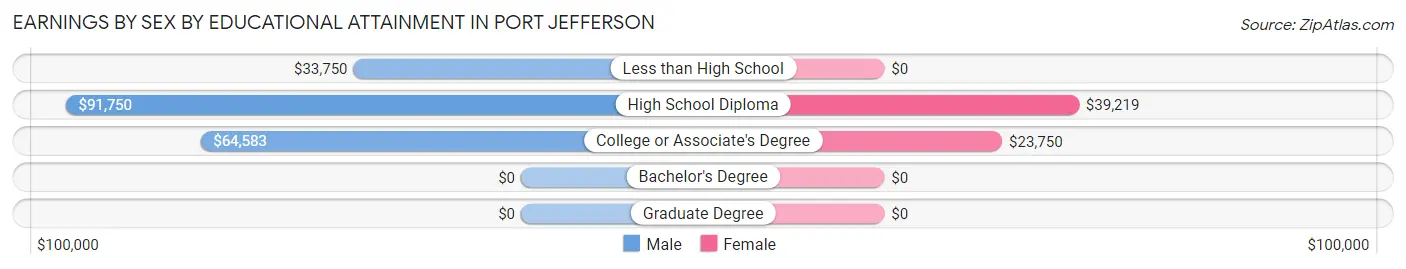
Earnings by Sex by Educational Attainment in Port Jefferson
Average earnings in Port Jefferson are $71,875 for men and $30,893 for women, a difference of 57.0%. Men with an educational attainment of high school diploma enjoy the highest average annual earnings of $91,750, while those with less than high school education earn the least with $33,750. Women with an educational attainment of high school diploma earn the most with the average annual earnings of $39,219, while those with college or associate's degree education have the smallest earnings of $23,750.
| Educational Attainment | Male Income | Female Income |
| Less than High School | $33,750 | $0 |
| High School Diploma | $91,750 | $39,219 |
| College or Associate's Degree | $64,583 | $23,750 |
| Bachelor's Degree | - | - |
| Graduate Degree | - | - |
| Total | $71,875 | $30,893 |
Family Income in Port Jefferson
Family Income Brackets in Port Jefferson
According to the Port Jefferson family income data, there are 26 families falling into the $100,000 to $149,999 income range, which is the most common income bracket and makes up 29.9% of all families.
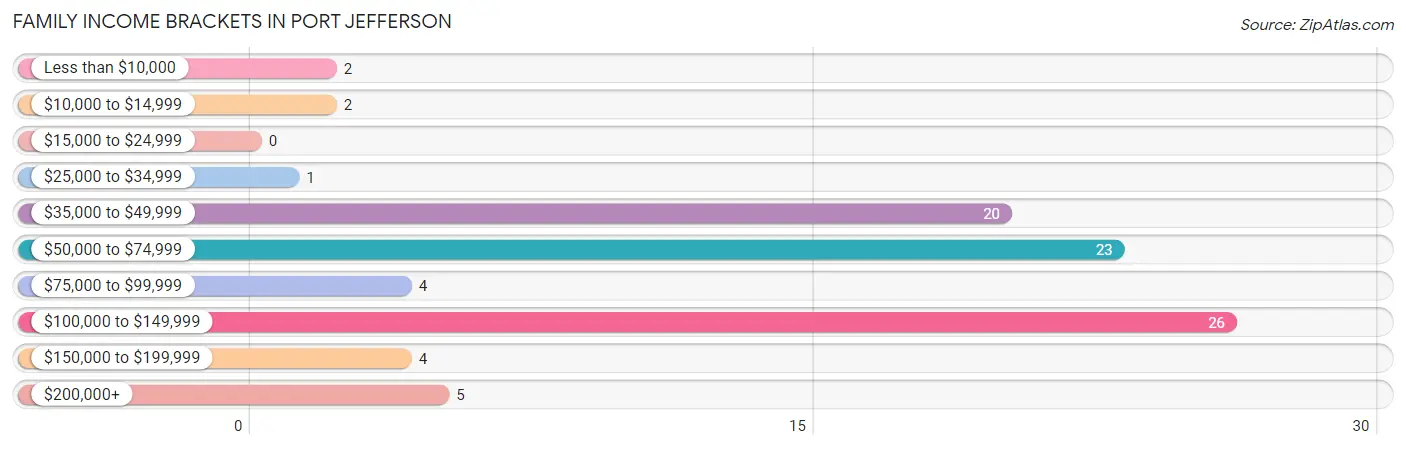
| Income Bracket | # Families | % Families |
| Less than $10,000 | 2 | 2.3% |
| $10,000 to $14,999 | 2 | 2.3% |
| $15,000 to $24,999 | 0 | 0.0% |
| $25,000 to $34,999 | 1 | 1.1% |
| $35,000 to $49,999 | 20 | 23.0% |
| $50,000 to $74,999 | 23 | 26.4% |
| $75,000 to $99,999 | 4 | 4.6% |
| $100,000 to $149,999 | 26 | 29.9% |
| $150,000 to $199,999 | 4 | 4.6% |
| $200,000+ | 5 | 5.7% |
Family Income by Famaliy Size in Port Jefferson
4-person families (17 | 19.5%) account for the highest median family income in Port Jefferson with $114,375 per family, while 2-person families (50 | 57.5%) have the highest median income of $36,250 per family member.
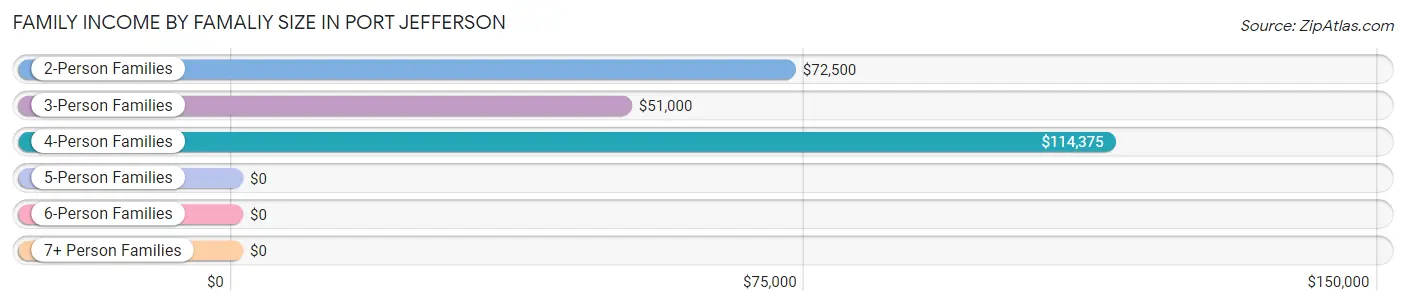
| Income Bracket | # Families | Median Income |
| 2-Person Families | 50 (57.5%) | $72,500 |
| 3-Person Families | 14 (16.1%) | $51,000 |
| 4-Person Families | 17 (19.5%) | $114,375 |
| 5-Person Families | 3 (3.5%) | $0 |
| 6-Person Families | 1 (1.1%) | $0 |
| 7+ Person Families | 2 (2.3%) | $0 |
| Total | 87 (100.0%) | $73,594 |
Family Income by Number of Earners in Port Jefferson
The median family income in Port Jefferson is $73,594, with families comprising 1 earner (26) having the highest median family income of $102,885, while families with no earners (16) have the lowest median family income of $40,417, accounting for 29.9% and 18.4% of families, respectively.
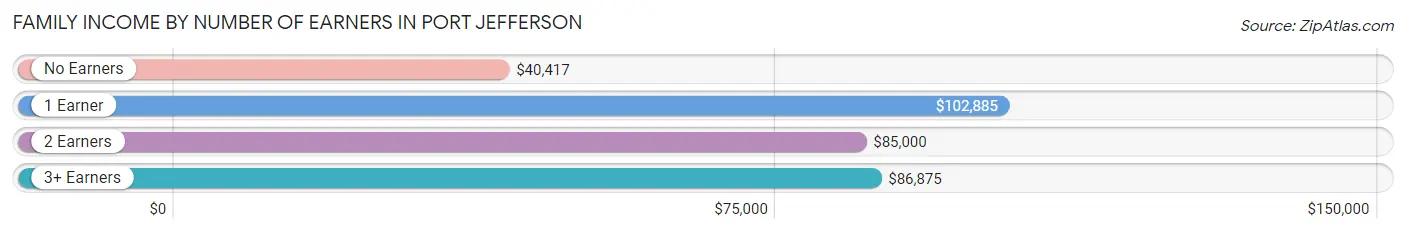
| Number of Earners | # Families | Median Income |
| No Earners | 16 (18.4%) | $40,417 |
| 1 Earner | 26 (29.9%) | $102,885 |
| 2 Earners | 32 (36.8%) | $85,000 |
| 3+ Earners | 13 (14.9%) | $86,875 |
| Total | 87 (100.0%) | $73,594 |
Household Income in Port Jefferson
Household Income Brackets in Port Jefferson
With 70 households falling in the category, the $15,000 to $24,999 income range is the most frequent in Port Jefferson, accounting for 36.5% of all households. In contrast, only 4 households (2.1%) fall into the $150,000 to $199,999 income bracket, making it the least populous group.
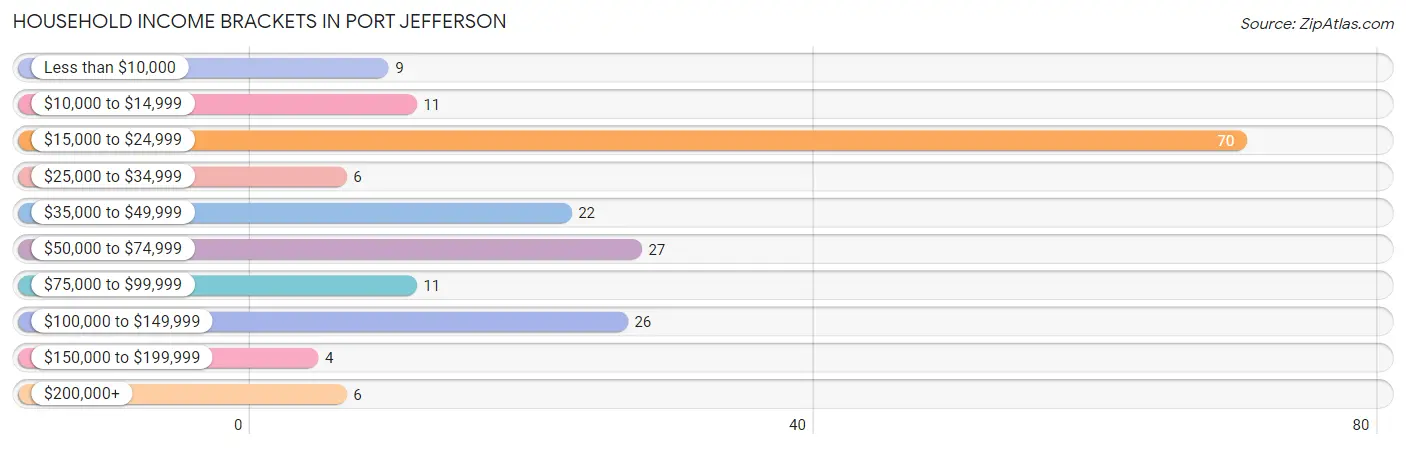
| Income Bracket | # Households | % Households |
| Less than $10,000 | 9 | 4.7% |
| $10,000 to $14,999 | 11 | 5.7% |
| $15,000 to $24,999 | 70 | 36.5% |
| $25,000 to $34,999 | 6 | 3.1% |
| $35,000 to $49,999 | 22 | 11.5% |
| $50,000 to $74,999 | 27 | 14.1% |
| $75,000 to $99,999 | 11 | 5.7% |
| $100,000 to $149,999 | 26 | 13.5% |
| $150,000 to $199,999 | 4 | 2.1% |
| $200,000+ | 6 | 3.1% |
Household Income by Householder Age in Port Jefferson
The median household income in Port Jefferson is $36,250, with the highest median household income of $88,750 found in the 25 to 44 years age bracket for the primary householder. A total of 62 households (32.3%) fall into this category. Meanwhile, the 15 to 24 years age bracket for the primary householder has the lowest median household income of $0, with 2 households (1.0%) in this group.
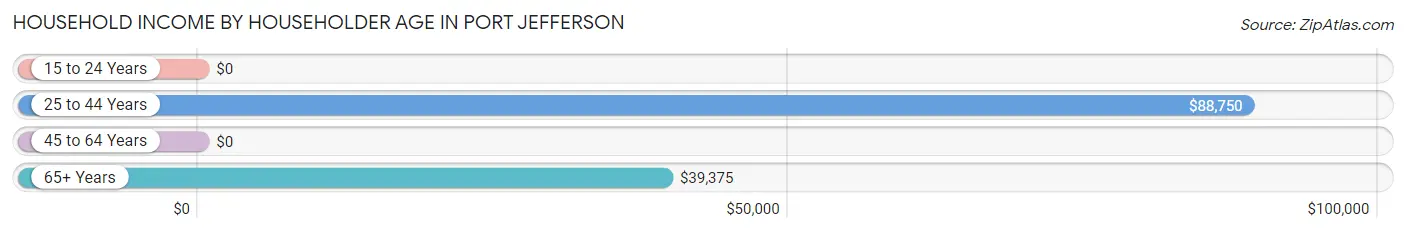
| Income Bracket | # Households | Median Income |
| 15 to 24 Years | 2 (1.0%) | $0 |
| 25 to 44 Years | 62 (32.3%) | $88,750 |
| 45 to 64 Years | 85 (44.3%) | $0 |
| 65+ Years | 43 (22.4%) | $39,375 |
| Total | 192 (100.0%) | $36,250 |
Poverty in Port Jefferson
Income Below Poverty by Sex and Age in Port Jefferson
With 10.1% poverty level for males and 11.5% for females among the residents of Port Jefferson, 35 to 44 year old males and 25 to 34 year old females are the most vulnerable to poverty, with 9 males (33.3%) and 8 females (33.3%) in their respective age groups living below the poverty level.
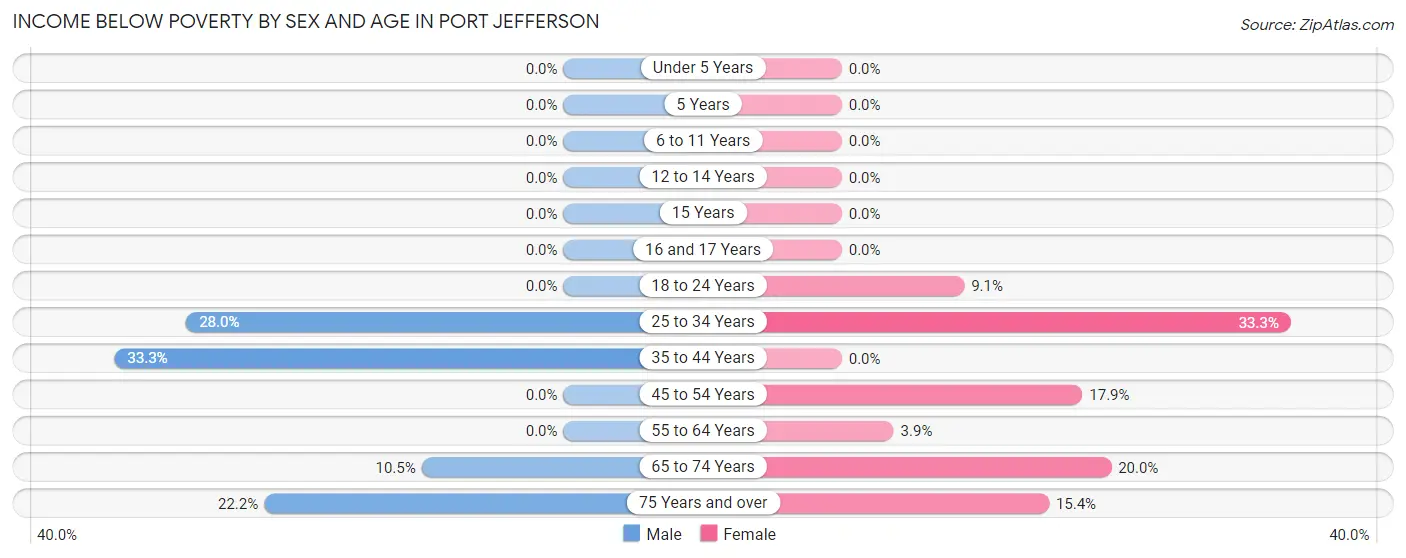
| Age Bracket | Male | Female |
| Under 5 Years | 0 (0.0%) | 0 (0.0%) |
| 5 Years | 0 (0.0%) | 0 (0.0%) |
| 6 to 11 Years | 0 (0.0%) | 0 (0.0%) |
| 12 to 14 Years | 0 (0.0%) | 0 (0.0%) |
| 15 Years | 0 (0.0%) | 0 (0.0%) |
| 16 and 17 Years | 0 (0.0%) | 0 (0.0%) |
| 18 to 24 Years | 0 (0.0%) | 1 (9.1%) |
| 25 to 34 Years | 7 (28.0%) | 8 (33.3%) |
| 35 to 44 Years | 9 (33.3%) | 0 (0.0%) |
| 45 to 54 Years | 0 (0.0%) | 5 (17.9%) |
| 55 to 64 Years | 0 (0.0%) | 1 (3.8%) |
| 65 to 74 Years | 2 (10.5%) | 3 (20.0%) |
| 75 Years and over | 2 (22.2%) | 2 (15.4%) |
| Total | 20 (10.1%) | 20 (11.5%) |
Income Above Poverty by Sex and Age in Port Jefferson
According to the poverty statistics in Port Jefferson, males aged under 5 years and females aged under 5 years are the age groups that are most secure financially, with 100.0% of males and 100.0% of females in these age groups living above the poverty line.
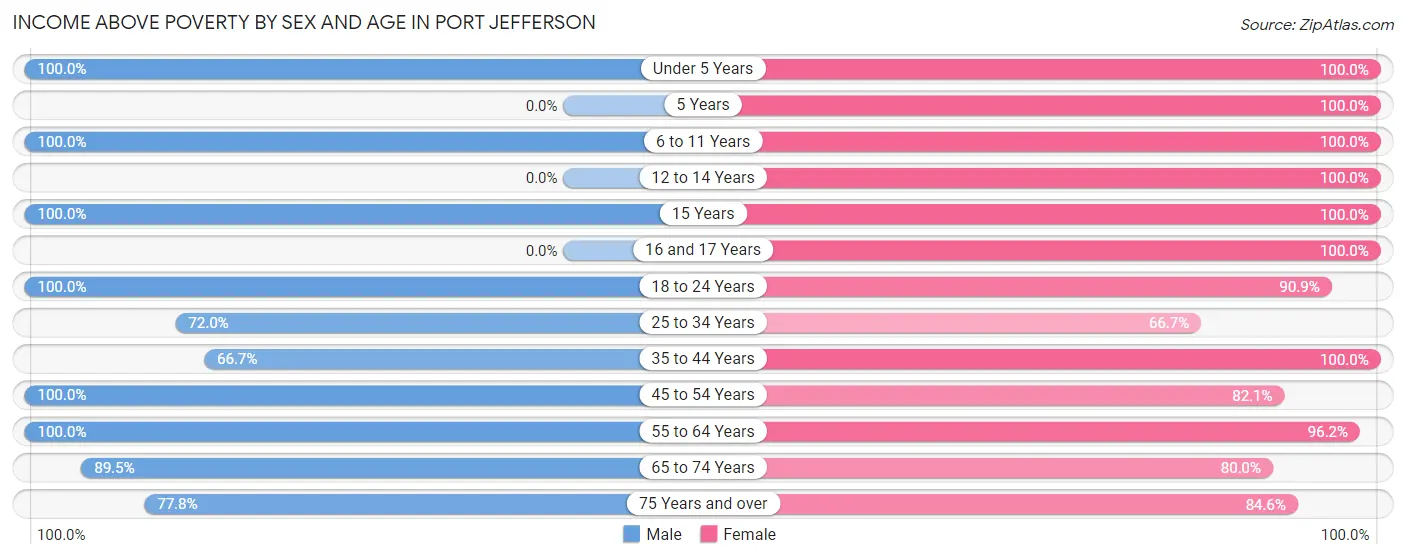
| Age Bracket | Male | Female |
| Under 5 Years | 4 (100.0%) | 2 (100.0%) |
| 5 Years | 0 (0.0%) | 4 (100.0%) |
| 6 to 11 Years | 13 (100.0%) | 10 (100.0%) |
| 12 to 14 Years | 0 (0.0%) | 3 (100.0%) |
| 15 Years | 1 (100.0%) | 1 (100.0%) |
| 16 and 17 Years | 0 (0.0%) | 3 (100.0%) |
| 18 to 24 Years | 10 (100.0%) | 10 (90.9%) |
| 25 to 34 Years | 18 (72.0%) | 16 (66.7%) |
| 35 to 44 Years | 18 (66.7%) | 34 (100.0%) |
| 45 to 54 Years | 32 (100.0%) | 23 (82.1%) |
| 55 to 64 Years | 59 (100.0%) | 25 (96.2%) |
| 65 to 74 Years | 17 (89.5%) | 12 (80.0%) |
| 75 Years and over | 7 (77.8%) | 11 (84.6%) |
| Total | 179 (89.9%) | 154 (88.5%) |
Income Below Poverty Among Married-Couple Families in Port Jefferson
The poverty statistics for married-couple families in Port Jefferson show that 5.7% or 4 of the total 70 families live below the poverty line. Families with no children have the highest poverty rate of 7.7%, comprising of 4 families. On the other hand, families with 1 or 2 children have the lowest poverty rate of 0.0%, which includes 0 families.
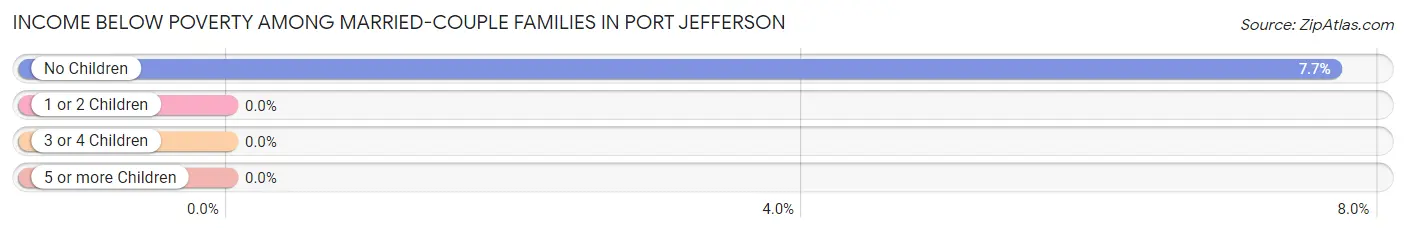
| Children | Above Poverty | Below Poverty |
| No Children | 48 (92.3%) | 4 (7.7%) |
| 1 or 2 Children | 16 (100.0%) | 0 (0.0%) |
| 3 or 4 Children | 0 (0.0%) | 0 (0.0%) |
| 5 or more Children | 2 (100.0%) | 0 (0.0%) |
| Total | 66 (94.3%) | 4 (5.7%) |
Income Below Poverty Among Single-Parent Households in Port Jefferson
| Children | Single Father | Single Mother |
| No Children | 0 (0.0%) | 0 (0.0%) |
| 1 or 2 Children | 0 (0.0%) | 0 (0.0%) |
| 3 or 4 Children | 0 (0.0%) | 0 (0.0%) |
| 5 or more Children | 0 (0.0%) | 0 (0.0%) |
| Total | 0 (0.0%) | 0 (0.0%) |
Income Below Poverty Among Married-Couple vs Single-Parent Households in Port Jefferson
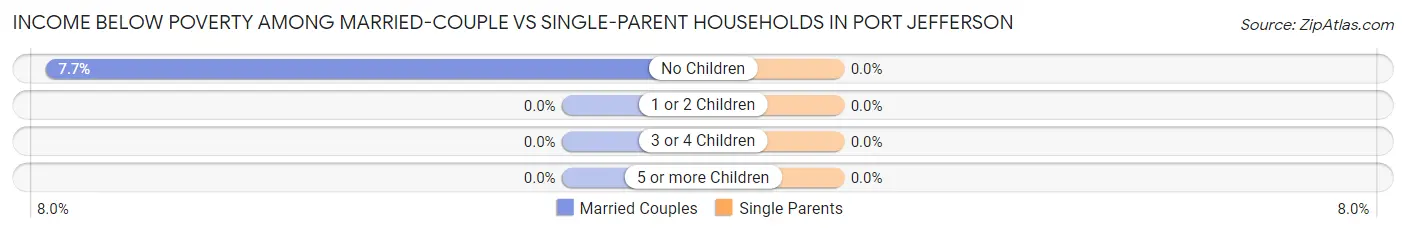
| Children | Married-Couple Families | Single-Parent Households |
| No Children | 4 (7.7%) | 0 (0.0%) |
| 1 or 2 Children | 0 (0.0%) | 0 (0.0%) |
| 3 or 4 Children | 0 (0.0%) | 0 (0.0%) |
| 5 or more Children | 0 (0.0%) | 0 (0.0%) |
| Total | 4 (5.7%) | 0 (0.0%) |
Race in Port Jefferson
The most populous races in Port Jefferson are White / Caucasian (380 | 98.2%), Two or more Races (7 | 1.8%), and Hispanic or Latino (2 | 0.5%).
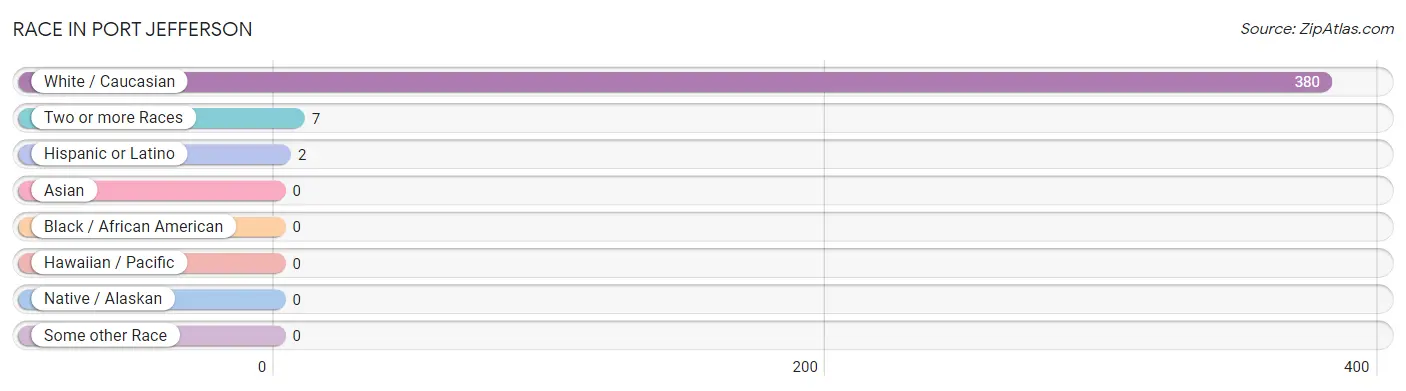
| Race | # Population | % Population |
| Asian | 0 | 0.0% |
| Black / African American | 0 | 0.0% |
| Hawaiian / Pacific | 0 | 0.0% |
| Hispanic or Latino | 2 | 0.5% |
| Native / Alaskan | 0 | 0.0% |
| White / Caucasian | 380 | 98.2% |
| Two or more Races | 7 | 1.8% |
| Some other Race | 0 | 0.0% |
| Total | 387 | 100.0% |
Ancestry in Port Jefferson
The most populous ancestries reported in Port Jefferson are American (86 | 22.2%), German (58 | 15.0%), Dutch (26 | 6.7%), Irish (17 | 4.4%), and English (10 | 2.6%), together accounting for 50.9% of all Port Jefferson residents.
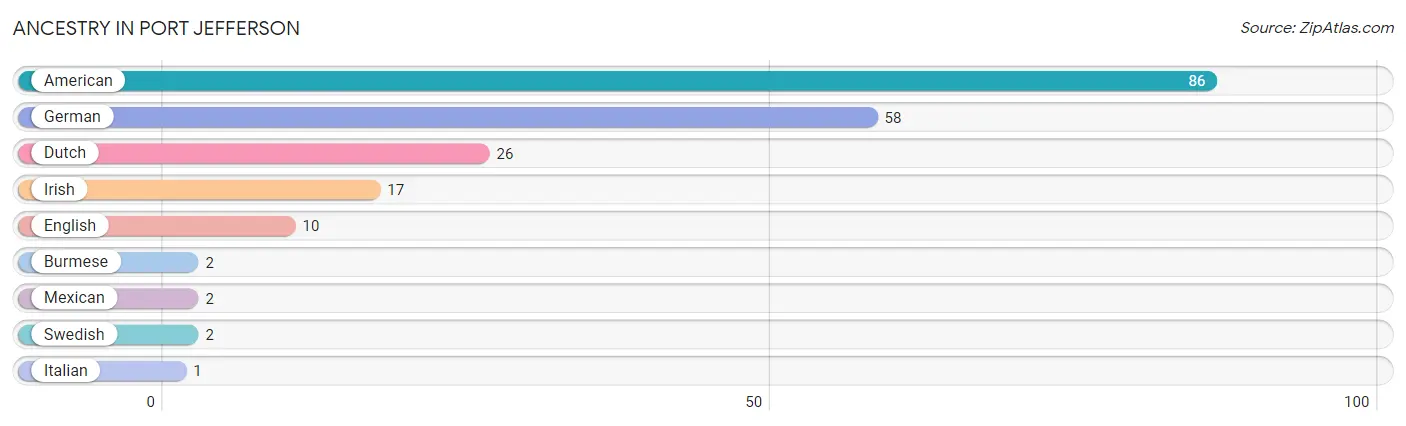
| Ancestry | # Population | % Population |
| American | 86 | 22.2% |
| Burmese | 2 | 0.5% |
| Dutch | 26 | 6.7% |
| English | 10 | 2.6% |
| German | 58 | 15.0% |
| Irish | 17 | 4.4% |
| Italian | 1 | 0.3% |
| Mexican | 2 | 0.5% |
| Swedish | 2 | 0.5% | View All 9 Rows |
Immigrants in Port Jefferson
The most numerous immigrant groups reported in Port Jefferson came from Europe (1 | 0.3%), Germany (1 | 0.3%), and Western Europe (1 | 0.3%), together accounting for 0.8% of all Port Jefferson residents.
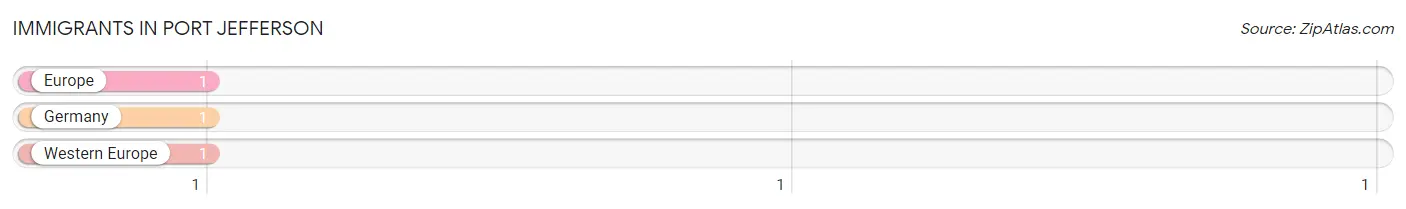
| Immigration Origin | # Population | % Population |
| Europe | 1 | 0.3% |
| Germany | 1 | 0.3% |
| Western Europe | 1 | 0.3% | View All 3 Rows |
Sex and Age in Port Jefferson
Sex and Age in Port Jefferson
The most populous age groups in Port Jefferson are 55 to 59 Years (51 | 25.6%) for men and 35 to 39 Years (21 | 11.2%) for women.
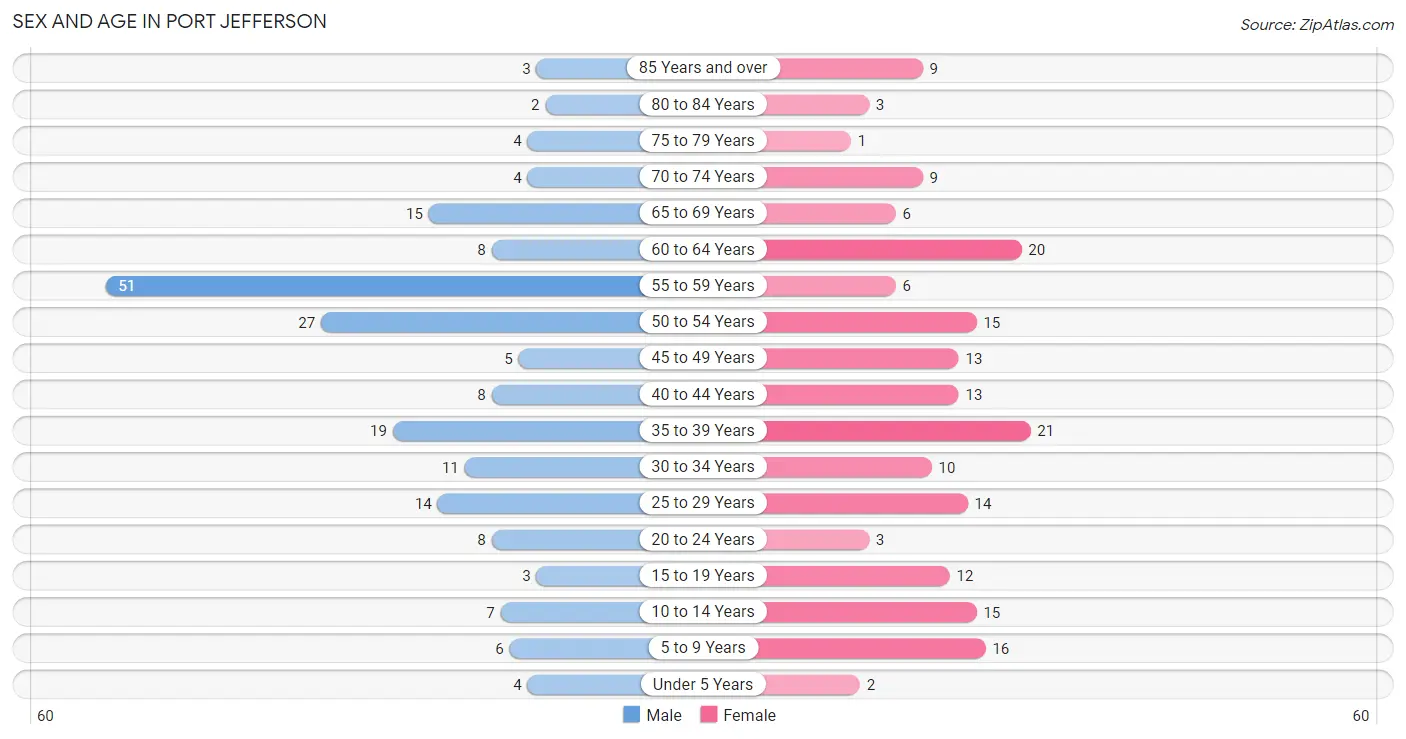
| Age Bracket | Male | Female |
| Under 5 Years | 4 (2.0%) | 2 (1.1%) |
| 5 to 9 Years | 6 (3.0%) | 16 (8.5%) |
| 10 to 14 Years | 7 (3.5%) | 15 (8.0%) |
| 15 to 19 Years | 3 (1.5%) | 12 (6.4%) |
| 20 to 24 Years | 8 (4.0%) | 3 (1.6%) |
| 25 to 29 Years | 14 (7.0%) | 14 (7.4%) |
| 30 to 34 Years | 11 (5.5%) | 10 (5.3%) |
| 35 to 39 Years | 19 (9.6%) | 21 (11.2%) |
| 40 to 44 Years | 8 (4.0%) | 13 (6.9%) |
| 45 to 49 Years | 5 (2.5%) | 13 (6.9%) |
| 50 to 54 Years | 27 (13.6%) | 15 (8.0%) |
| 55 to 59 Years | 51 (25.6%) | 6 (3.2%) |
| 60 to 64 Years | 8 (4.0%) | 20 (10.6%) |
| 65 to 69 Years | 15 (7.5%) | 6 (3.2%) |
| 70 to 74 Years | 4 (2.0%) | 9 (4.8%) |
| 75 to 79 Years | 4 (2.0%) | 1 (0.5%) |
| 80 to 84 Years | 2 (1.0%) | 3 (1.6%) |
| 85 Years and over | 3 (1.5%) | 9 (4.8%) |
| Total | 199 (100.0%) | 188 (100.0%) |
Families and Households in Port Jefferson
Median Family Size in Port Jefferson
The median family size in Port Jefferson is 2.76 persons per family, with single female/mother families (15 | 17.2%) accounting for the largest median family size of 3.33 persons per family. On the other hand, single male/father families (2 | 2.3%) represent the smallest median family size with 2.00 persons per family.
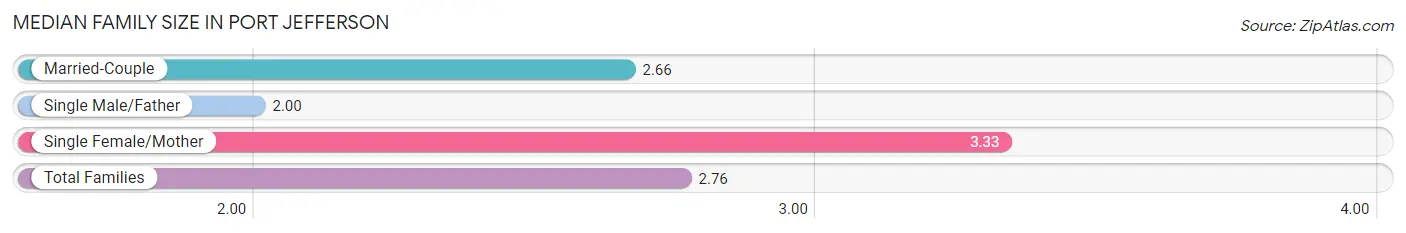
| Family Type | # Families | Family Size |
| Married-Couple | 70 (80.5%) | 2.66 |
| Single Male/Father | 2 (2.3%) | 2.00 |
| Single Female/Mother | 15 (17.2%) | 3.33 |
| Total Families | 87 (100.0%) | 2.76 |
Median Household Size in Port Jefferson
The median household size in Port Jefferson is 2.02 persons per household, with single female/mother households (15 | 7.8%) accounting for the largest median household size of 3.4 persons per household. non-family households (105 | 54.7%) represent the smallest median household size with 1.37 persons per household.
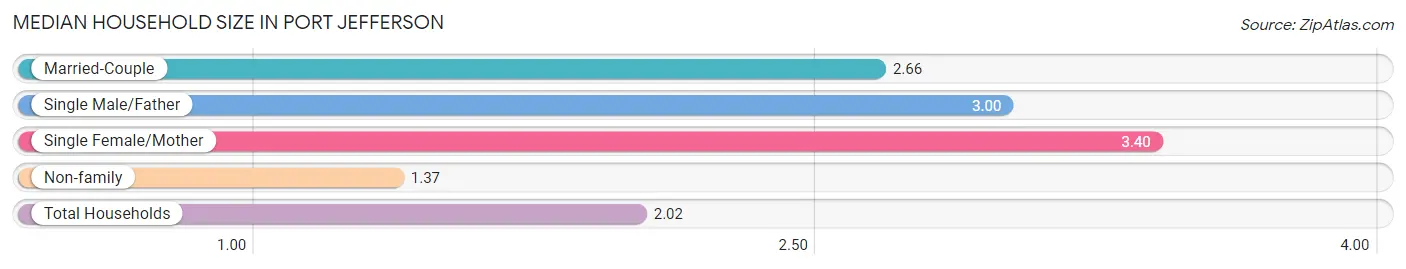
| Household Type | # Households | Household Size |
| Married-Couple | 70 (36.5%) | 2.66 |
| Single Male/Father | 2 (1.0%) | 3.00 |
| Single Female/Mother | 15 (7.8%) | 3.40 |
| Non-family | 105 (54.7%) | 1.37 |
| Total Households | 192 (100.0%) | 2.02 |
Household Size by Marriage Status in Port Jefferson
Out of a total of 192 households in Port Jefferson, 87 (45.3%) are family households, while 105 (54.7%) are nonfamily households. The most numerous type of family households are 2-person households, comprising 47, and the most common type of nonfamily households are 1-person households, comprising 90.
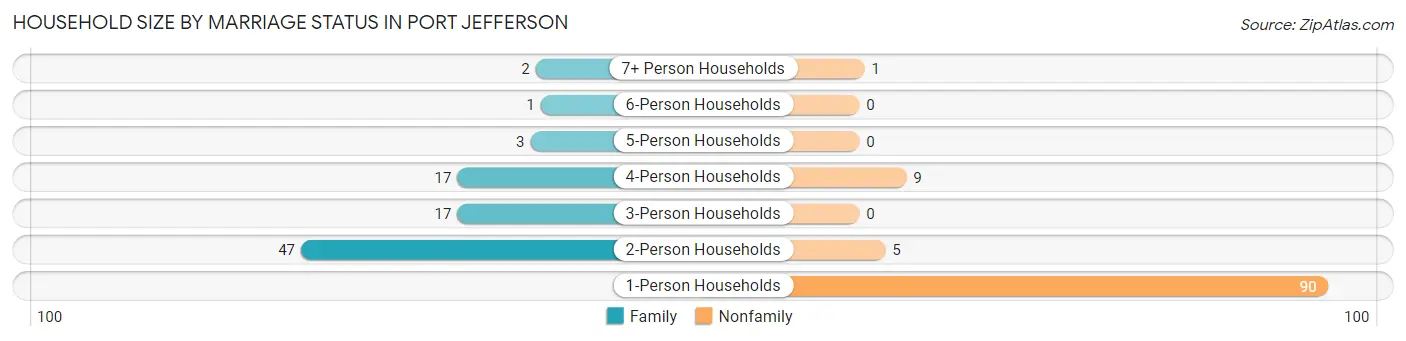
| Household Size | Family Households | Nonfamily Households |
| 1-Person Households | - | 90 (46.9%) |
| 2-Person Households | 47 (24.5%) | 5 (2.6%) |
| 3-Person Households | 17 (8.8%) | 0 (0.0%) |
| 4-Person Households | 17 (8.8%) | 9 (4.7%) |
| 5-Person Households | 3 (1.6%) | 0 (0.0%) |
| 6-Person Households | 1 (0.5%) | 0 (0.0%) |
| 7+ Person Households | 2 (1.0%) | 1 (0.5%) |
| Total | 87 (45.3%) | 105 (54.7%) |
Female Fertility in Port Jefferson
Fertility by Age in Port Jefferson
Average fertility rate in Port Jefferson is 34.0 births per 1,000 women. Women in the age bracket of 35 to 50 years have the highest fertility rate with 60.0 births per 1,000 women. Women in the age bracket of 35 to 50 years acount for 100.0% of all women with births.
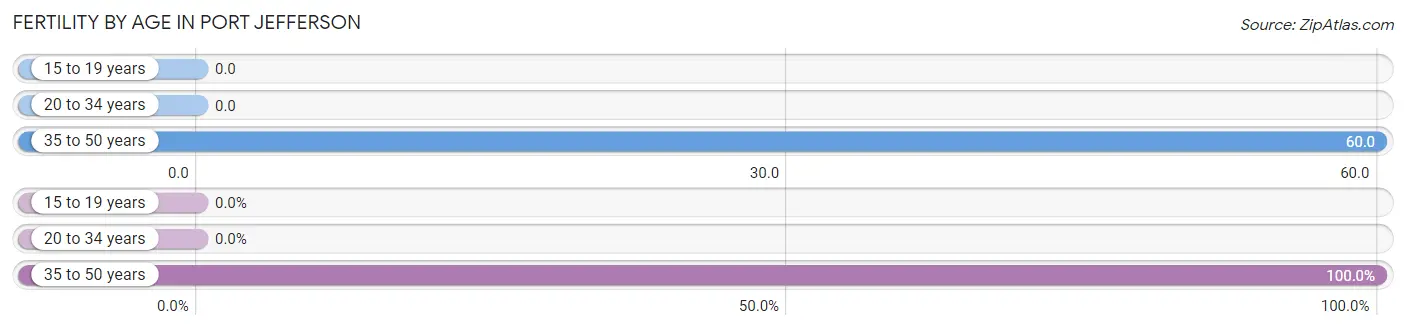
| Age Bracket | Women with Births | Births / 1,000 Women |
| 15 to 19 years | 0 (0.0%) | 0.0 |
| 20 to 34 years | 0 (0.0%) | 0.0 |
| 35 to 50 years | 3 (100.0%) | 60.0 |
| Total | 3 (100.0%) | 34.0 |
Fertility by Age by Marriage Status in Port Jefferson
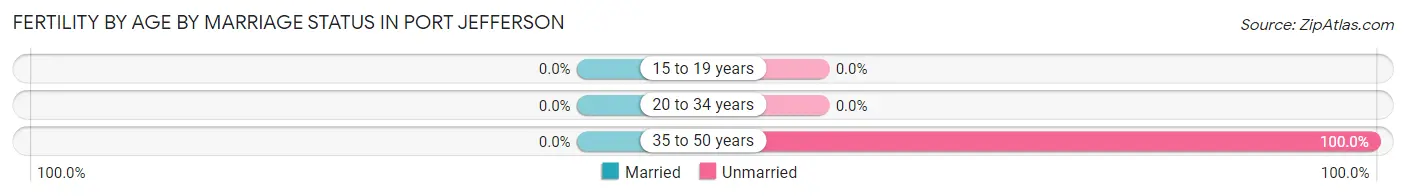
| Age Bracket | Married | Unmarried |
| 15 to 19 years | 0 (0.0%) | 0 (0.0%) |
| 20 to 34 years | 0 (0.0%) | 0 (0.0%) |
| 35 to 50 years | 0 (0.0%) | 3 (100.0%) |
| Total | 0 (0.0%) | 3 (100.0%) |
Fertility by Education in Port Jefferson
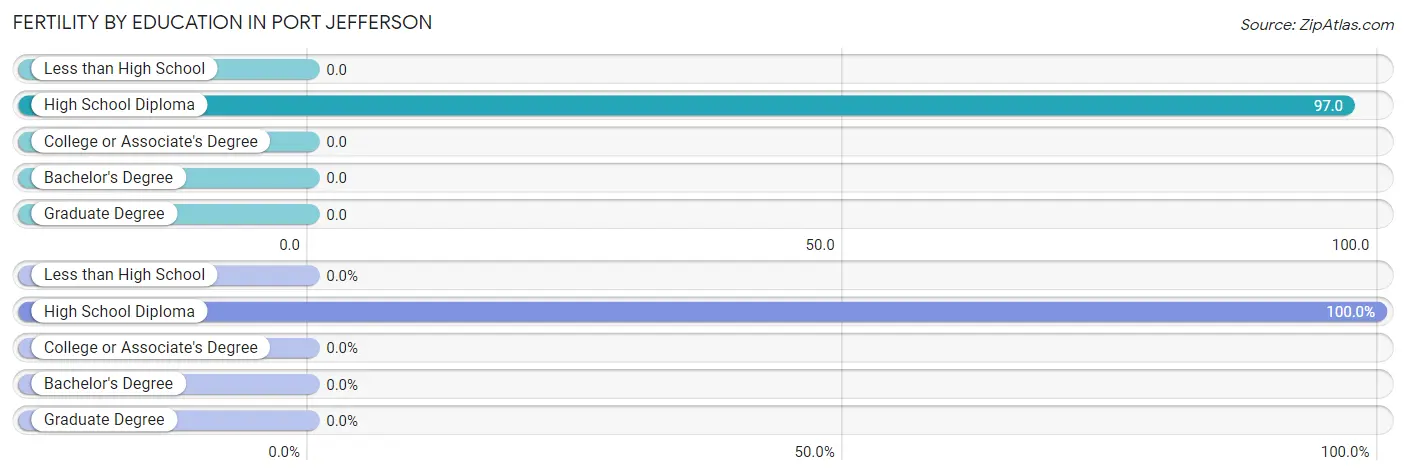
| Educational Attainment | Women with Births | Births / 1,000 Women |
| Less than High School | 0 (0.0%) | 0.0 |
| High School Diploma | 3 (100.0%) | 97.0 |
| College or Associate's Degree | 0 (0.0%) | 0.0 |
| Bachelor's Degree | 0 (0.0%) | 0.0 |
| Graduate Degree | 0 (0.0%) | 0.0 |
| Total | 3 (100.0%) | 34.0 |
Fertility by Education by Marriage Status in Port Jefferson
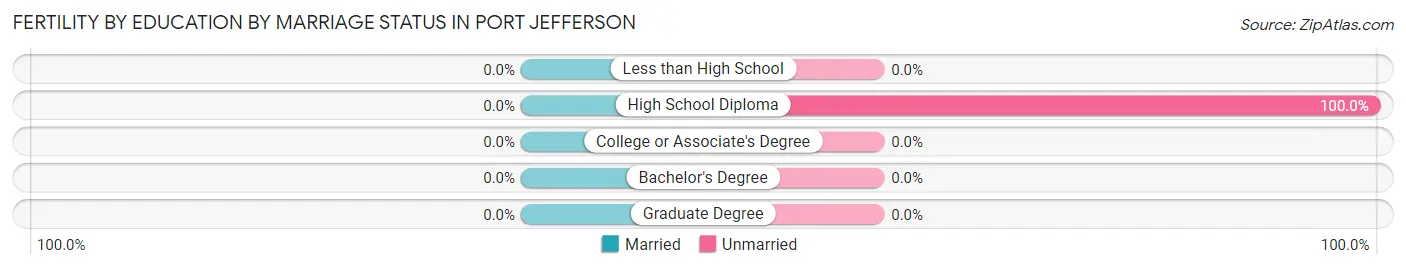
| Educational Attainment | Married | Unmarried |
| Less than High School | 0 (0.0%) | 0 (0.0%) |
| High School Diploma | 0 (0.0%) | 3 (100.0%) |
| College or Associate's Degree | 0 (0.0%) | 0 (0.0%) |
| Bachelor's Degree | 0 (0.0%) | 0 (0.0%) |
| Graduate Degree | 0 (0.0%) | 0 (0.0%) |
| Total | 0 (0.0%) | 3 (100.0%) |
Employment Characteristics in Port Jefferson
Employment by Class of Employer in Port Jefferson
Among the 176 employed individuals in Port Jefferson, private company employees (145 | 82.4%), local government employees (12 | 6.8%), and not-for-profit organizations (11 | 6.2%) make up the most common classes of employment.
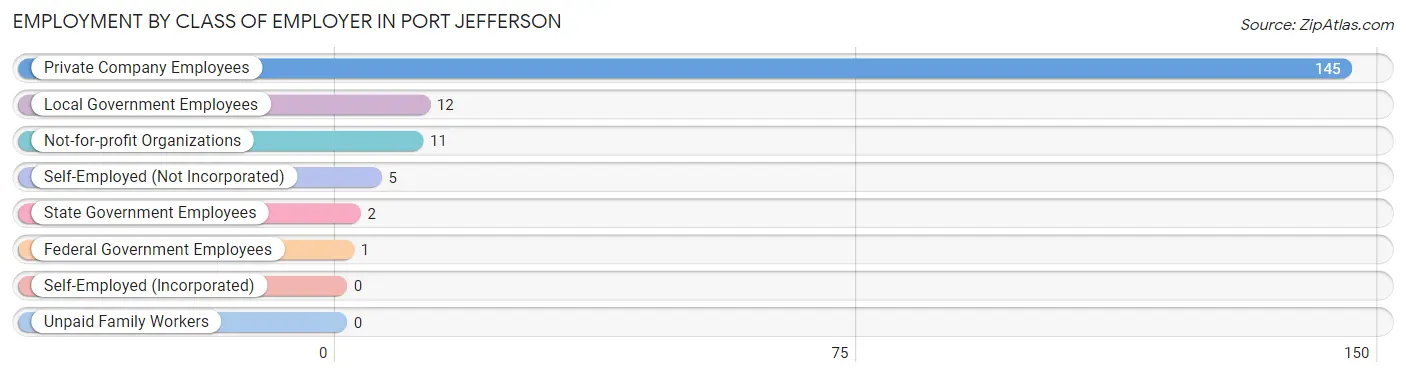
| Employer Class | # Employees | % Employees |
| Private Company Employees | 145 | 82.4% |
| Self-Employed (Incorporated) | 0 | 0.0% |
| Self-Employed (Not Incorporated) | 5 | 2.8% |
| Not-for-profit Organizations | 11 | 6.2% |
| Local Government Employees | 12 | 6.8% |
| State Government Employees | 2 | 1.1% |
| Federal Government Employees | 1 | 0.6% |
| Unpaid Family Workers | 0 | 0.0% |
| Total | 176 | 100.0% |
Employment Status by Age in Port Jefferson
According to the labor force statistics for Port Jefferson, out of the total population over 16 years of age (335), 60.6% or 203 individuals are in the labor force, with 13.3% or 27 of them unemployed. The age group with the highest labor force participation rate is 16 to 19 years, with 100.0% or 13 individuals in the labor force. Within the labor force, the 25 to 29 years age range has the highest percentage of unemployed individuals, with 53.6% or 15 of them being unemployed.
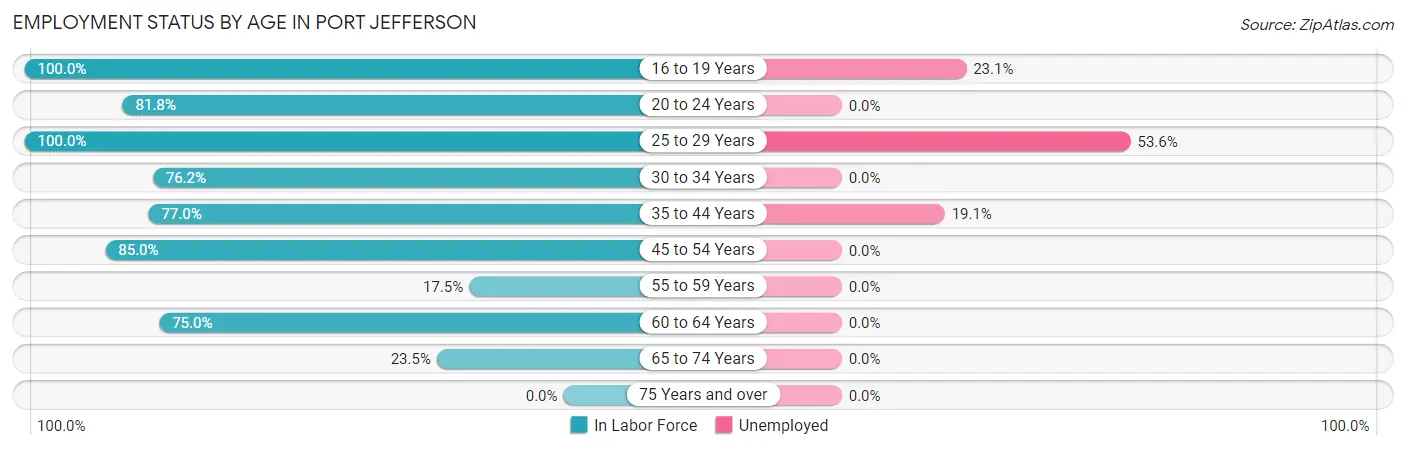
| Age Bracket | In Labor Force | Unemployed |
| 16 to 19 Years | 13 (100.0%) | 3 (23.1%) |
| 20 to 24 Years | 9 (81.8%) | 0 (0.0%) |
| 25 to 29 Years | 28 (100.0%) | 15 (53.6%) |
| 30 to 34 Years | 16 (76.2%) | 0 (0.0%) |
| 35 to 44 Years | 47 (77.0%) | 9 (19.1%) |
| 45 to 54 Years | 51 (85.0%) | 0 (0.0%) |
| 55 to 59 Years | 10 (17.5%) | 0 (0.0%) |
| 60 to 64 Years | 21 (75.0%) | 0 (0.0%) |
| 65 to 74 Years | 8 (23.5%) | 0 (0.0%) |
| 75 Years and over | 0 (0.0%) | 0 (0.0%) |
| Total | 203 (60.6%) | 27 (13.3%) |
Employment Status by Educational Attainment in Port Jefferson
According to labor force statistics for Port Jefferson, 67.8% of individuals (173) out of the total population between 25 and 64 years of age (255) are in the labor force, with 13.9% or 24 of them being unemployed. The group with the highest labor force participation rate are those with the educational attainment of bachelor's degree or higher, with 100.0% or 11 individuals in the labor force. Within the labor force, individuals with less than high school education have the highest percentage of unemployment, with 66.7% or 8 of them being unemployed.
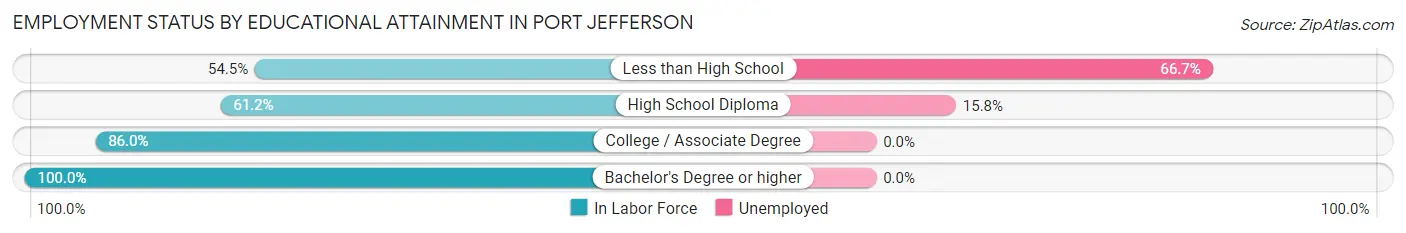
| Educational Attainment | In Labor Force | Unemployed |
| Less than High School | 12 (54.5%) | 15 (66.7%) |
| High School Diploma | 101 (61.2%) | 26 (15.8%) |
| College / Associate Degree | 49 (86.0%) | 0 (0.0%) |
| Bachelor's Degree or higher | 11 (100.0%) | 0 (0.0%) |
| Total | 173 (67.8%) | 35 (13.9%) |
Employment Occupations by Sex in Port Jefferson
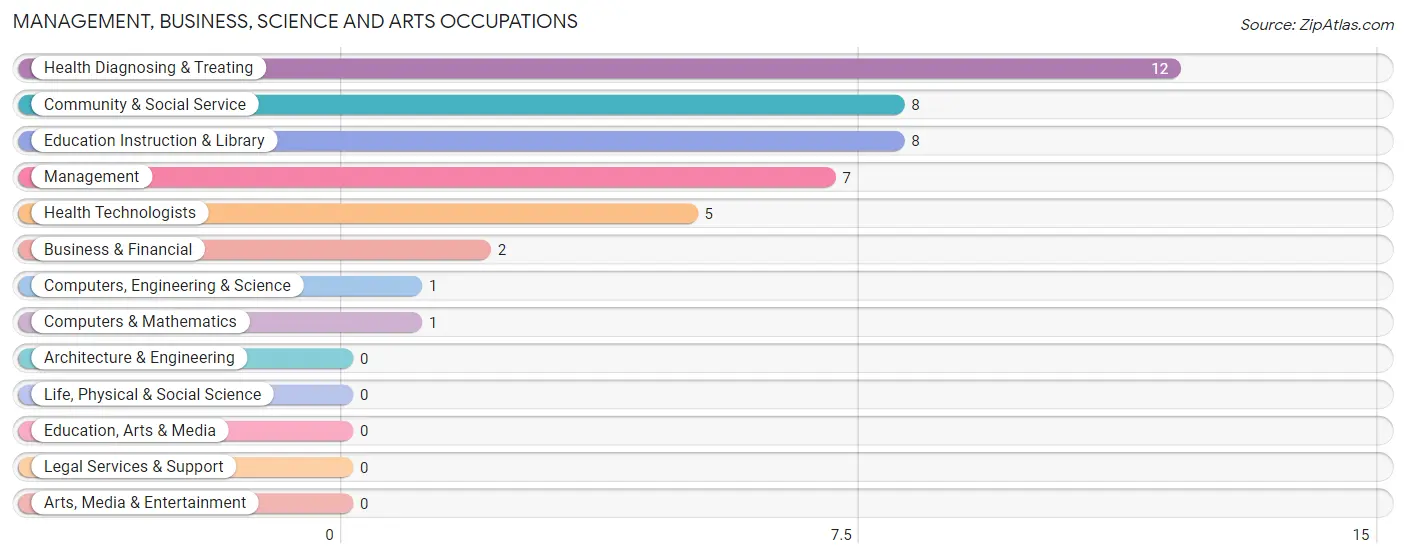
Management, Business, Science and Arts Occupations
The most common Management, Business, Science and Arts occupations in Port Jefferson are Health Diagnosing & Treating (12 | 6.8%), Community & Social Service (8 | 4.5%), Education Instruction & Library (8 | 4.5%), Management (7 | 4.0%), and Health Technologists (5 | 2.8%).
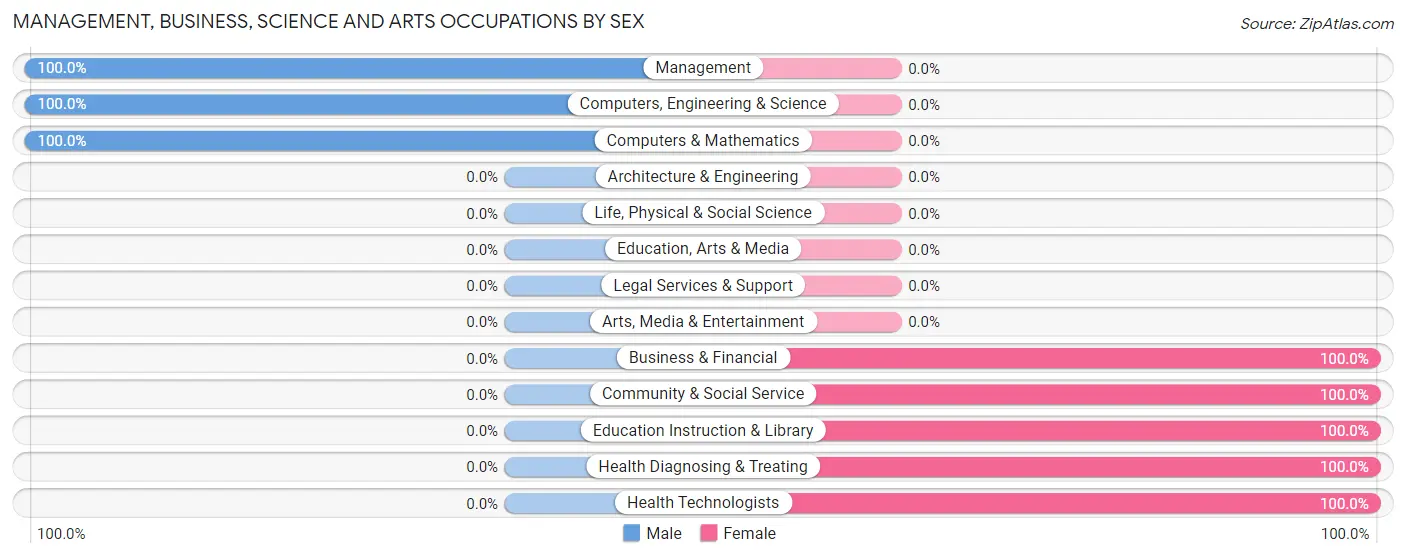
Management, Business, Science and Arts Occupations by Sex
Within the Management, Business, Science and Arts occupations in Port Jefferson, the most male-oriented occupations are Management (100.0%), Computers, Engineering & Science (100.0%), and Computers & Mathematics (100.0%), while the most female-oriented occupations are Business & Financial (100.0%), Community & Social Service (100.0%), and Education Instruction & Library (100.0%).
| Occupation | Male | Female |
| Management | 7 (100.0%) | 0 (0.0%) |
| Business & Financial | 0 (0.0%) | 2 (100.0%) |
| Computers, Engineering & Science | 1 (100.0%) | 0 (0.0%) |
| Computers & Mathematics | 1 (100.0%) | 0 (0.0%) |
| Architecture & Engineering | 0 (0.0%) | 0 (0.0%) |
| Life, Physical & Social Science | 0 (0.0%) | 0 (0.0%) |
| Community & Social Service | 0 (0.0%) | 8 (100.0%) |
| Education, Arts & Media | 0 (0.0%) | 0 (0.0%) |
| Legal Services & Support | 0 (0.0%) | 0 (0.0%) |
| Education Instruction & Library | 0 (0.0%) | 8 (100.0%) |
| Arts, Media & Entertainment | 0 (0.0%) | 0 (0.0%) |
| Health Diagnosing & Treating | 0 (0.0%) | 12 (100.0%) |
| Health Technologists | 0 (0.0%) | 5 (100.0%) |
| Total (Category) | 8 (26.7%) | 22 (73.3%) |
| Total (Overall) | 91 (51.7%) | 85 (48.3%) |
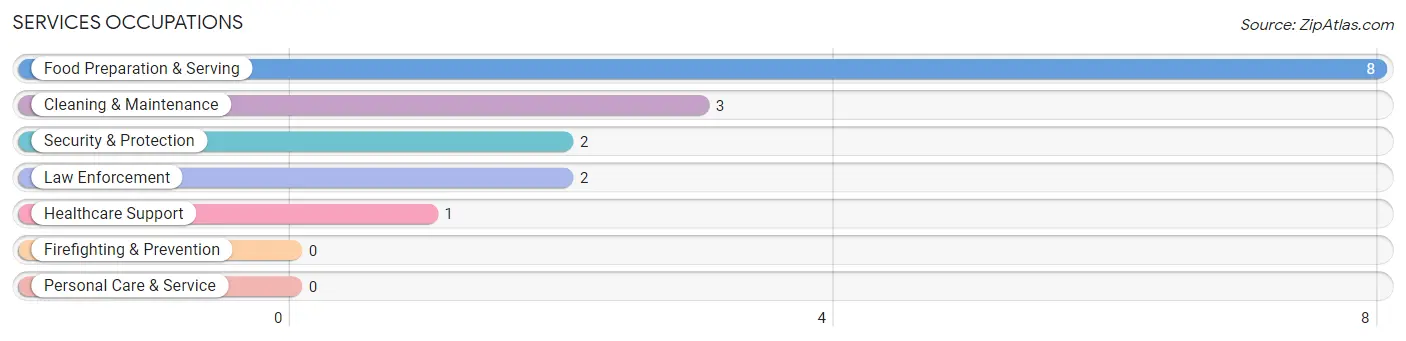
Services Occupations
The most common Services occupations in Port Jefferson are Food Preparation & Serving (8 | 4.5%), Cleaning & Maintenance (3 | 1.7%), Security & Protection (2 | 1.1%), Law Enforcement (2 | 1.1%), and Healthcare Support (1 | 0.6%).
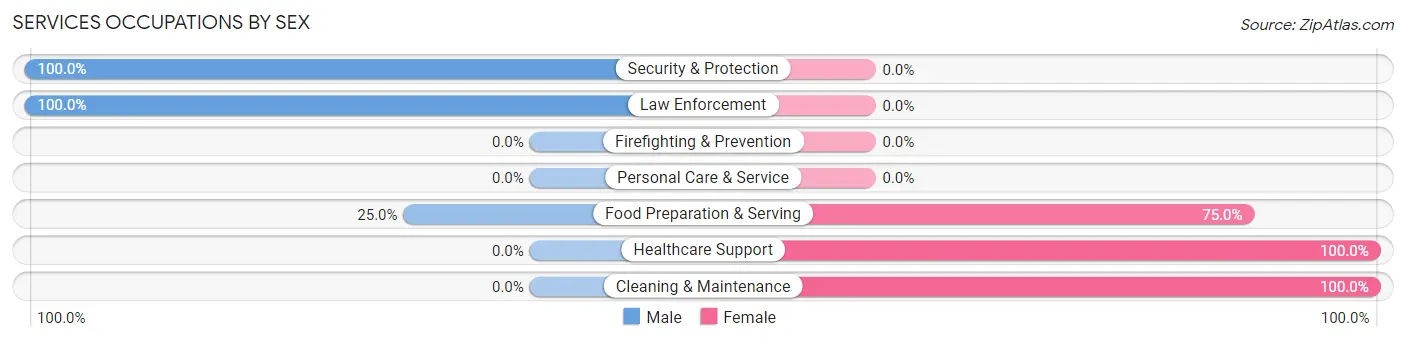
Services Occupations by Sex
Within the Services occupations in Port Jefferson, the most male-oriented occupations are Security & Protection (100.0%), Law Enforcement (100.0%), and Food Preparation & Serving (25.0%), while the most female-oriented occupations are Healthcare Support (100.0%), Cleaning & Maintenance (100.0%), and Food Preparation & Serving (75.0%).
| Occupation | Male | Female |
| Healthcare Support | 0 (0.0%) | 1 (100.0%) |
| Security & Protection | 2 (100.0%) | 0 (0.0%) |
| Firefighting & Prevention | 0 (0.0%) | 0 (0.0%) |
| Law Enforcement | 2 (100.0%) | 0 (0.0%) |
| Food Preparation & Serving | 2 (25.0%) | 6 (75.0%) |
| Cleaning & Maintenance | 0 (0.0%) | 3 (100.0%) |
| Personal Care & Service | 0 (0.0%) | 0 (0.0%) |
| Total (Category) | 4 (28.6%) | 10 (71.4%) |
| Total (Overall) | 91 (51.7%) | 85 (48.3%) |
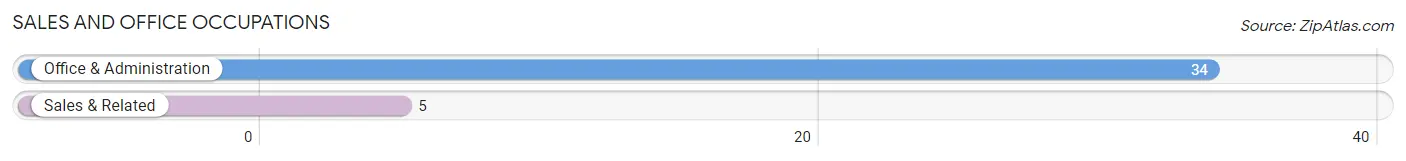
Sales and Office Occupations
The most common Sales and Office occupations in Port Jefferson are Office & Administration (34 | 19.3%), and Sales & Related (5 | 2.8%).
Sales and Office Occupations by Sex
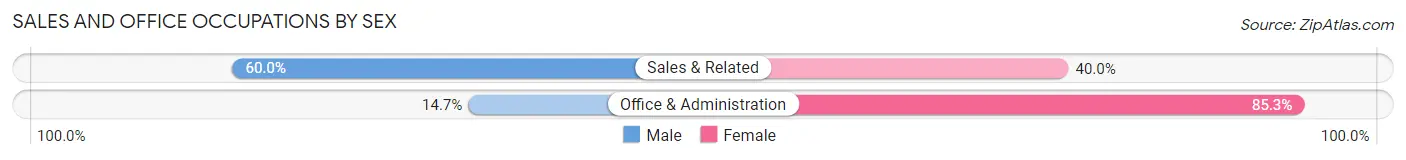
| Occupation | Male | Female |
| Sales & Related | 3 (60.0%) | 2 (40.0%) |
| Office & Administration | 5 (14.7%) | 29 (85.3%) |
| Total (Category) | 8 (20.5%) | 31 (79.5%) |
| Total (Overall) | 91 (51.7%) | 85 (48.3%) |
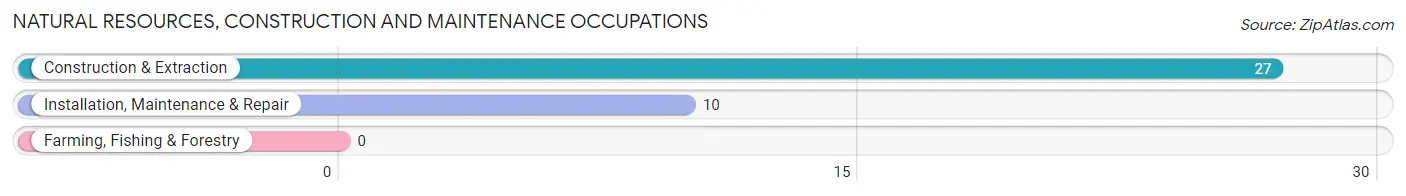
Natural Resources, Construction and Maintenance Occupations
The most common Natural Resources, Construction and Maintenance occupations in Port Jefferson are Construction & Extraction (27 | 15.3%), and Installation, Maintenance & Repair (10 | 5.7%).
Natural Resources, Construction and Maintenance Occupations by Sex
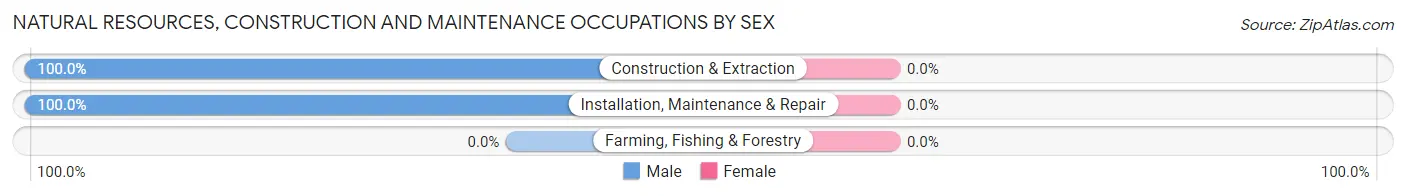
| Occupation | Male | Female |
| Farming, Fishing & Forestry | 0 (0.0%) | 0 (0.0%) |
| Construction & Extraction | 27 (100.0%) | 0 (0.0%) |
| Installation, Maintenance & Repair | 10 (100.0%) | 0 (0.0%) |
| Total (Category) | 37 (100.0%) | 0 (0.0%) |
| Total (Overall) | 91 (51.7%) | 85 (48.3%) |
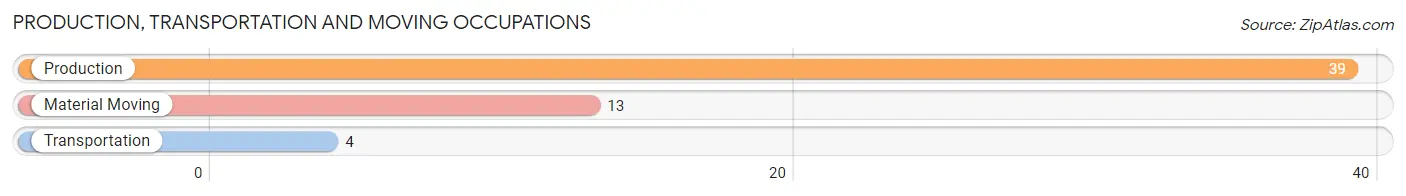
Production, Transportation and Moving Occupations
The most common Production, Transportation and Moving occupations in Port Jefferson are Production (39 | 22.2%), Material Moving (13 | 7.4%), and Transportation (4 | 2.3%).
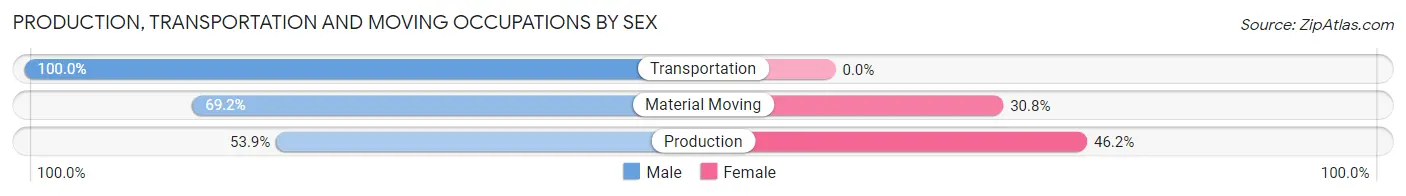
Production, Transportation and Moving Occupations by Sex
| Occupation | Male | Female |
| Production | 21 (53.8%) | 18 (46.2%) |
| Transportation | 4 (100.0%) | 0 (0.0%) |
| Material Moving | 9 (69.2%) | 4 (30.8%) |
| Total (Category) | 34 (60.7%) | 22 (39.3%) |
| Total (Overall) | 91 (51.7%) | 85 (48.3%) |
Employment Industries by Sex in Port Jefferson
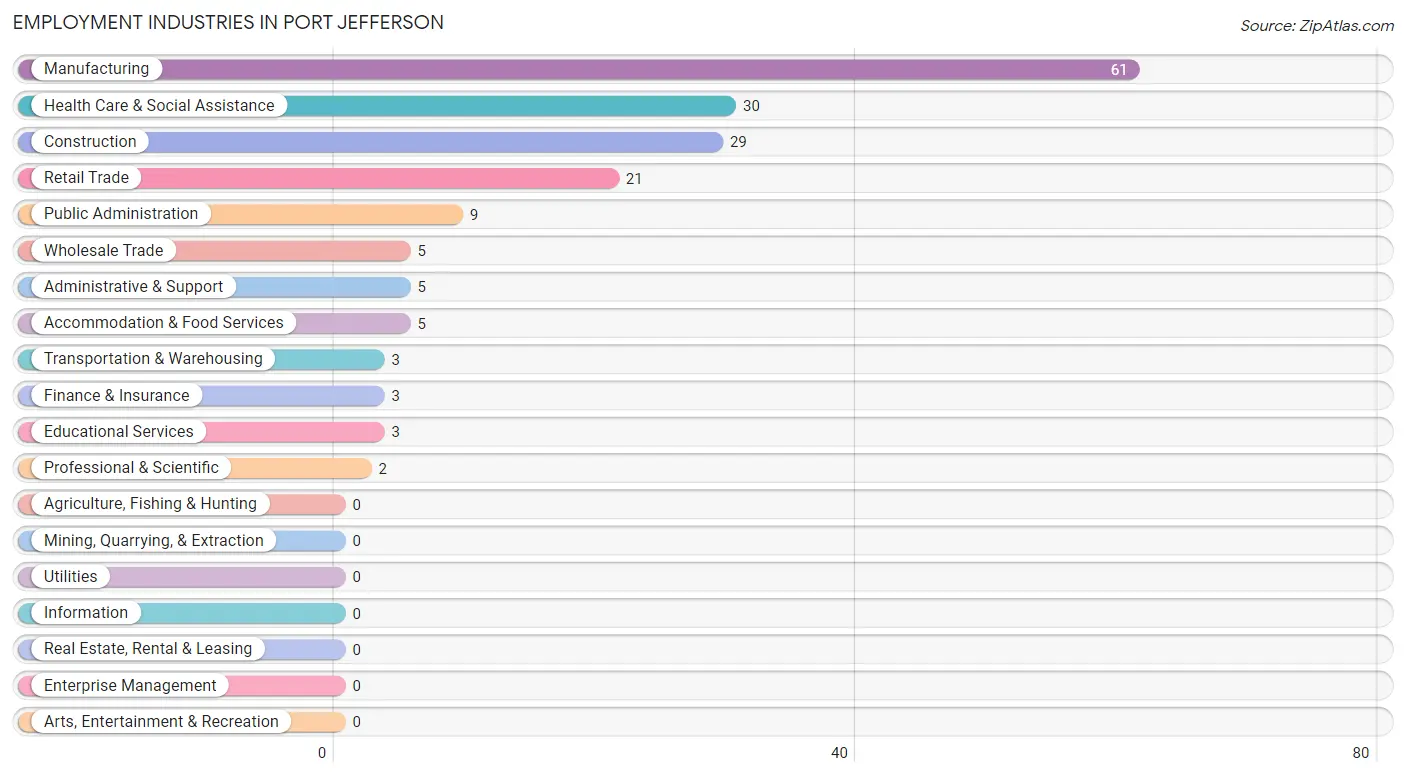
Employment Industries in Port Jefferson
The major employment industries in Port Jefferson include Manufacturing (61 | 34.7%), Health Care & Social Assistance (30 | 17.1%), Construction (29 | 16.5%), Retail Trade (21 | 11.9%), and Public Administration (9 | 5.1%).
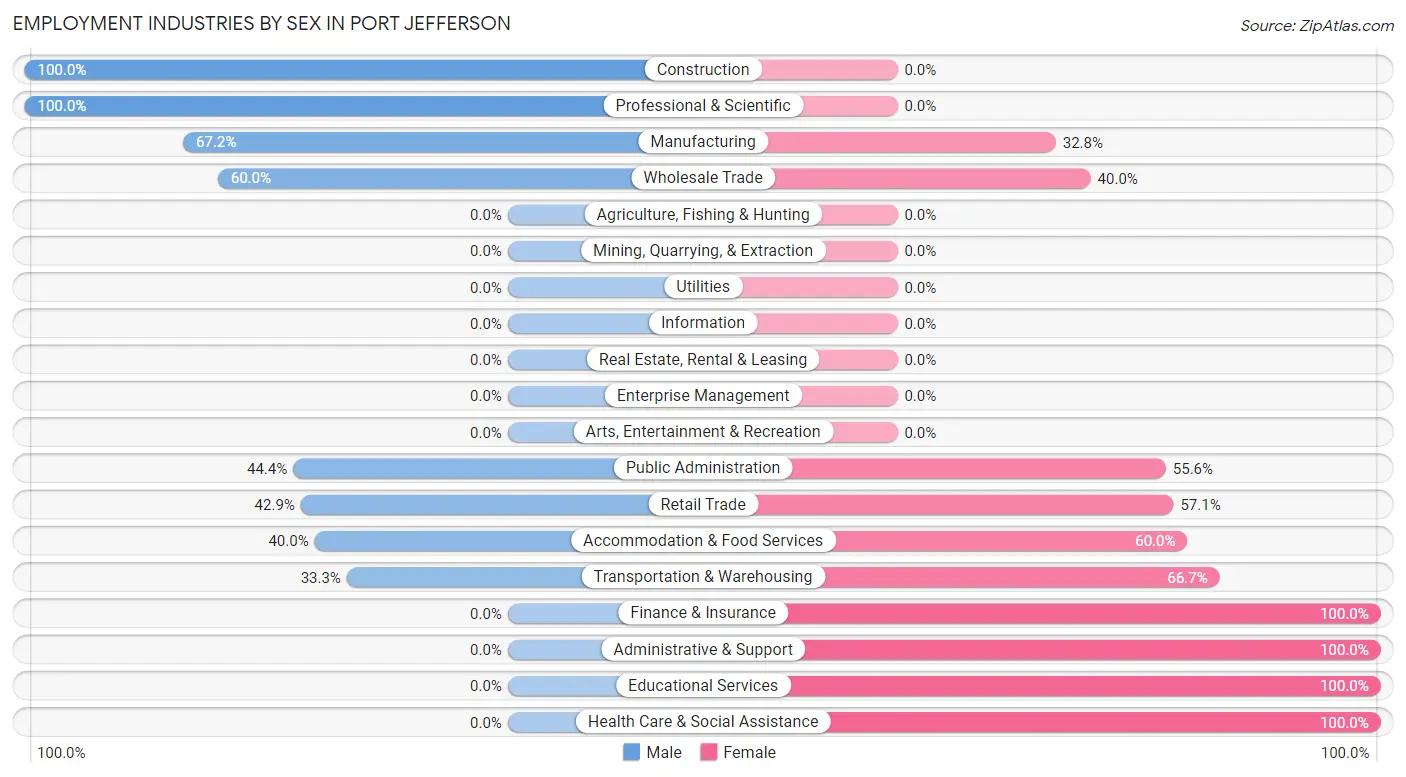
Employment Industries by Sex in Port Jefferson
The Port Jefferson industries that see more men than women are Construction (100.0%), Professional & Scientific (100.0%), and Manufacturing (67.2%), whereas the industries that tend to have a higher number of women are Finance & Insurance (100.0%), Administrative & Support (100.0%), and Educational Services (100.0%).
| Industry | Male | Female |
| Agriculture, Fishing & Hunting | 0 (0.0%) | 0 (0.0%) |
| Mining, Quarrying, & Extraction | 0 (0.0%) | 0 (0.0%) |
| Construction | 29 (100.0%) | 0 (0.0%) |
| Manufacturing | 41 (67.2%) | 20 (32.8%) |
| Wholesale Trade | 3 (60.0%) | 2 (40.0%) |
| Retail Trade | 9 (42.9%) | 12 (57.1%) |
| Transportation & Warehousing | 1 (33.3%) | 2 (66.7%) |
| Utilities | 0 (0.0%) | 0 (0.0%) |
| Information | 0 (0.0%) | 0 (0.0%) |
| Finance & Insurance | 0 (0.0%) | 3 (100.0%) |
| Real Estate, Rental & Leasing | 0 (0.0%) | 0 (0.0%) |
| Professional & Scientific | 2 (100.0%) | 0 (0.0%) |
| Enterprise Management | 0 (0.0%) | 0 (0.0%) |
| Administrative & Support | 0 (0.0%) | 5 (100.0%) |
| Educational Services | 0 (0.0%) | 3 (100.0%) |
| Health Care & Social Assistance | 0 (0.0%) | 30 (100.0%) |
| Arts, Entertainment & Recreation | 0 (0.0%) | 0 (0.0%) |
| Accommodation & Food Services | 2 (40.0%) | 3 (60.0%) |
| Public Administration | 4 (44.4%) | 5 (55.6%) |
| Total | 91 (51.7%) | 85 (48.3%) |
Education in Port Jefferson
School Enrollment in Port Jefferson
The most common levels of schooling among the 75 students in Port Jefferson are middle school (22 | 29.3%), high school (22 | 29.3%), and elementary school (16 | 21.3%).
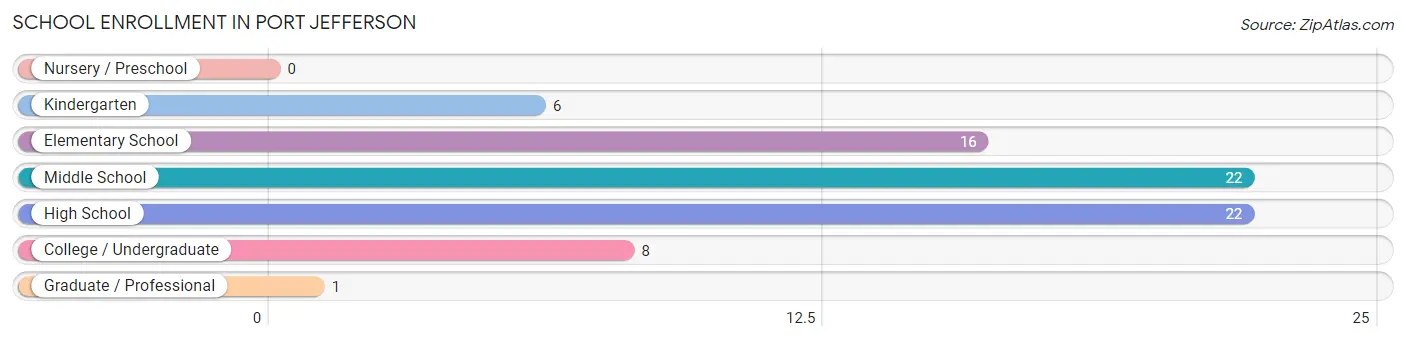
| School Level | # Students | % Students |
| Nursery / Preschool | 0 | 0.0% |
| Kindergarten | 6 | 8.0% |
| Elementary School | 16 | 21.3% |
| Middle School | 22 | 29.3% |
| High School | 22 | 29.3% |
| College / Undergraduate | 8 | 10.7% |
| Graduate / Professional | 1 | 1.3% |
| Total | 75 | 100.0% |
School Enrollment by Age by Funding Source in Port Jefferson
Out of a total of 75 students who are enrolled in schools in Port Jefferson, 2 (2.7%) attend a private institution, while the remaining 73 (97.3%) are enrolled in public schools. The age group of 35 years and over has the highest likelihood of being enrolled in private schools, with 2 (66.7% in the age bracket) enrolled. Conversely, the age group of 5 to 9 year old has the lowest likelihood of being enrolled in a private school, with 22 (100.0% in the age bracket) attending a public institution.
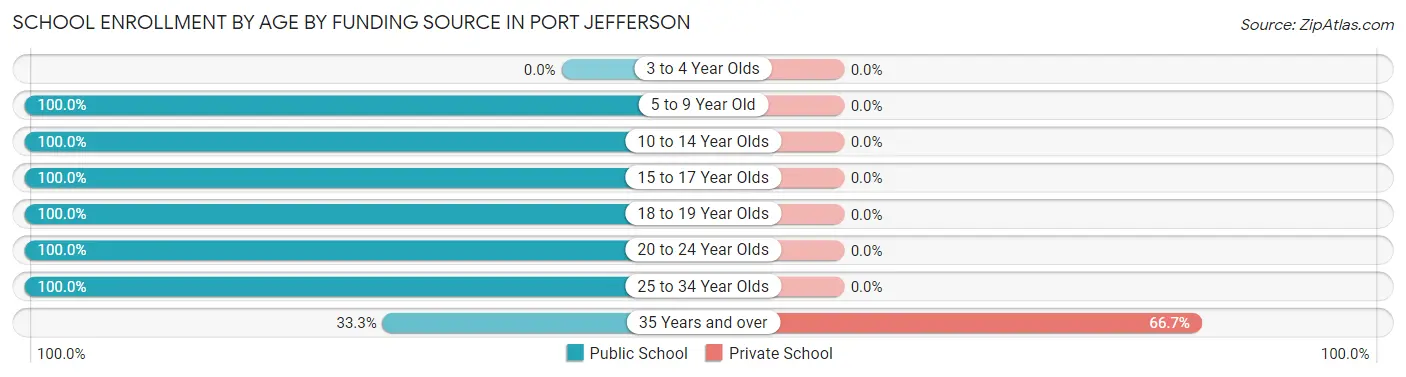
| Age Bracket | Public School | Private School |
| 3 to 4 Year Olds | 0 (0.0%) | 0 (0.0%) |
| 5 to 9 Year Old | 22 (100.0%) | 0 (0.0%) |
| 10 to 14 Year Olds | 22 (100.0%) | 0 (0.0%) |
| 15 to 17 Year Olds | 5 (100.0%) | 0 (0.0%) |
| 18 to 19 Year Olds | 7 (100.0%) | 0 (0.0%) |
| 20 to 24 Year Olds | 3 (100.0%) | 0 (0.0%) |
| 25 to 34 Year Olds | 13 (100.0%) | 0 (0.0%) |
| 35 Years and over | 1 (33.3%) | 2 (66.7%) |
| Total | 73 (97.3%) | 2 (2.7%) |
Educational Attainment by Field of Study in Port Jefferson
Business (6 | 46.2%), education (3 | 23.1%), science & technology (2 | 15.4%), psychology (1 | 7.7%), and arts & humanities (1 | 7.7%) are the most common fields of study among 13 individuals in Port Jefferson who have obtained a bachelor's degree or higher.
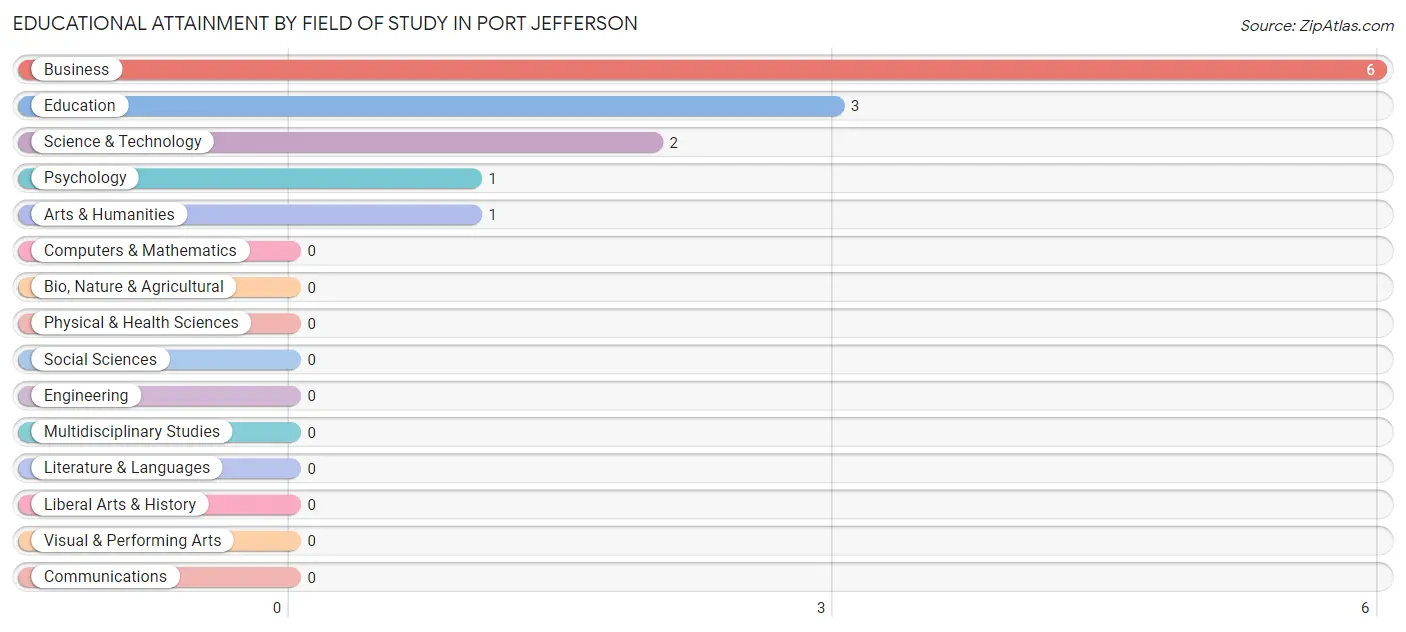
| Field of Study | # Graduates | % Graduates |
| Computers & Mathematics | 0 | 0.0% |
| Bio, Nature & Agricultural | 0 | 0.0% |
| Physical & Health Sciences | 0 | 0.0% |
| Psychology | 1 | 7.7% |
| Social Sciences | 0 | 0.0% |
| Engineering | 0 | 0.0% |
| Multidisciplinary Studies | 0 | 0.0% |
| Science & Technology | 2 | 15.4% |
| Business | 6 | 46.2% |
| Education | 3 | 23.1% |
| Literature & Languages | 0 | 0.0% |
| Liberal Arts & History | 0 | 0.0% |
| Visual & Performing Arts | 0 | 0.0% |
| Communications | 0 | 0.0% |
| Arts & Humanities | 1 | 7.7% |
| Total | 13 | 100.0% |
Transportation & Commute in Port Jefferson
Vehicle Availability by Sex in Port Jefferson
The most prevalent vehicle ownership categories in Port Jefferson are males with 1 vehicle (28, accounting for 30.8%) and females with 1 vehicle (6, making up 32.9%).
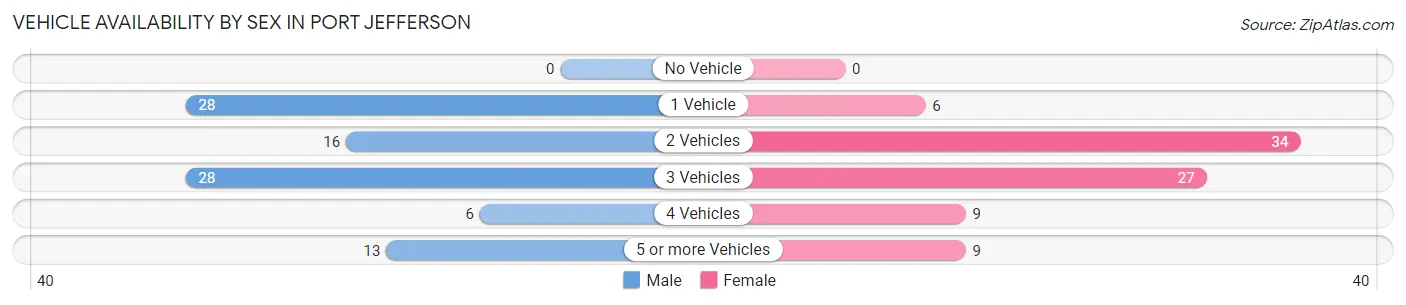
| Vehicles Available | Male | Female |
| No Vehicle | 0 (0.0%) | 0 (0.0%) |
| 1 Vehicle | 28 (30.8%) | 6 (7.1%) |
| 2 Vehicles | 16 (17.6%) | 34 (40.0%) |
| 3 Vehicles | 28 (30.8%) | 27 (31.8%) |
| 4 Vehicles | 6 (6.6%) | 9 (10.6%) |
| 5 or more Vehicles | 13 (14.3%) | 9 (10.6%) |
| Total | 91 (100.0%) | 85 (100.0%) |
Commute Time in Port Jefferson
The most frequently occuring commute durations in Port Jefferson are 15 to 19 minutes (59 commuters, 33.5%), 10 to 14 minutes (57 commuters, 32.4%), and 20 to 24 minutes (14 commuters, 8.0%).
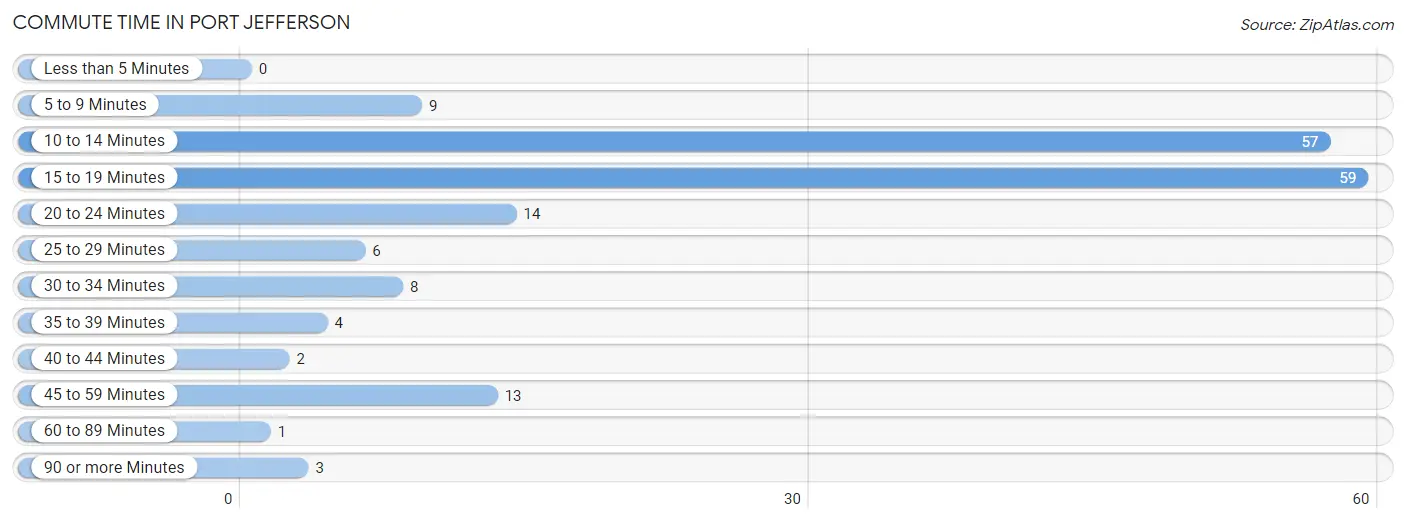
| Commute Time | # Commuters | % Commuters |
| Less than 5 Minutes | 0 | 0.0% |
| 5 to 9 Minutes | 9 | 5.1% |
| 10 to 14 Minutes | 57 | 32.4% |
| 15 to 19 Minutes | 59 | 33.5% |
| 20 to 24 Minutes | 14 | 8.0% |
| 25 to 29 Minutes | 6 | 3.4% |
| 30 to 34 Minutes | 8 | 4.5% |
| 35 to 39 Minutes | 4 | 2.3% |
| 40 to 44 Minutes | 2 | 1.1% |
| 45 to 59 Minutes | 13 | 7.4% |
| 60 to 89 Minutes | 1 | 0.6% |
| 90 or more Minutes | 3 | 1.7% |
Commute Time by Sex in Port Jefferson
The most common commute times in Port Jefferson are 10 to 14 minutes (33 commuters, 36.3%) for males and 15 to 19 minutes (31 commuters, 36.5%) for females.
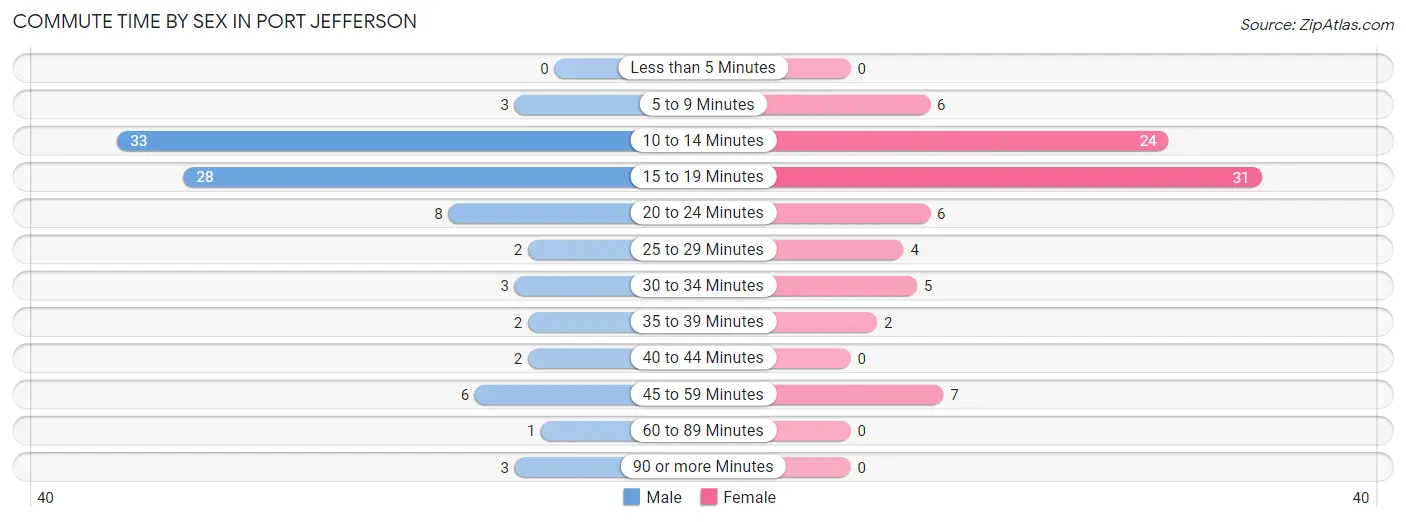
| Commute Time | Male | Female |
| Less than 5 Minutes | 0 (0.0%) | 0 (0.0%) |
| 5 to 9 Minutes | 3 (3.3%) | 6 (7.1%) |
| 10 to 14 Minutes | 33 (36.3%) | 24 (28.2%) |
| 15 to 19 Minutes | 28 (30.8%) | 31 (36.5%) |
| 20 to 24 Minutes | 8 (8.8%) | 6 (7.1%) |
| 25 to 29 Minutes | 2 (2.2%) | 4 (4.7%) |
| 30 to 34 Minutes | 3 (3.3%) | 5 (5.9%) |
| 35 to 39 Minutes | 2 (2.2%) | 2 (2.4%) |
| 40 to 44 Minutes | 2 (2.2%) | 0 (0.0%) |
| 45 to 59 Minutes | 6 (6.6%) | 7 (8.2%) |
| 60 to 89 Minutes | 1 (1.1%) | 0 (0.0%) |
| 90 or more Minutes | 3 (3.3%) | 0 (0.0%) |
Time of Departure to Work by Sex in Port Jefferson
The most frequent times of departure to work in Port Jefferson are 5:30 AM to 5:59 AM (42, 46.2%) for males and 6:00 AM to 6:29 AM (15, 17.6%) for females.
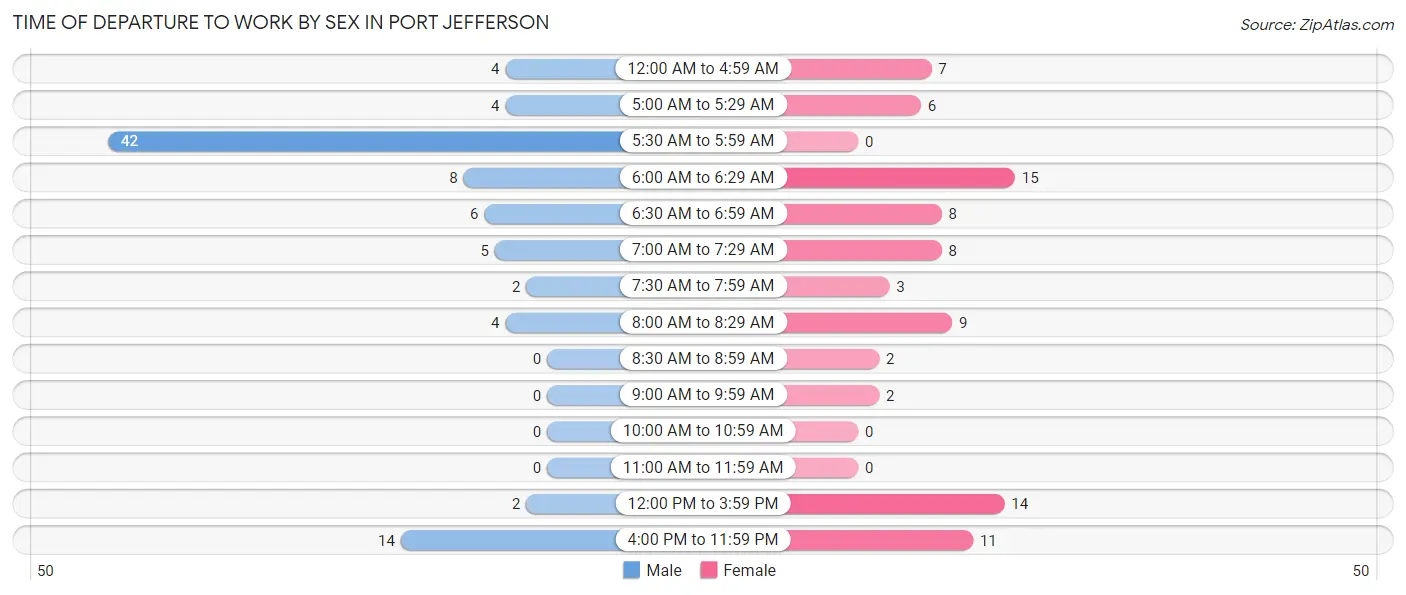
| Time of Departure | Male | Female |
| 12:00 AM to 4:59 AM | 4 (4.4%) | 7 (8.2%) |
| 5:00 AM to 5:29 AM | 4 (4.4%) | 6 (7.1%) |
| 5:30 AM to 5:59 AM | 42 (46.2%) | 0 (0.0%) |
| 6:00 AM to 6:29 AM | 8 (8.8%) | 15 (17.6%) |
| 6:30 AM to 6:59 AM | 6 (6.6%) | 8 (9.4%) |
| 7:00 AM to 7:29 AM | 5 (5.5%) | 8 (9.4%) |
| 7:30 AM to 7:59 AM | 2 (2.2%) | 3 (3.5%) |
| 8:00 AM to 8:29 AM | 4 (4.4%) | 9 (10.6%) |
| 8:30 AM to 8:59 AM | 0 (0.0%) | 2 (2.4%) |
| 9:00 AM to 9:59 AM | 0 (0.0%) | 2 (2.4%) |
| 10:00 AM to 10:59 AM | 0 (0.0%) | 0 (0.0%) |
| 11:00 AM to 11:59 AM | 0 (0.0%) | 0 (0.0%) |
| 12:00 PM to 3:59 PM | 2 (2.2%) | 14 (16.5%) |
| 4:00 PM to 11:59 PM | 14 (15.4%) | 11 (12.9%) |
| Total | 91 (100.0%) | 85 (100.0%) |
Housing Occupancy in Port Jefferson
Occupancy by Ownership in Port Jefferson
Of the total 192 dwellings in Port Jefferson, owner-occupied units account for 163 (84.9%), while renter-occupied units make up 29 (15.1%).
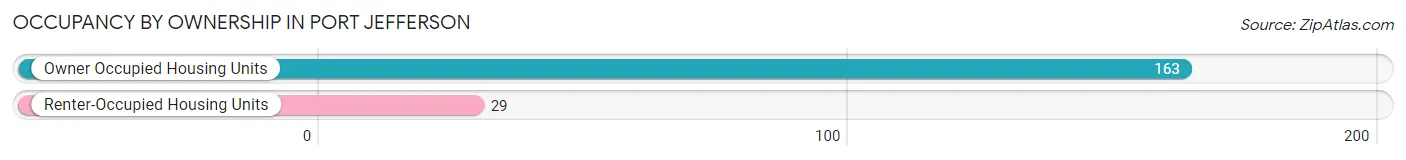
| Occupancy | # Housing Units | % Housing Units |
| Owner Occupied Housing Units | 163 | 84.9% |
| Renter-Occupied Housing Units | 29 | 15.1% |
| Total Occupied Housing Units | 192 | 100.0% |
Occupancy by Household Size in Port Jefferson
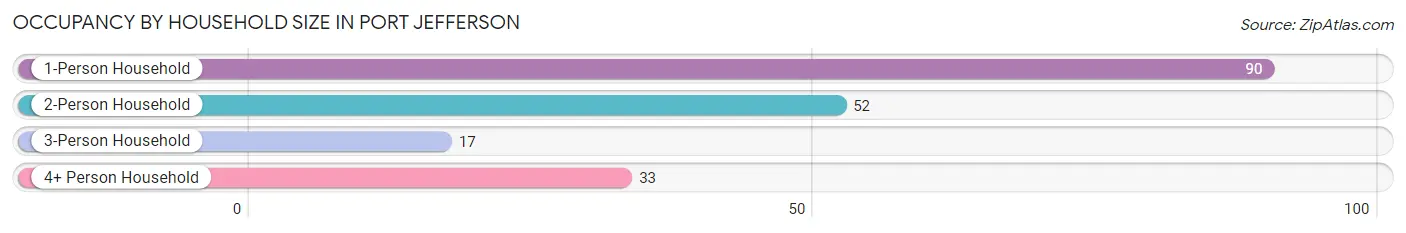
| Household Size | # Housing Units | % Housing Units |
| 1-Person Household | 90 | 46.9% |
| 2-Person Household | 52 | 27.1% |
| 3-Person Household | 17 | 8.8% |
| 4+ Person Household | 33 | 17.2% |
| Total Housing Units | 192 | 100.0% |
Occupancy by Ownership by Household Size in Port Jefferson
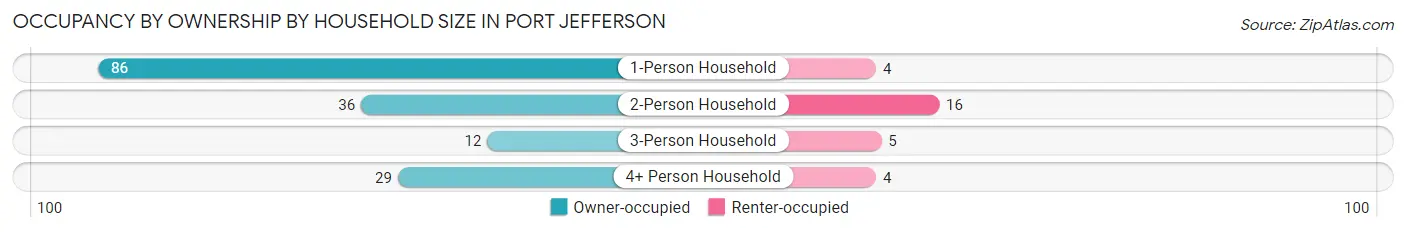
| Household Size | Owner-occupied | Renter-occupied |
| 1-Person Household | 86 (95.6%) | 4 (4.4%) |
| 2-Person Household | 36 (69.2%) | 16 (30.8%) |
| 3-Person Household | 12 (70.6%) | 5 (29.4%) |
| 4+ Person Household | 29 (87.9%) | 4 (12.1%) |
| Total Housing Units | 163 (84.9%) | 29 (15.1%) |
Occupancy by Educational Attainment in Port Jefferson
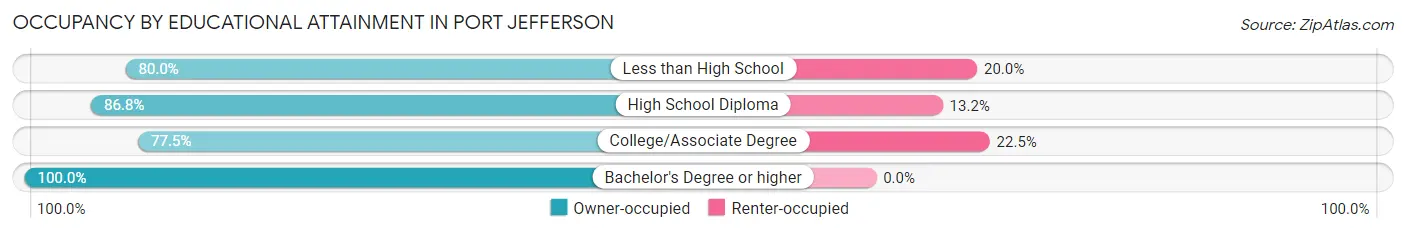
| Household Size | Owner-occupied | Renter-occupied |
| Less than High School | 12 (80.0%) | 3 (20.0%) |
| High School Diploma | 112 (86.8%) | 17 (13.2%) |
| College/Associate Degree | 31 (77.5%) | 9 (22.5%) |
| Bachelor's Degree or higher | 8 (100.0%) | 0 (0.0%) |
Occupancy by Age of Householder in Port Jefferson
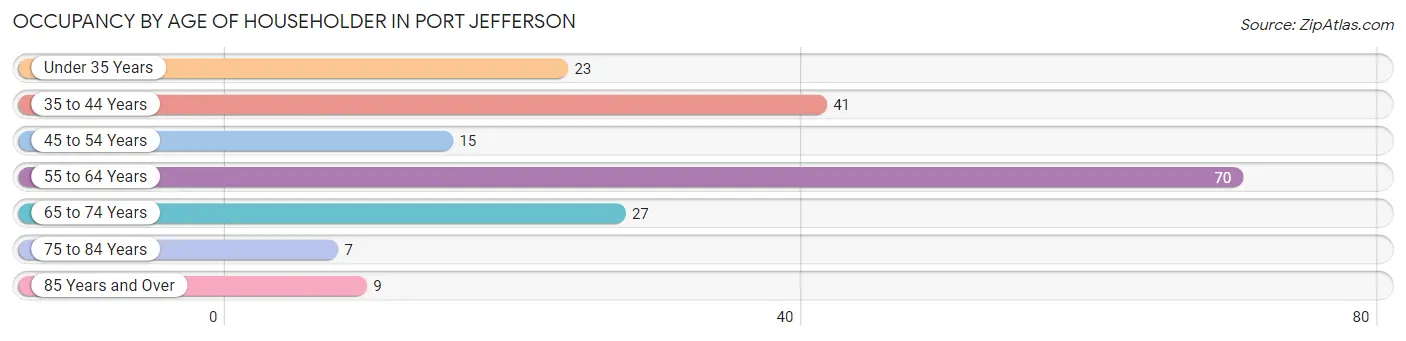
| Age Bracket | # Households | % Households |
| Under 35 Years | 23 | 12.0% |
| 35 to 44 Years | 41 | 21.3% |
| 45 to 54 Years | 15 | 7.8% |
| 55 to 64 Years | 70 | 36.5% |
| 65 to 74 Years | 27 | 14.1% |
| 75 to 84 Years | 7 | 3.6% |
| 85 Years and Over | 9 | 4.7% |
| Total | 192 | 100.0% |
Housing Finances in Port Jefferson
Median Income by Occupancy in Port Jefferson
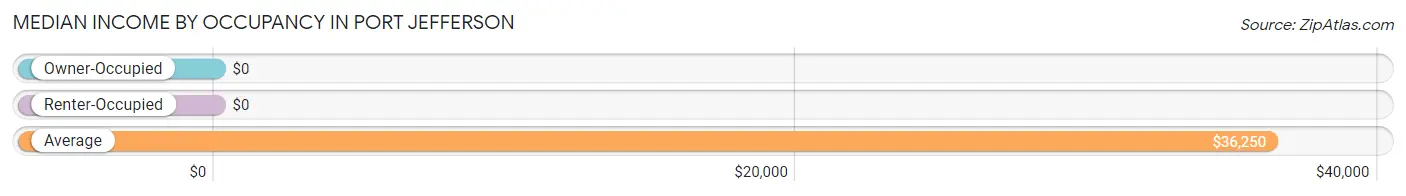
| Occupancy Type | # Households | Median Income |
| Owner-Occupied | 163 (84.9%) | $0 |
| Renter-Occupied | 29 (15.1%) | $0 |
| Average | 192 (100.0%) | $36,250 |
Occupancy by Householder Income Bracket in Port Jefferson
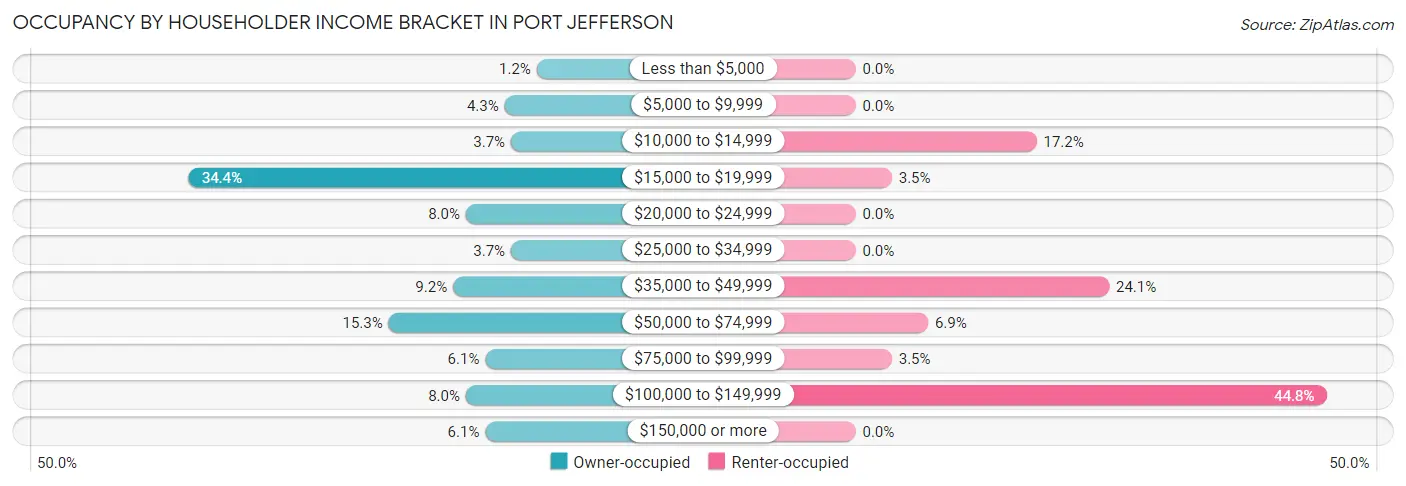
| Income Bracket | Owner-occupied | Renter-occupied |
| Less than $5,000 | 2 (1.2%) | 0 (0.0%) |
| $5,000 to $9,999 | 7 (4.3%) | 0 (0.0%) |
| $10,000 to $14,999 | 6 (3.7%) | 5 (17.2%) |
| $15,000 to $19,999 | 56 (34.4%) | 1 (3.5%) |
| $20,000 to $24,999 | 13 (8.0%) | 0 (0.0%) |
| $25,000 to $34,999 | 6 (3.7%) | 0 (0.0%) |
| $35,000 to $49,999 | 15 (9.2%) | 7 (24.1%) |
| $50,000 to $74,999 | 25 (15.3%) | 2 (6.9%) |
| $75,000 to $99,999 | 10 (6.1%) | 1 (3.5%) |
| $100,000 to $149,999 | 13 (8.0%) | 13 (44.8%) |
| $150,000 or more | 10 (6.1%) | 0 (0.0%) |
| Total | 163 (100.0%) | 29 (100.0%) |
Monthly Housing Cost Tiers in Port Jefferson
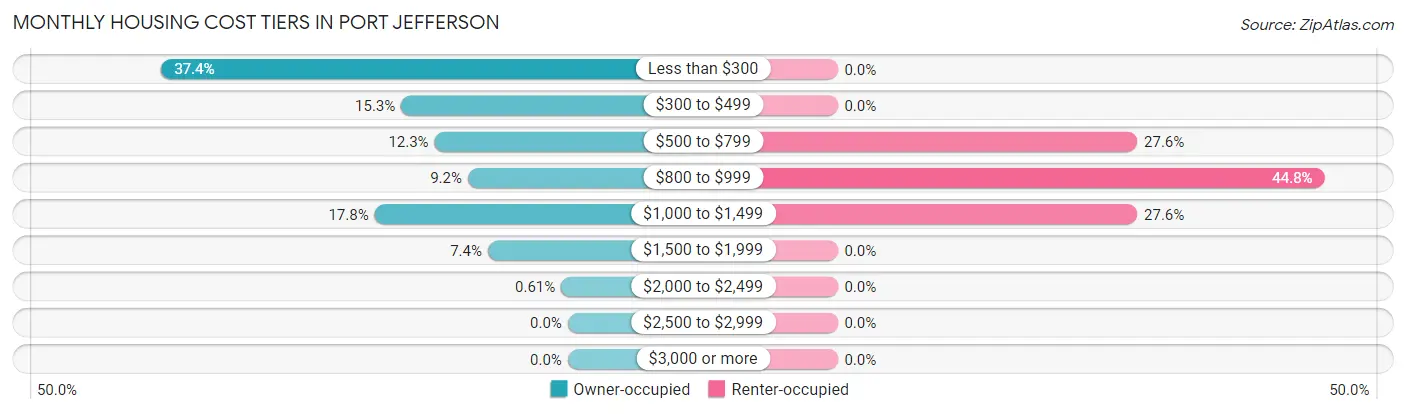
| Monthly Cost | Owner-occupied | Renter-occupied |
| Less than $300 | 61 (37.4%) | 0 (0.0%) |
| $300 to $499 | 25 (15.3%) | 0 (0.0%) |
| $500 to $799 | 20 (12.3%) | 8 (27.6%) |
| $800 to $999 | 15 (9.2%) | 13 (44.8%) |
| $1,000 to $1,499 | 29 (17.8%) | 8 (27.6%) |
| $1,500 to $1,999 | 12 (7.4%) | 0 (0.0%) |
| $2,000 to $2,499 | 1 (0.6%) | 0 (0.0%) |
| $2,500 to $2,999 | 0 (0.0%) | 0 (0.0%) |
| $3,000 or more | 0 (0.0%) | 0 (0.0%) |
| Total | 163 (100.0%) | 29 (100.0%) |
Physical Housing Characteristics in Port Jefferson
Housing Structures in Port Jefferson
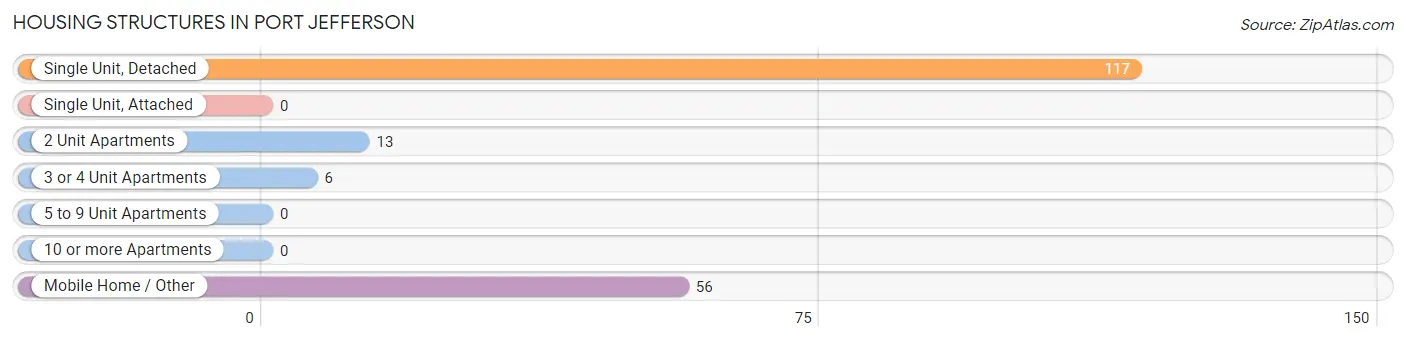
| Structure Type | # Housing Units | % Housing Units |
| Single Unit, Detached | 117 | 60.9% |
| Single Unit, Attached | 0 | 0.0% |
| 2 Unit Apartments | 13 | 6.8% |
| 3 or 4 Unit Apartments | 6 | 3.1% |
| 5 to 9 Unit Apartments | 0 | 0.0% |
| 10 or more Apartments | 0 | 0.0% |
| Mobile Home / Other | 56 | 29.2% |
| Total | 192 | 100.0% |
Housing Structures by Occupancy in Port Jefferson
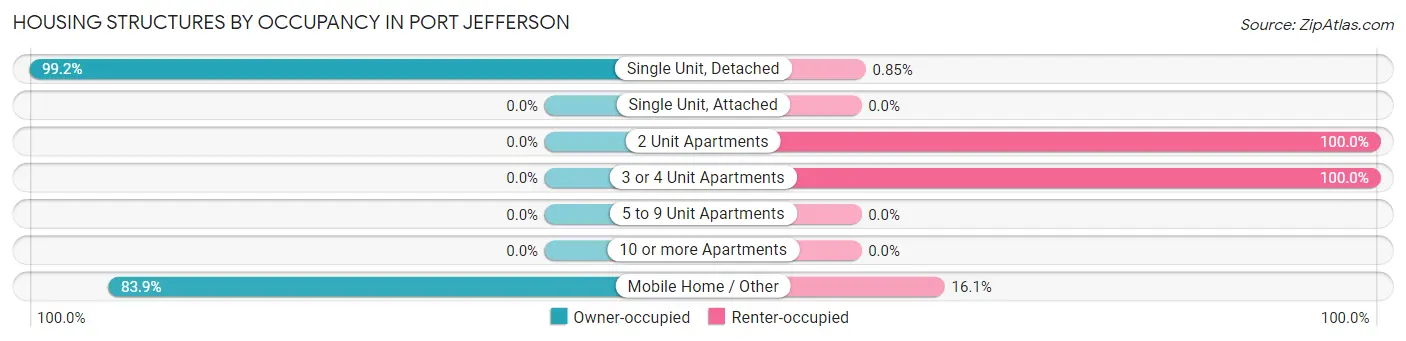
| Structure Type | Owner-occupied | Renter-occupied |
| Single Unit, Detached | 116 (99.2%) | 1 (0.9%) |
| Single Unit, Attached | 0 (0.0%) | 0 (0.0%) |
| 2 Unit Apartments | 0 (0.0%) | 13 (100.0%) |
| 3 or 4 Unit Apartments | 0 (0.0%) | 6 (100.0%) |
| 5 to 9 Unit Apartments | 0 (0.0%) | 0 (0.0%) |
| 10 or more Apartments | 0 (0.0%) | 0 (0.0%) |
| Mobile Home / Other | 47 (83.9%) | 9 (16.1%) |
| Total | 163 (84.9%) | 29 (15.1%) |
Housing Structures by Number of Rooms in Port Jefferson
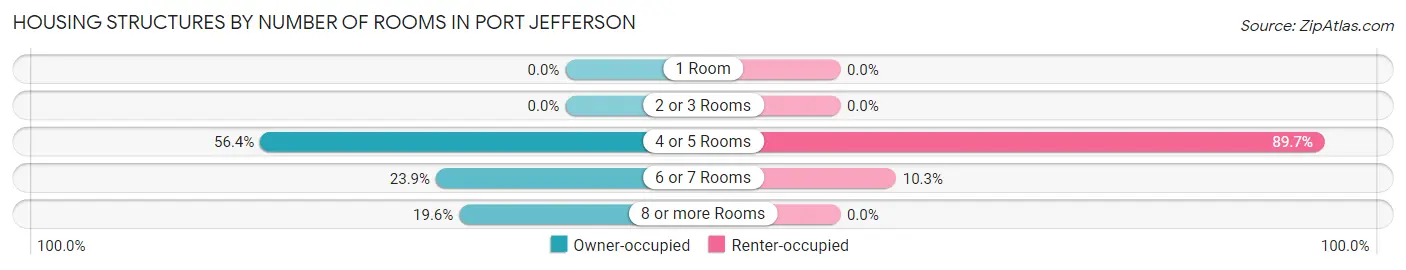
| Number of Rooms | Owner-occupied | Renter-occupied |
| 1 Room | 0 (0.0%) | 0 (0.0%) |
| 2 or 3 Rooms | 0 (0.0%) | 0 (0.0%) |
| 4 or 5 Rooms | 92 (56.4%) | 26 (89.7%) |
| 6 or 7 Rooms | 39 (23.9%) | 3 (10.3%) |
| 8 or more Rooms | 32 (19.6%) | 0 (0.0%) |
| Total | 163 (100.0%) | 29 (100.0%) |
Housing Structure by Heating Type in Port Jefferson
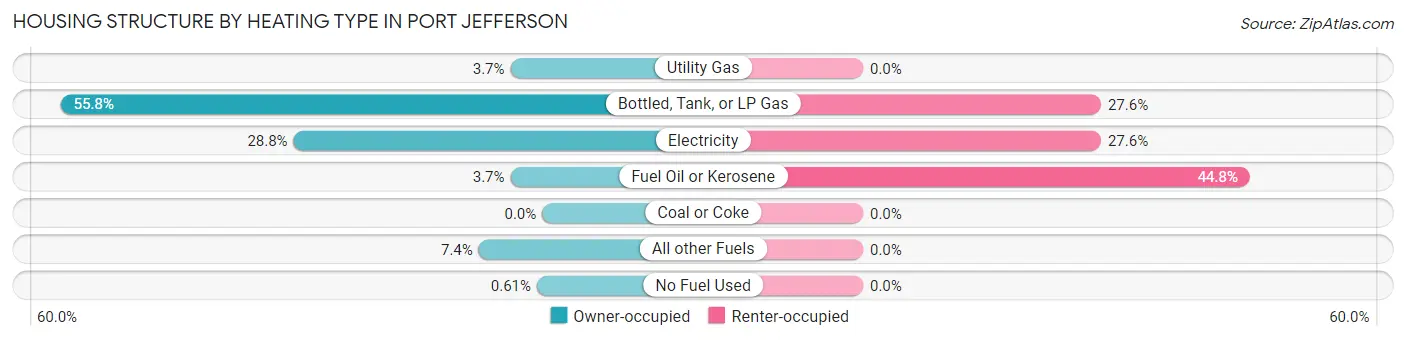
| Heating Type | Owner-occupied | Renter-occupied |
| Utility Gas | 6 (3.7%) | 0 (0.0%) |
| Bottled, Tank, or LP Gas | 91 (55.8%) | 8 (27.6%) |
| Electricity | 47 (28.8%) | 8 (27.6%) |
| Fuel Oil or Kerosene | 6 (3.7%) | 13 (44.8%) |
| Coal or Coke | 0 (0.0%) | 0 (0.0%) |
| All other Fuels | 12 (7.4%) | 0 (0.0%) |
| No Fuel Used | 1 (0.6%) | 0 (0.0%) |
| Total | 163 (100.0%) | 29 (100.0%) |
Household Vehicle Usage in Port Jefferson
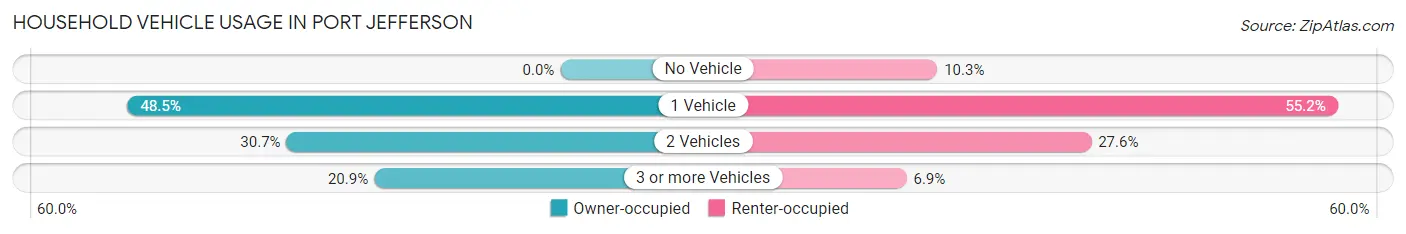
| Vehicles per Household | Owner-occupied | Renter-occupied |
| No Vehicle | 0 (0.0%) | 3 (10.3%) |
| 1 Vehicle | 79 (48.5%) | 16 (55.2%) |
| 2 Vehicles | 50 (30.7%) | 8 (27.6%) |
| 3 or more Vehicles | 34 (20.9%) | 2 (6.9%) |
| Total | 163 (100.0%) | 29 (100.0%) |
Real Estate & Mortgages in Port Jefferson
Real Estate and Mortgage Overview in Port Jefferson
| Characteristic | Without Mortgage | With Mortgage |
| Housing Units | 96 | 67 |
| Median Property Value | $58,600 | $97,900 |
| Median Household Income | $19,362 | $6 |
| Monthly Housing Costs | $247 | $0 |
| Real Estate Taxes | $1,262 | $0 |
Property Value by Mortgage Status in Port Jefferson
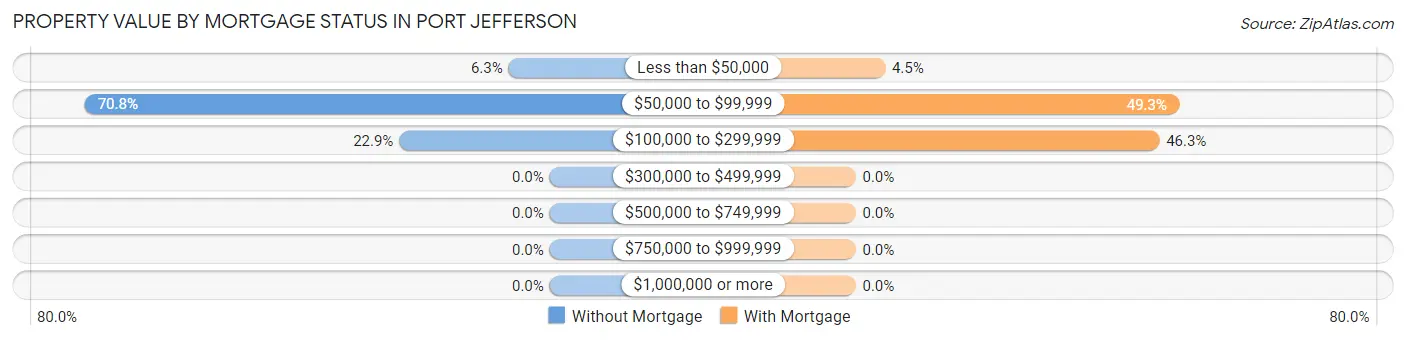
| Property Value | Without Mortgage | With Mortgage |
| Less than $50,000 | 6 (6.2%) | 3 (4.5%) |
| $50,000 to $99,999 | 68 (70.8%) | 33 (49.2%) |
| $100,000 to $299,999 | 22 (22.9%) | 31 (46.3%) |
| $300,000 to $499,999 | 0 (0.0%) | 0 (0.0%) |
| $500,000 to $749,999 | 0 (0.0%) | 0 (0.0%) |
| $750,000 to $999,999 | 0 (0.0%) | 0 (0.0%) |
| $1,000,000 or more | 0 (0.0%) | 0 (0.0%) |
| Total | 96 (100.0%) | 67 (100.0%) |
Household Income by Mortgage Status in Port Jefferson
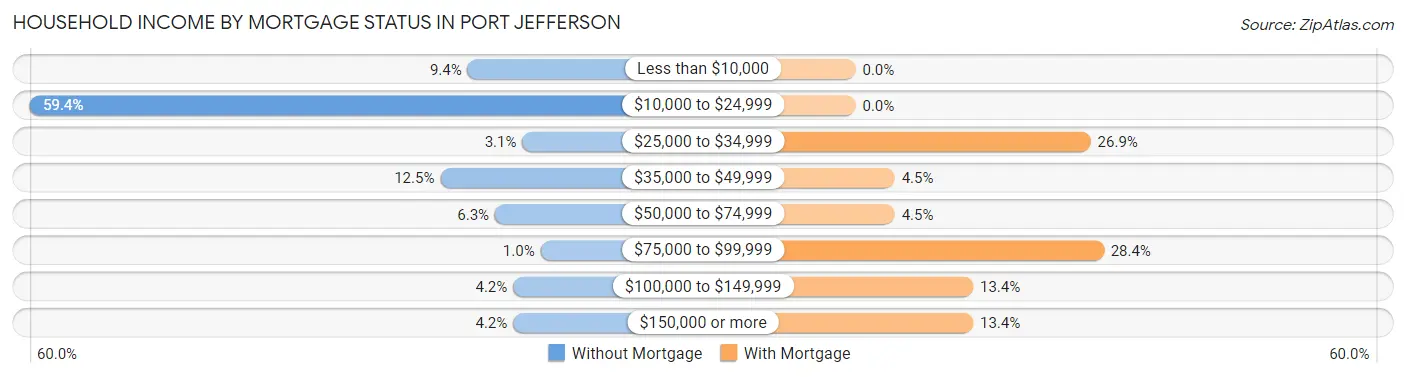
| Household Income | Without Mortgage | With Mortgage |
| Less than $10,000 | 9 (9.4%) | 0 (0.0%) |
| $10,000 to $24,999 | 57 (59.4%) | 0 (0.0%) |
| $25,000 to $34,999 | 3 (3.1%) | 18 (26.9%) |
| $35,000 to $49,999 | 12 (12.5%) | 3 (4.5%) |
| $50,000 to $74,999 | 6 (6.2%) | 3 (4.5%) |
| $75,000 to $99,999 | 1 (1.0%) | 19 (28.4%) |
| $100,000 to $149,999 | 4 (4.2%) | 9 (13.4%) |
| $150,000 or more | 4 (4.2%) | 9 (13.4%) |
| Total | 96 (100.0%) | 67 (100.0%) |
Property Value to Household Income Ratio in Port Jefferson
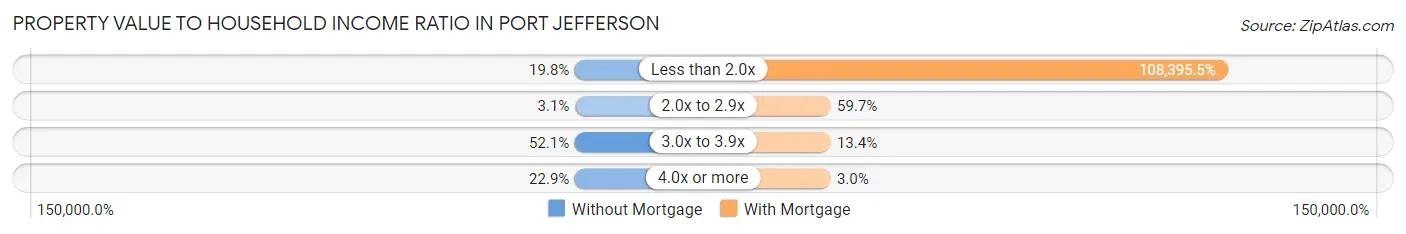
| Value-to-Income Ratio | Without Mortgage | With Mortgage |
| Less than 2.0x | 19 (19.8%) | 72,625 (108,395.5%) |
| 2.0x to 2.9x | 3 (3.1%) | 40 (59.7%) |
| 3.0x to 3.9x | 50 (52.1%) | 9 (13.4%) |
| 4.0x or more | 22 (22.9%) | 2 (3.0%) |
| Total | 96 (100.0%) | 67 (100.0%) |
Real Estate Taxes by Mortgage Status in Port Jefferson
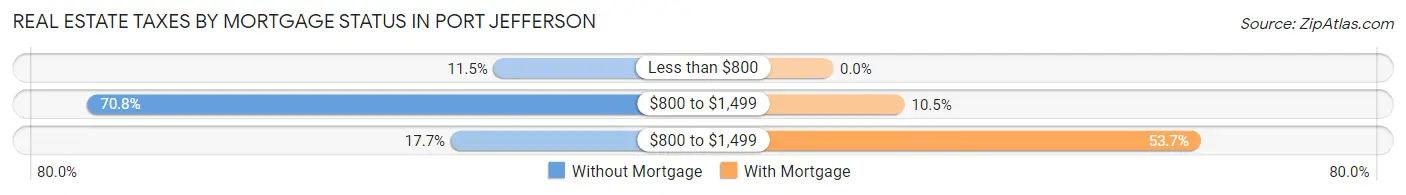
| Property Taxes | Without Mortgage | With Mortgage |
| Less than $800 | 11 (11.5%) | 0 (0.0%) |
| $800 to $1,499 | 68 (70.8%) | 7 (10.4%) |
| $800 to $1,499 | 17 (17.7%) | 36 (53.7%) |
| Total | 96 (100.0%) | 67 (100.0%) |
Health & Disability in Port Jefferson
Health Insurance Coverage by Age in Port Jefferson
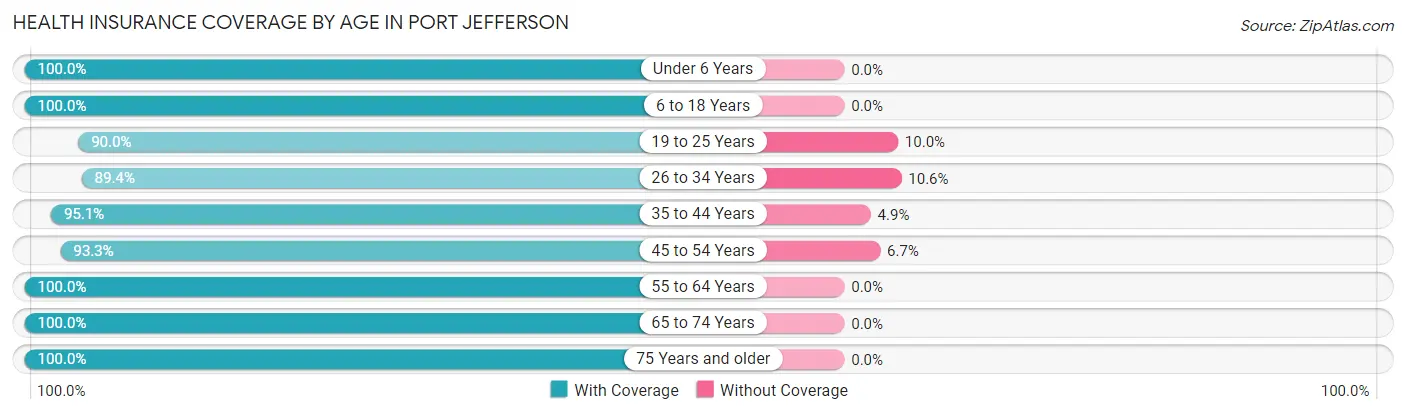
| Age Bracket | With Coverage | Without Coverage |
| Under 6 Years | 10 (100.0%) | 0 (0.0%) |
| 6 to 18 Years | 48 (100.0%) | 0 (0.0%) |
| 19 to 25 Years | 18 (90.0%) | 2 (10.0%) |
| 26 to 34 Years | 42 (89.4%) | 5 (10.6%) |
| 35 to 44 Years | 58 (95.1%) | 3 (4.9%) |
| 45 to 54 Years | 56 (93.3%) | 4 (6.7%) |
| 55 to 64 Years | 85 (100.0%) | 0 (0.0%) |
| 65 to 74 Years | 34 (100.0%) | 0 (0.0%) |
| 75 Years and older | 22 (100.0%) | 0 (0.0%) |
| Total | 373 (96.4%) | 14 (3.6%) |
Health Insurance Coverage by Citizenship Status in Port Jefferson
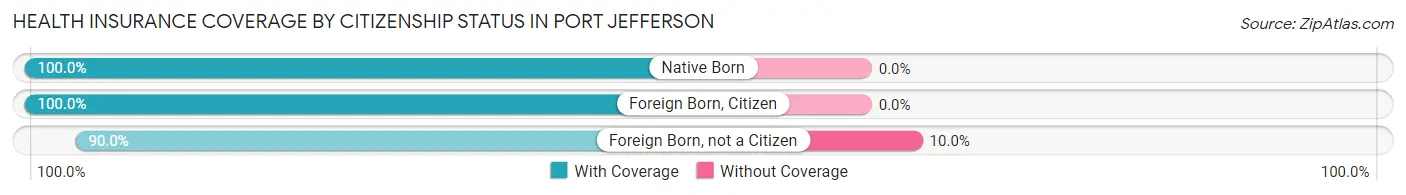
| Citizenship Status | With Coverage | Without Coverage |
| Native Born | 10 (100.0%) | 0 (0.0%) |
| Foreign Born, Citizen | 48 (100.0%) | 0 (0.0%) |
| Foreign Born, not a Citizen | 18 (90.0%) | 2 (10.0%) |
Health Insurance Coverage by Household Income in Port Jefferson
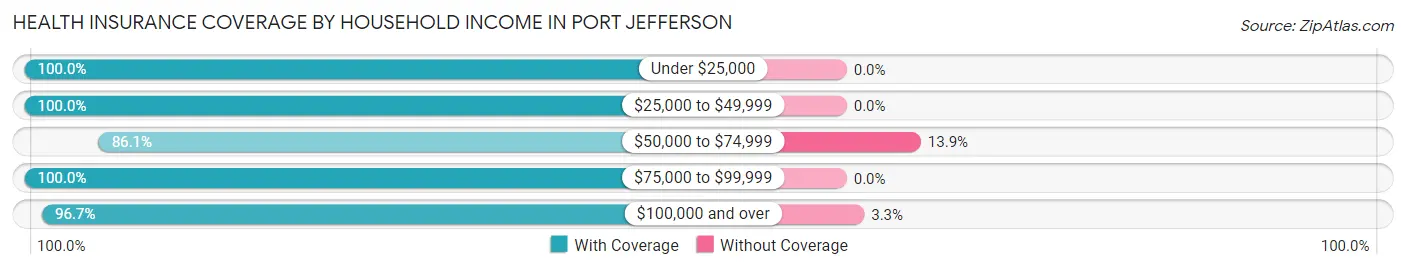
| Household Income | With Coverage | Without Coverage |
| Under $25,000 | 116 (100.0%) | 0 (0.0%) |
| $25,000 to $49,999 | 53 (100.0%) | 0 (0.0%) |
| $50,000 to $74,999 | 62 (86.1%) | 10 (13.9%) |
| $75,000 to $99,999 | 24 (100.0%) | 0 (0.0%) |
| $100,000 and over | 118 (96.7%) | 4 (3.3%) |
Public vs Private Health Insurance Coverage by Age in Port Jefferson
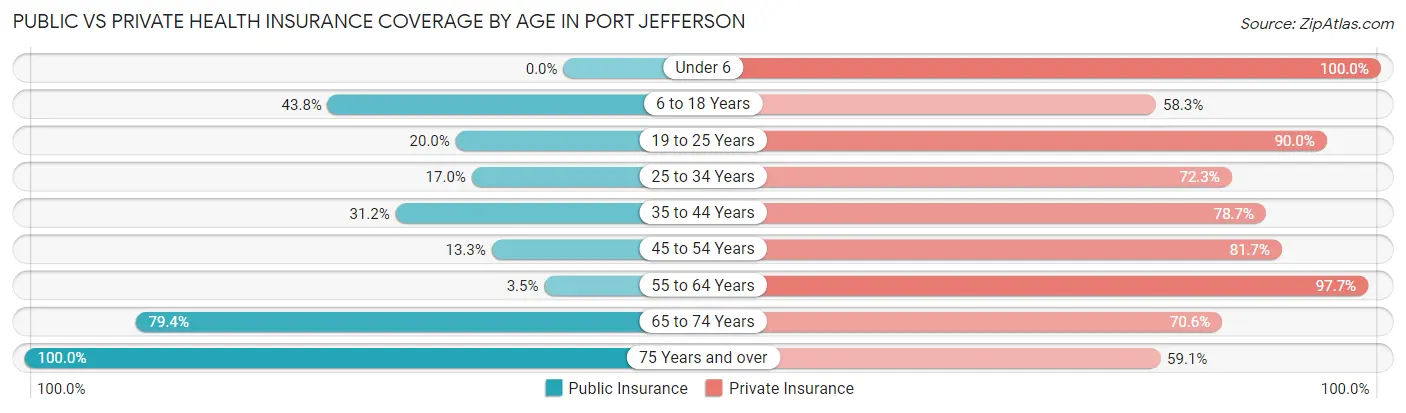
| Age Bracket | Public Insurance | Private Insurance |
| Under 6 | 0 (0.0%) | 10 (100.0%) |
| 6 to 18 Years | 21 (43.8%) | 28 (58.3%) |
| 19 to 25 Years | 4 (20.0%) | 18 (90.0%) |
| 25 to 34 Years | 8 (17.0%) | 34 (72.3%) |
| 35 to 44 Years | 19 (31.1%) | 48 (78.7%) |
| 45 to 54 Years | 8 (13.3%) | 49 (81.7%) |
| 55 to 64 Years | 3 (3.5%) | 83 (97.7%) |
| 65 to 74 Years | 27 (79.4%) | 24 (70.6%) |
| 75 Years and over | 22 (100.0%) | 13 (59.1%) |
| Total | 112 (28.9%) | 307 (79.3%) |
Disability Status by Sex by Age in Port Jefferson
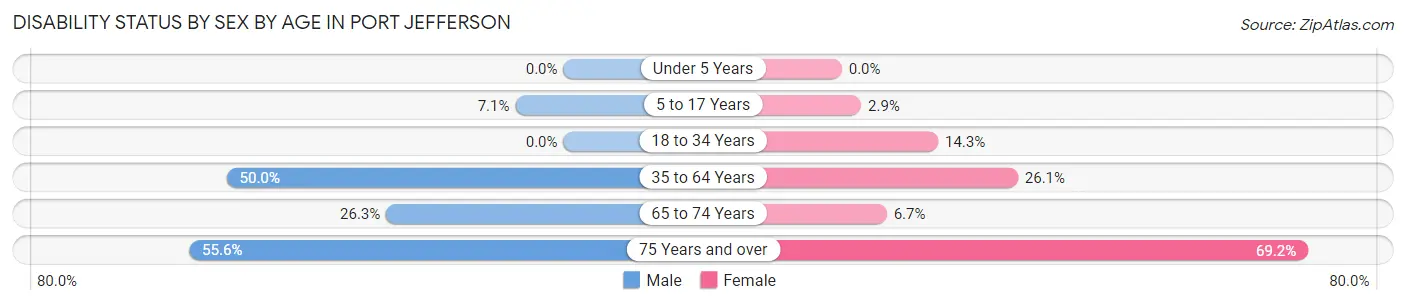
| Age Bracket | Male | Female |
| Under 5 Years | 0 (0.0%) | 0 (0.0%) |
| 5 to 17 Years | 1 (7.1%) | 1 (2.9%) |
| 18 to 34 Years | 0 (0.0%) | 5 (14.3%) |
| 35 to 64 Years | 59 (50.0%) | 23 (26.1%) |
| 65 to 74 Years | 5 (26.3%) | 1 (6.7%) |
| 75 Years and over | 5 (55.6%) | 9 (69.2%) |
Disability Class by Sex by Age in Port Jefferson
Disability Class: Hearing Difficulty
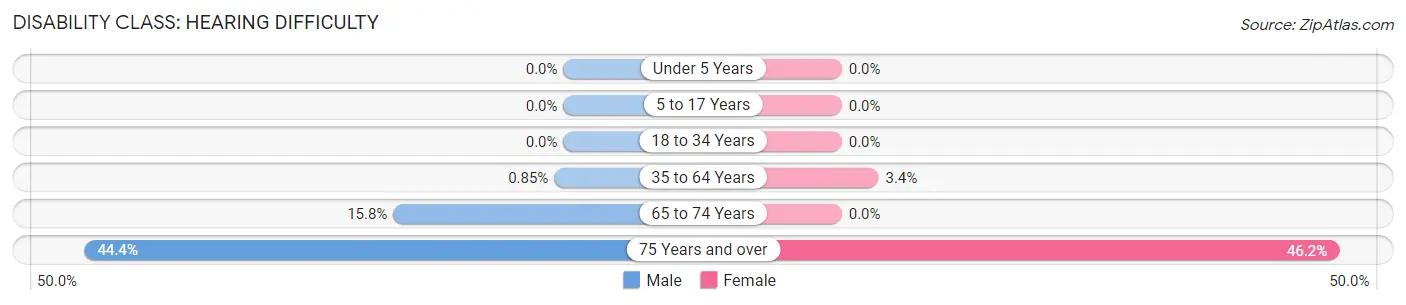
| Age Bracket | Male | Female |
| Under 5 Years | 0 (0.0%) | 0 (0.0%) |
| 5 to 17 Years | 0 (0.0%) | 0 (0.0%) |
| 18 to 34 Years | 0 (0.0%) | 0 (0.0%) |
| 35 to 64 Years | 1 (0.9%) | 3 (3.4%) |
| 65 to 74 Years | 3 (15.8%) | 0 (0.0%) |
| 75 Years and over | 4 (44.4%) | 6 (46.2%) |
Disability Class: Vision Difficulty
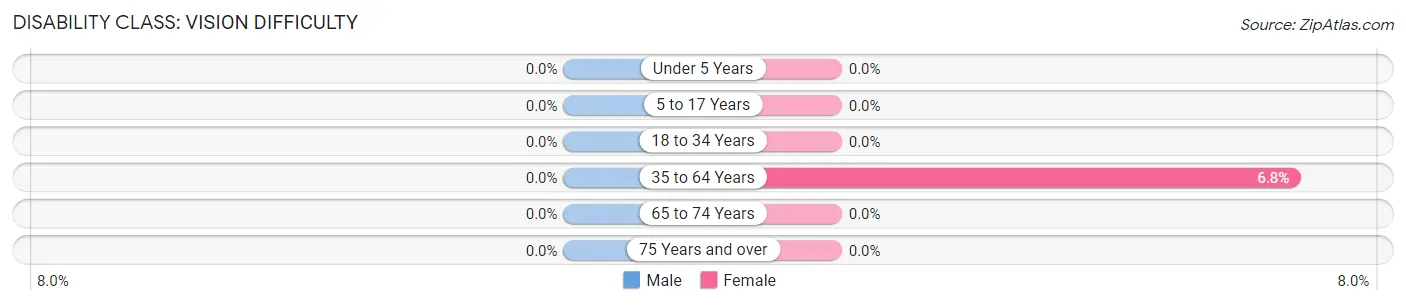
| Age Bracket | Male | Female |
| Under 5 Years | 0 (0.0%) | 0 (0.0%) |
| 5 to 17 Years | 0 (0.0%) | 0 (0.0%) |
| 18 to 34 Years | 0 (0.0%) | 0 (0.0%) |
| 35 to 64 Years | 0 (0.0%) | 6 (6.8%) |
| 65 to 74 Years | 0 (0.0%) | 0 (0.0%) |
| 75 Years and over | 0 (0.0%) | 0 (0.0%) |
Disability Class: Cognitive Difficulty
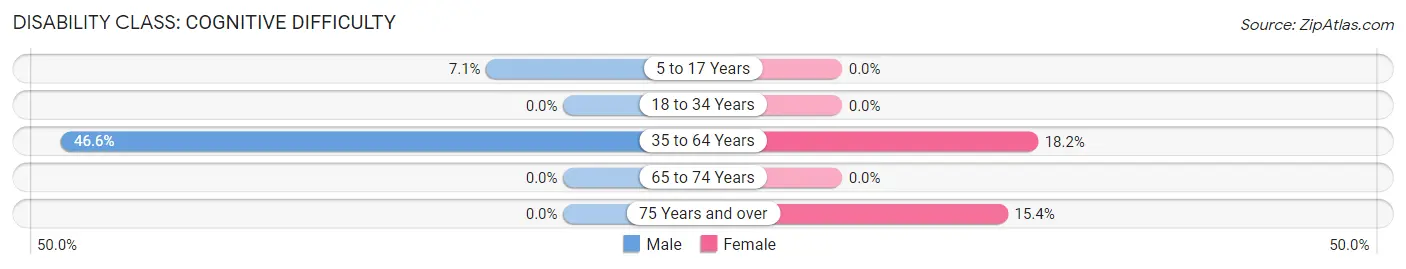
| Age Bracket | Male | Female |
| 5 to 17 Years | 1 (7.1%) | 0 (0.0%) |
| 18 to 34 Years | 0 (0.0%) | 0 (0.0%) |
| 35 to 64 Years | 55 (46.6%) | 16 (18.2%) |
| 65 to 74 Years | 0 (0.0%) | 0 (0.0%) |
| 75 Years and over | 0 (0.0%) | 2 (15.4%) |
Disability Class: Ambulatory Difficulty
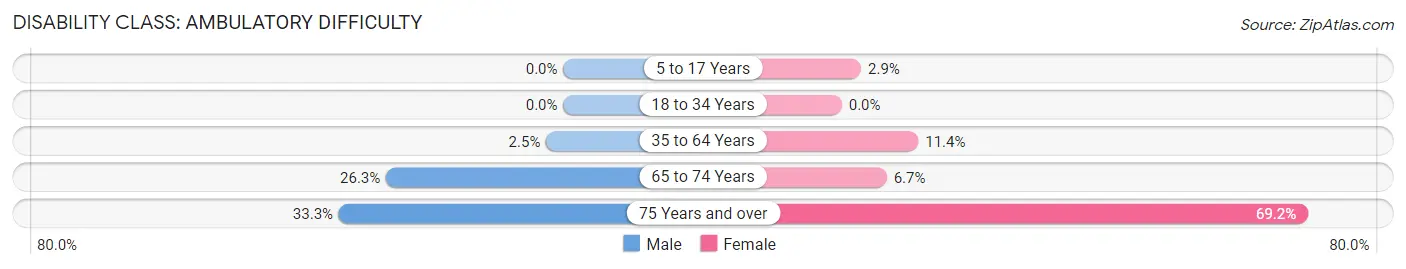
| Age Bracket | Male | Female |
| 5 to 17 Years | 0 (0.0%) | 1 (2.9%) |
| 18 to 34 Years | 0 (0.0%) | 0 (0.0%) |
| 35 to 64 Years | 3 (2.5%) | 10 (11.4%) |
| 65 to 74 Years | 5 (26.3%) | 1 (6.7%) |
| 75 Years and over | 3 (33.3%) | 9 (69.2%) |
Disability Class: Self-Care Difficulty
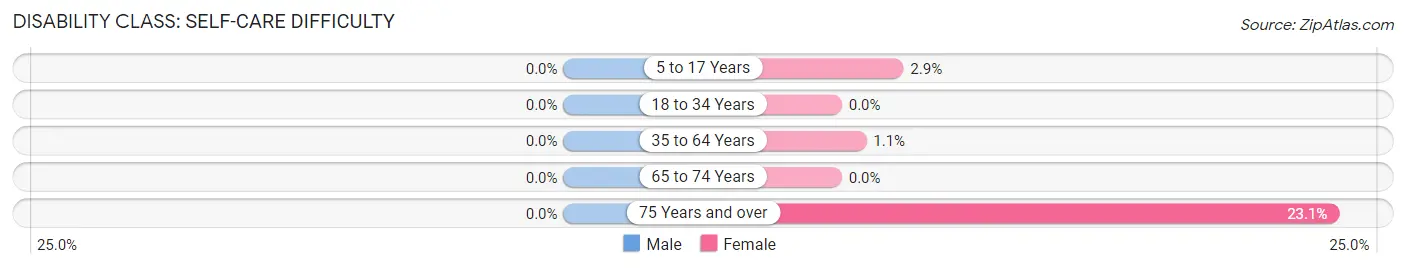
| Age Bracket | Male | Female |
| 5 to 17 Years | 0 (0.0%) | 1 (2.9%) |
| 18 to 34 Years | 0 (0.0%) | 0 (0.0%) |
| 35 to 64 Years | 0 (0.0%) | 1 (1.1%) |
| 65 to 74 Years | 0 (0.0%) | 0 (0.0%) |
| 75 Years and over | 0 (0.0%) | 3 (23.1%) |
Technology Access in Port Jefferson
Computing Device Access in Port Jefferson
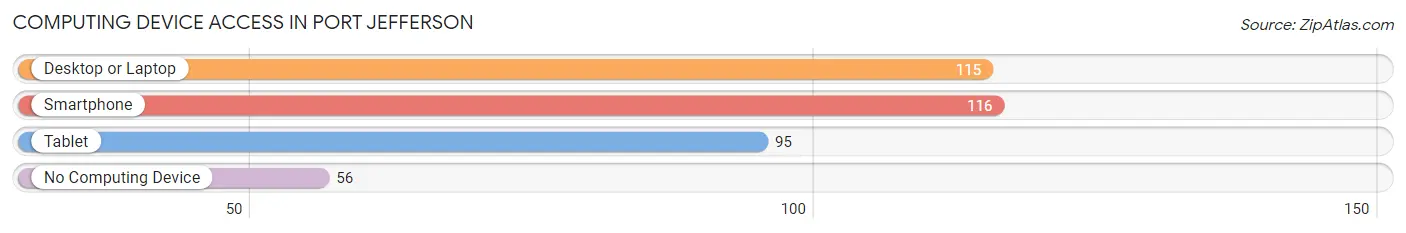
| Device Type | # Households | % Households |
| Desktop or Laptop | 115 | 59.9% |
| Smartphone | 116 | 60.4% |
| Tablet | 95 | 49.5% |
| No Computing Device | 56 | 29.2% |
| Total | 192 | 100.0% |
Internet Access in Port Jefferson
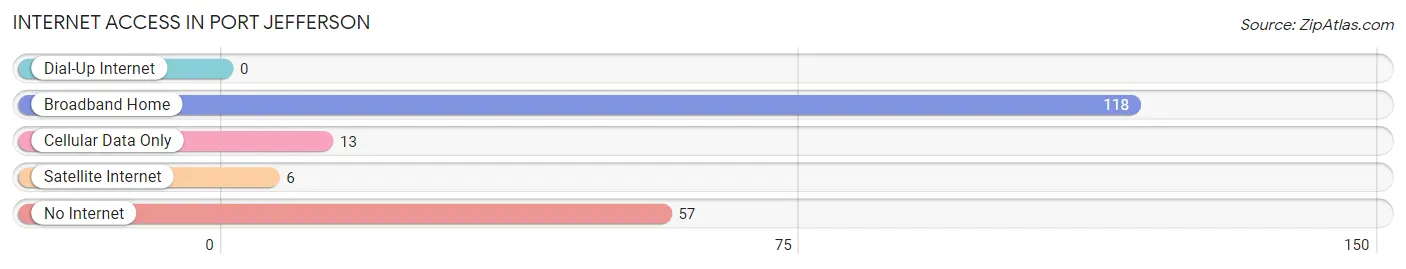
| Internet Type | # Households | % Households |
| Dial-Up Internet | 0 | 0.0% |
| Broadband Home | 118 | 61.5% |
| Cellular Data Only | 13 | 6.8% |
| Satellite Internet | 6 | 3.1% |
| No Internet | 57 | 29.7% |
| Total | 192 | 100.0% |
Port Jefferson Summary
Introduction
Port Jefferson is a small village located in Jefferson County, Ohio. It is situated on the banks of the Ohio River, and is home to a population of just over 1,000 people. The village has a rich history, and has been home to many different cultures and ethnicities over the years. It is a popular tourist destination, and is known for its scenic beauty and outdoor activities. This paper will explore the history, geography, economy and demographics of Port Jefferson in 2000 words.
History
Port Jefferson was first settled in 1802 by a group of settlers from Pennsylvania. The village was originally known as “Port Jefferson Landing”, and was a popular stop for steamboats traveling up and down the Ohio River. The village was officially incorporated in 1817, and was named after Thomas Jefferson, the third President of the United States.
In the early 19th century, Port Jefferson was a bustling port town, and was home to a variety of businesses, including a sawmill, a gristmill, a tannery, and a distillery. The village was also home to a number of churches, including the First Presbyterian Church, which was founded in 1820.
In the late 19th century, the village began to decline in population, as many of its residents moved away in search of better economic opportunities. However, the village was revitalized in the early 20th century, when the Ohio River was dredged and the village became a popular tourist destination.
Geography
Port Jefferson is located in Jefferson County, Ohio, on the banks of the Ohio River. The village is situated at an elevation of 845 feet above sea level, and is surrounded by rolling hills and lush forests. The village is located approximately 25 miles south of Steubenville, Ohio, and is approximately 50 miles east of Pittsburgh, Pennsylvania.
The village is located in a temperate climate, and experiences four distinct seasons. Summers are typically hot and humid, while winters are cold and snowy. The average annual temperature is around 50 degrees Fahrenheit, and the average annual precipitation is around 40 inches.
Economy
Port Jefferson’s economy is largely based on tourism and agriculture. The village is home to a number of tourist attractions, including the Ohio River Museum, the Port Jefferson Historical Society, and the Port Jefferson Marina. The village is also home to a number of farms, which produce a variety of crops, including corn, soybeans, and wheat.
In addition to tourism and agriculture, the village is home to a number of small businesses, including restaurants, shops, and service providers. The village is also home to a number of manufacturing companies, which produce a variety of products, including furniture, clothing, and automotive parts.
Demographics
As of the 2010 census, the population of Port Jefferson was 1,072. The village is predominantly white, with a population that is 94.3% white, 2.2% African American, 0.7% Asian, and 0.6% Native American. The median household income is $37,917, and the median home value is $90,000.
Conclusion
Port Jefferson is a small village located in Jefferson County, Ohio. It is situated on the banks of the Ohio River, and is home to a population of just over 1,000 people. The village has a rich history, and has been home to many different cultures and ethnicities over the years. It is a popular tourist destination, and is known for its scenic beauty and outdoor activities. The village’s economy is largely based on tourism and agriculture, and it is home to a number of small businesses, manufacturing companies, and farms. The population of Port Jefferson is predominantly white, with a median household income of $37,917 and a median home value of $90,000.
Common Questions
What is Per Capita Income in Port Jefferson?
Per Capita income in Port Jefferson is $33,651.
What is the Median Family Income in Port Jefferson?
Median Family Income in Port Jefferson is $73,594.
What is the Median Household income in Port Jefferson?
Median Household Income in Port Jefferson is $36,250.
What is Income or Wage Gap in Port Jefferson?
Income or Wage Gap in Port Jefferson is 59.4%.
Women in Port Jefferson earn 40.6 cents for every dollar earned by a man.
What is Inequality or Gini Index in Port Jefferson?
Inequality or Gini Index in Port Jefferson is 0.53.
What is the Total Population of Port Jefferson?
Total Population of Port Jefferson is 387.
What is the Total Male Population of Port Jefferson?
Total Male Population of Port Jefferson is 199.
What is the Total Female Population of Port Jefferson?
Total Female Population of Port Jefferson is 188.
What is the Ratio of Males per 100 Females in Port Jefferson?
There are 105.85 Males per 100 Females in Port Jefferson.
What is the Ratio of Females per 100 Males in Port Jefferson?
There are 94.47 Females per 100 Males in Port Jefferson.
What is the Median Population Age in Port Jefferson?
Median Population Age in Port Jefferson is 46.5 Years.
What is the Average Family Size in Port Jefferson
Average Family Size in Port Jefferson is 2.8 People.
What is the Average Household Size in Port Jefferson
Average Household Size in Port Jefferson is 2.0 People.
How Large is the Labor Force in Port Jefferson?
There are 203 People in the Labor Forcein in Port Jefferson.
What is the Percentage of People in the Labor Force in Port Jefferson?
60.6% of People are in the Labor Force in Port Jefferson.
What is the Unemployment Rate in Port Jefferson?
Unemployment Rate in Port Jefferson is 13.3%.