Zip Codes with the Highest Percentage of Population Employed in Office & Administration in Steubenville, OH
RELATED REPORTS & OPTIONS
Office & Administration
Steubenville
Compare Zip Codes
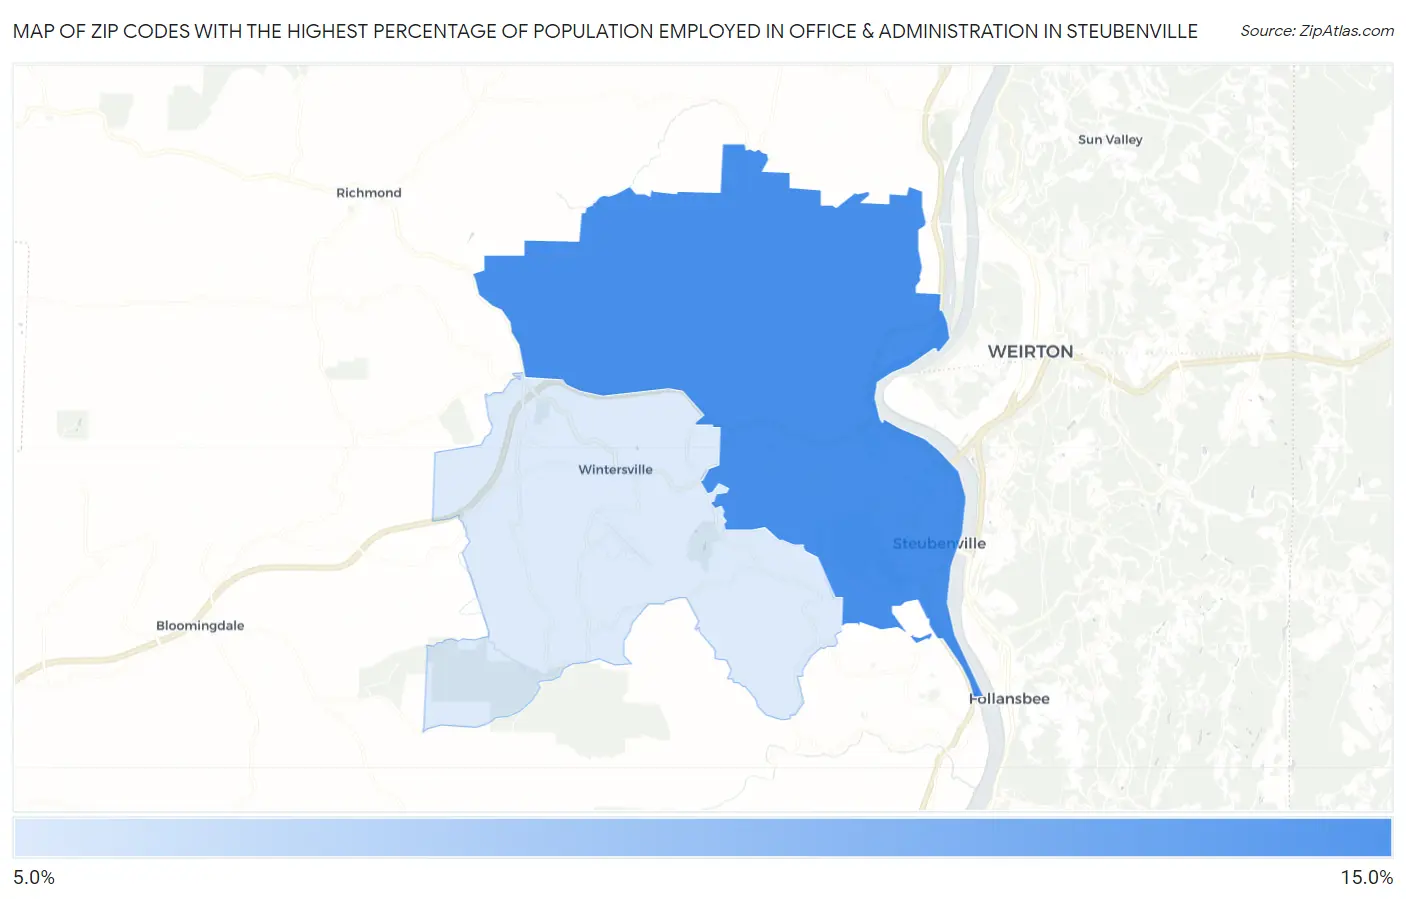
Map of Zip Codes with the Highest Percentage of Population Employed in Office & Administration in Steubenville
10.4%
13.6%
Zip Codes with the Highest Percentage of Population Employed in Office & Administration in Steubenville, OH
| Zip Code | % Employed | vs State | vs National | |
| 1. | 43952 | 13.6% | 11.3%(+2.34)#274 | 10.9%(+2.74)#6,723 |
| 2. | 43953 | 10.4% | 11.3%(-0.812)#632 | 10.9%(-0.412)#15,683 |
1
Common Questions
What are the Top Zip Codes with the Highest Percentage of Population Employed in Office & Administration in Steubenville, OH?
Top Zip Codes with the Highest Percentage of Population Employed in Office & Administration in Steubenville, OH are:
What zip code has the Highest Percentage of Population Employed in Office & Administration in Steubenville, OH?
43952 has the Highest Percentage of Population Employed in Office & Administration in Steubenville, OH with 13.6%.
What is the Percentage of Population Employed in Office & Administration in Steubenville, OH?
Percentage of Population Employed in Office & Administration in Steubenville is 12.1%.
What is the Percentage of Population Employed in Office & Administration in Ohio?
Percentage of Population Employed in Office & Administration in Ohio is 11.3%.
What is the Percentage of Population Employed in Office & Administration in the United States?
Percentage of Population Employed in Office & Administration in the United States is 10.9%.