Zip Codes with the Lowest Child Poverty Level Among Boys Under the Age of 16 in Ohio
RELATED REPORTS & OPTIONS
Lowest Poverty | Boys 0-16
Ohio
Compare Zip Codes
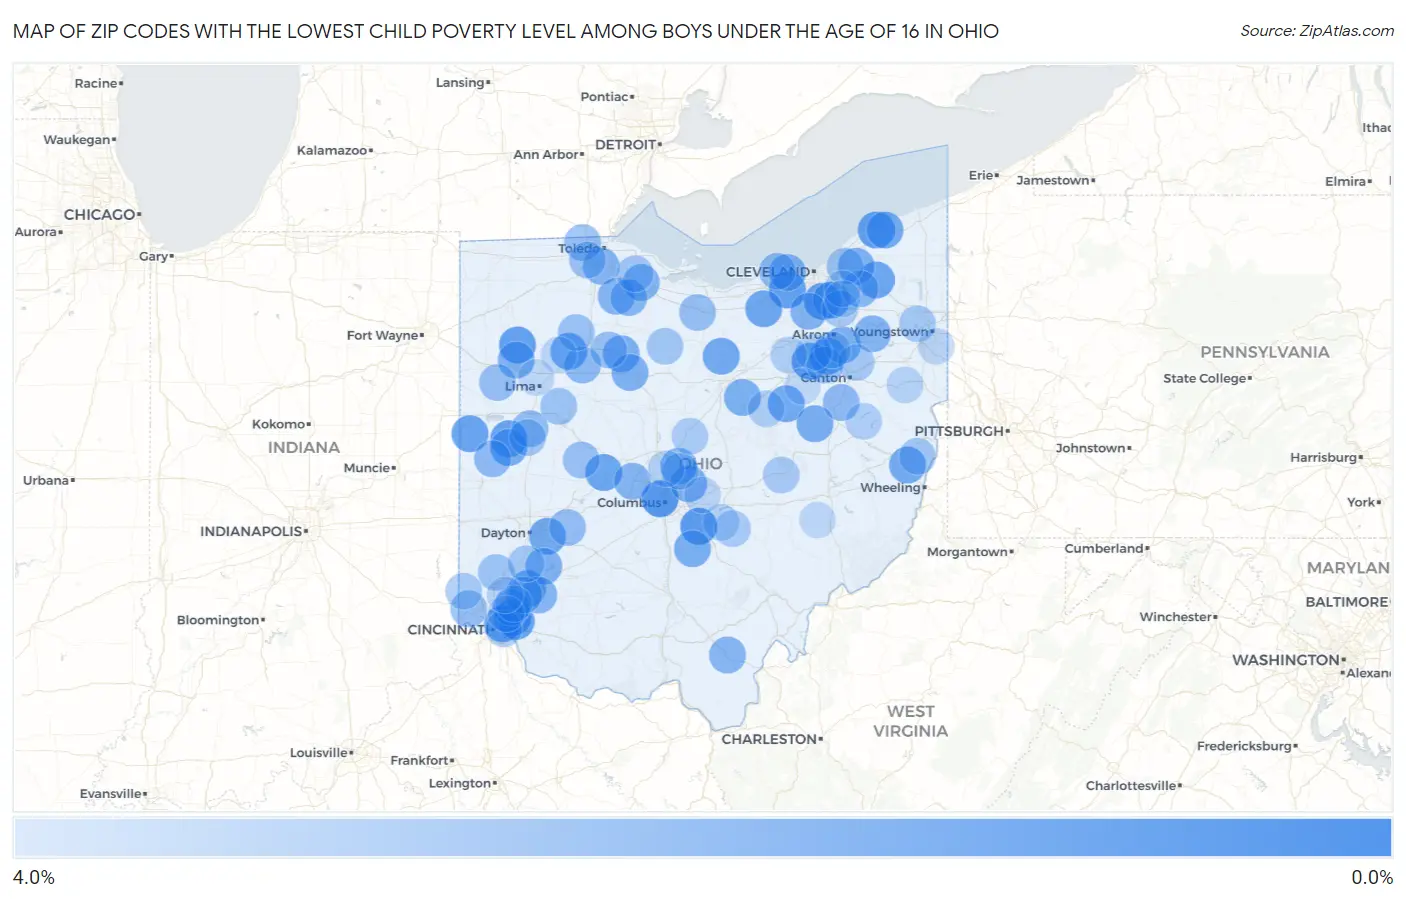
Map of Zip Codes with the Lowest Child Poverty Level Among Boys Under the Age of 16 in Ohio
4.0%
0.0%
Zip Codes with the Lowest Child Poverty Level Among Boys Under the Age of 16 in Ohio
| Zip Code | Child Poverty (Boys) | vs State | vs National | |
| 1. | 43212 | 0.16% | 18.8%(-18.7)#1 | 16.9%(-16.7)#5 |
| 2. | 43112 | 0.37% | 18.8%(-18.5)#2 | 16.9%(-16.5)#53 |
| 3. | 45243 | 0.46% | 18.8%(-18.4)#3 | 16.9%(-16.4)#85 |
| 4. | 44138 | 0.57% | 18.8%(-18.3)#4 | 16.9%(-16.3)#121 |
| 5. | 44141 | 0.59% | 18.8%(-18.2)#5 | 16.9%(-16.3)#134 |
| 6. | 44081 | 0.62% | 18.8%(-18.2)#6 | 16.9%(-16.3)#153 |
| 7. | 44645 | 0.67% | 18.8%(-18.2)#7 | 16.9%(-16.2)#171 |
| 8. | 45827 | 0.67% | 18.8%(-18.1)#8 | 16.9%(-16.2)#173 |
| 9. | 45865 | 0.72% | 18.8%(-18.1)#9 | 16.9%(-16.2)#194 |
| 10. | 45208 | 0.74% | 18.8%(-18.1)#10 | 16.9%(-16.2)#206 |
| 11. | 45174 | 0.78% | 18.8%(-18.0)#11 | 16.9%(-16.1)#220 |
| 12. | 45846 | 0.82% | 18.8%(-18.0)#12 | 16.9%(-16.1)#253 |
| 13. | 43084 | 0.85% | 18.8%(-18.0)#13 | 16.9%(-16.0)#278 |
| 14. | 44021 | 0.90% | 18.8%(-17.9)#14 | 16.9%(-16.0)#297 |
| 15. | 44067 | 0.92% | 18.8%(-17.9)#15 | 16.9%(-16.0)#310 |
| 16. | 44050 | 0.94% | 18.8%(-17.9)#16 | 16.9%(-16.0)#327 |
| 17. | 44216 | 0.96% | 18.8%(-17.9)#17 | 16.9%(-15.9)#330 |
| 18. | 44633 | 1.1% | 18.8%(-17.7)#18 | 16.9%(-15.8)#415 |
| 19. | 44878 | 1.1% | 18.8%(-17.7)#19 | 16.9%(-15.8)#429 |
| 20. | 45868 | 1.1% | 18.8%(-17.7)#20 | 16.9%(-15.8)#433 |
| 21. | 45434 | 1.1% | 18.8%(-17.7)#21 | 16.9%(-15.8)#444 |
| 22. | 43901 | 1.1% | 18.8%(-17.7)#22 | 16.9%(-15.8)#461 |
| 23. | 44057 | 1.2% | 18.8%(-17.6)#23 | 16.9%(-15.7)#494 |
| 24. | 45845 | 1.3% | 18.8%(-17.6)#24 | 16.9%(-15.6)#532 |
| 25. | 45065 | 1.3% | 18.8%(-17.5)#25 | 16.9%(-15.6)#553 |
| 26. | 44681 | 1.3% | 18.8%(-17.5)#26 | 16.9%(-15.6)#565 |
| 27. | 43102 | 1.4% | 18.8%(-17.5)#27 | 16.9%(-15.5)#606 |
| 28. | 44312 | 1.4% | 18.8%(-17.4)#28 | 16.9%(-15.5)#651 |
| 29. | 43316 | 1.4% | 18.8%(-17.4)#29 | 16.9%(-15.5)#653 |
| 30. | 44864 | 1.5% | 18.8%(-17.4)#30 | 16.9%(-15.4)#664 |
| 31. | 45068 | 1.5% | 18.8%(-17.3)#31 | 16.9%(-15.4)#687 |
| 32. | 43054 | 1.5% | 18.8%(-17.3)#32 | 16.9%(-15.4)#688 |
| 33. | 44026 | 1.5% | 18.8%(-17.3)#33 | 16.9%(-15.4)#709 |
| 34. | 44140 | 1.5% | 18.8%(-17.3)#34 | 16.9%(-15.4)#716 |
| 35. | 45844 | 1.5% | 18.8%(-17.3)#35 | 16.9%(-15.4)#717 |
| 36. | 43351 | 1.6% | 18.8%(-17.3)#36 | 16.9%(-15.3)#739 |
| 37. | 44233 | 1.7% | 18.8%(-17.2)#37 | 16.9%(-15.2)#830 |
| 38. | 43551 | 1.7% | 18.8%(-17.1)#38 | 16.9%(-15.2)#884 |
| 39. | 43406 | 1.8% | 18.8%(-17.1)#39 | 16.9%(-15.1)#901 |
| 40. | 43064 | 1.8% | 18.8%(-17.1)#40 | 16.9%(-15.1)#902 |
| 41. | 43442 | 1.8% | 18.8%(-17.0)#41 | 16.9%(-15.1)#913 |
| 42. | 44272 | 1.8% | 18.8%(-17.0)#42 | 16.9%(-15.1)#918 |
| 43. | 43021 | 1.8% | 18.8%(-17.0)#43 | 16.9%(-15.1)#921 |
| 44. | 43435 | 1.8% | 18.8%(-17.0)#44 | 16.9%(-15.1)#931 |
| 45. | 44023 | 1.8% | 18.8%(-17.0)#45 | 16.9%(-15.1)#939 |
| 46. | 45152 | 1.8% | 18.8%(-17.0)#46 | 16.9%(-15.1)#950 |
| 47. | 45685 | 1.8% | 18.8%(-17.0)#47 | 16.9%(-15.1)#982 |
| 48. | 45242 | 1.9% | 18.8%(-17.0)#48 | 16.9%(-15.0)#988 |
| 49. | 45039 | 1.9% | 18.8%(-16.9)#49 | 16.9%(-15.0)#996 |
| 50. | 45841 | 1.9% | 18.8%(-16.9)#50 | 16.9%(-15.0)#1,034 |
| 51. | 44612 | 2.0% | 18.8%(-16.8)#51 | 16.9%(-14.9)#1,132 |
| 52. | 45380 | 2.1% | 18.8%(-16.8)#52 | 16.9%(-14.8)#1,163 |
| 53. | 44012 | 2.1% | 18.8%(-16.7)#53 | 16.9%(-14.8)#1,237 |
| 54. | 45306 | 2.2% | 18.8%(-16.7)#54 | 16.9%(-14.7)#1,261 |
| 55. | 45387 | 2.3% | 18.8%(-16.6)#55 | 16.9%(-14.6)#1,336 |
| 56. | 44847 | 2.3% | 18.8%(-16.5)#56 | 16.9%(-14.6)#1,362 |
| 57. | 45030 | 2.3% | 18.8%(-16.5)#57 | 16.9%(-14.6)#1,380 |
| 58. | 45894 | 2.3% | 18.8%(-16.5)#58 | 16.9%(-14.6)#1,383 |
| 59. | 43560 | 2.3% | 18.8%(-16.5)#59 | 16.9%(-14.6)#1,402 |
| 60. | 43357 | 2.4% | 18.8%(-16.4)#60 | 16.9%(-14.5)#1,456 |
| 61. | 45890 | 2.4% | 18.8%(-16.4)#61 | 16.9%(-14.5)#1,457 |
| 62. | 44614 | 2.4% | 18.8%(-16.4)#62 | 16.9%(-14.5)#1,468 |
| 63. | 44040 | 2.4% | 18.8%(-16.4)#63 | 16.9%(-14.5)#1,478 |
| 64. | 45858 | 2.4% | 18.8%(-16.4)#64 | 16.9%(-14.5)#1,480 |
| 65. | 43537 | 2.5% | 18.8%(-16.3)#65 | 16.9%(-14.4)#1,525 |
| 66. | 45067 | 2.5% | 18.8%(-16.3)#66 | 16.9%(-14.4)#1,557 |
| 67. | 45896 | 2.5% | 18.8%(-16.3)#67 | 16.9%(-14.4)#1,564 |
| 68. | 43082 | 2.7% | 18.8%(-16.1)#68 | 16.9%(-14.2)#1,679 |
| 69. | 43416 | 2.7% | 18.8%(-16.1)#69 | 16.9%(-14.2)#1,688 |
| 70. | 43948 | 2.7% | 18.8%(-16.1)#70 | 16.9%(-14.2)#1,705 |
| 71. | 44818 | 2.7% | 18.8%(-16.1)#71 | 16.9%(-14.2)#1,736 |
| 72. | 45302 | 2.7% | 18.8%(-16.1)#72 | 16.9%(-14.2)#1,744 |
| 73. | 44721 | 2.8% | 18.8%(-16.0)#73 | 16.9%(-14.1)#1,818 |
| 74. | 45066 | 2.8% | 18.8%(-16.0)#74 | 16.9%(-14.1)#1,828 |
| 75. | 44440 | 2.8% | 18.8%(-16.0)#75 | 16.9%(-14.1)#1,830 |
| 76. | 45226 | 2.9% | 18.8%(-15.9)#76 | 16.9%(-14.0)#1,853 |
| 77. | 45053 | 2.9% | 18.8%(-15.9)#77 | 16.9%(-14.0)#1,862 |
| 78. | 43821 | 2.9% | 18.8%(-15.9)#78 | 16.9%(-14.0)#1,893 |
| 79. | 44236 | 3.0% | 18.8%(-15.9)#79 | 16.9%(-13.9)#1,911 |
| 80. | 43150 | 3.0% | 18.8%(-15.9)#80 | 16.9%(-13.9)#1,918 |
| 81. | 44319 | 3.0% | 18.8%(-15.8)#81 | 16.9%(-13.9)#1,970 |
| 82. | 43334 | 3.0% | 18.8%(-15.8)#82 | 16.9%(-13.9)#1,992 |
| 83. | 44661 | 3.1% | 18.8%(-15.7)#83 | 16.9%(-13.8)#2,037 |
| 84. | 45249 | 3.1% | 18.8%(-15.7)#84 | 16.9%(-13.8)#2,038 |
| 85. | 44230 | 3.1% | 18.8%(-15.7)#85 | 16.9%(-13.8)#2,041 |
| 86. | 44675 | 3.2% | 18.8%(-15.7)#86 | 16.9%(-13.7)#2,089 |
| 87. | 44217 | 3.2% | 18.8%(-15.6)#87 | 16.9%(-13.7)#2,122 |
| 88. | 43035 | 3.3% | 18.8%(-15.5)#88 | 16.9%(-13.6)#2,200 |
| 89. | 44423 | 3.3% | 18.8%(-15.5)#89 | 16.9%(-13.6)#2,226 |
| 90. | 43148 | 3.3% | 18.8%(-15.5)#90 | 16.9%(-13.6)#2,240 |
| 91. | 44139 | 3.4% | 18.8%(-15.5)#91 | 16.9%(-13.5)#2,265 |
| 92. | 44087 | 3.4% | 18.8%(-15.4)#92 | 16.9%(-13.5)#2,304 |
| 93. | 45236 | 3.5% | 18.8%(-15.4)#93 | 16.9%(-13.5)#2,345 |
| 94. | 45069 | 3.5% | 18.8%(-15.3)#94 | 16.9%(-13.4)#2,398 |
| 95. | 44514 | 3.5% | 18.8%(-15.3)#95 | 16.9%(-13.4)#2,399 |
| 96. | 43062 | 3.5% | 18.8%(-15.3)#96 | 16.9%(-13.4)#2,419 |
| 97. | 45877 | 3.6% | 18.8%(-15.2)#97 | 16.9%(-13.3)#2,454 |
| 98. | 45807 | 3.7% | 18.8%(-15.2)#98 | 16.9%(-13.2)#2,518 |
| 99. | 43732 | 3.7% | 18.8%(-15.1)#99 | 16.9%(-13.2)#2,572 |
| 100. | 44606 | 3.8% | 18.8%(-15.1)#100 | 16.9%(-13.2)#2,605 |
Common Questions
What are the Top 10 Zip Codes with the Lowest Child Poverty Level Among Boys Under the Age of 16 in Ohio?
Top 10 Zip Codes with the Lowest Child Poverty Level Among Boys Under the Age of 16 in Ohio are:
What zip code has the Lowest Child Poverty Level Among Boys Under the Age of 16 in Ohio?
43212 has the Lowest Child Poverty Level Among Boys Under the Age of 16 in Ohio with 0.16%.
What is the Poverty Level Among Boys Under the Age of 16 in the State of Ohio?
Poverty Level Among Boys Under the Age of 16 in Ohio is 18.8%.
What is the Poverty Level Among Boys Under the Age of 16 in the United States?
Poverty Level Among Boys Under the Age of 16 in the United States is 16.9%.