Mount Gilead, OH Map & Demographics
Mount Gilead Map
Mount Gilead Overview
$24,290
PER CAPITA INCOME
$66,233
AVG FAMILY INCOME
$51,534
AVG HOUSEHOLD INCOME
19.4%
WAGE / INCOME GAP [ % ]
80.6¢/ $1
WAGE / INCOME GAP [ $ ]
0.36
INEQUALITY / GINI INDEX
2,927
TOTAL POPULATION
1,171
MALE POPULATION
1,756
FEMALE POPULATION
66.69
MALES / 100 FEMALES
149.96
FEMALES / 100 MALES
33.7
MEDIAN AGE
3.2
AVG FAMILY SIZE
2.4
AVG HOUSEHOLD SIZE
1,297
LABOR FORCE [ PEOPLE ]
61.4%
PERCENT IN LABOR FORCE
2.6%
UNEMPLOYMENT RATE
Mount Gilead Zip Codes
Income in Mount Gilead
Income Overview in Mount Gilead
Per Capita Income in Mount Gilead is $24,290, while median incomes of families and households are $66,233 and $51,534 respectively.
| Characteristic | Number | Measure |
| Per Capita Income | 2,927 | $24,290 |
| Median Family Income | 646 | $66,233 |
| Mean Family Income | 646 | $67,634 |
| Median Household Income | 1,166 | $51,534 |
| Mean Household Income | 1,166 | $57,971 |
| Income Deficit | 646 | $0 |
| Wage / Income Gap (%) | 2,927 | 19.39% |
| Wage / Income Gap ($) | 2,927 | 80.61¢ per $1 |
| Gini / Inequality Index | 2,927 | 0.36 |
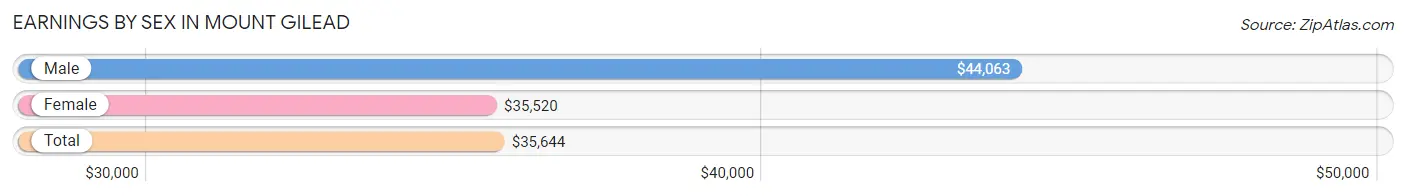
Earnings by Sex in Mount Gilead
Average Earnings in Mount Gilead are $35,644, $44,063 for men and $35,520 for women, a difference of 19.4%.
| Sex | Number | Average Earnings |
| Male | 550 (41.3%) | $44,063 |
| Female | 780 (58.7%) | $35,520 |
| Total | 1,330 (100.0%) | $35,644 |
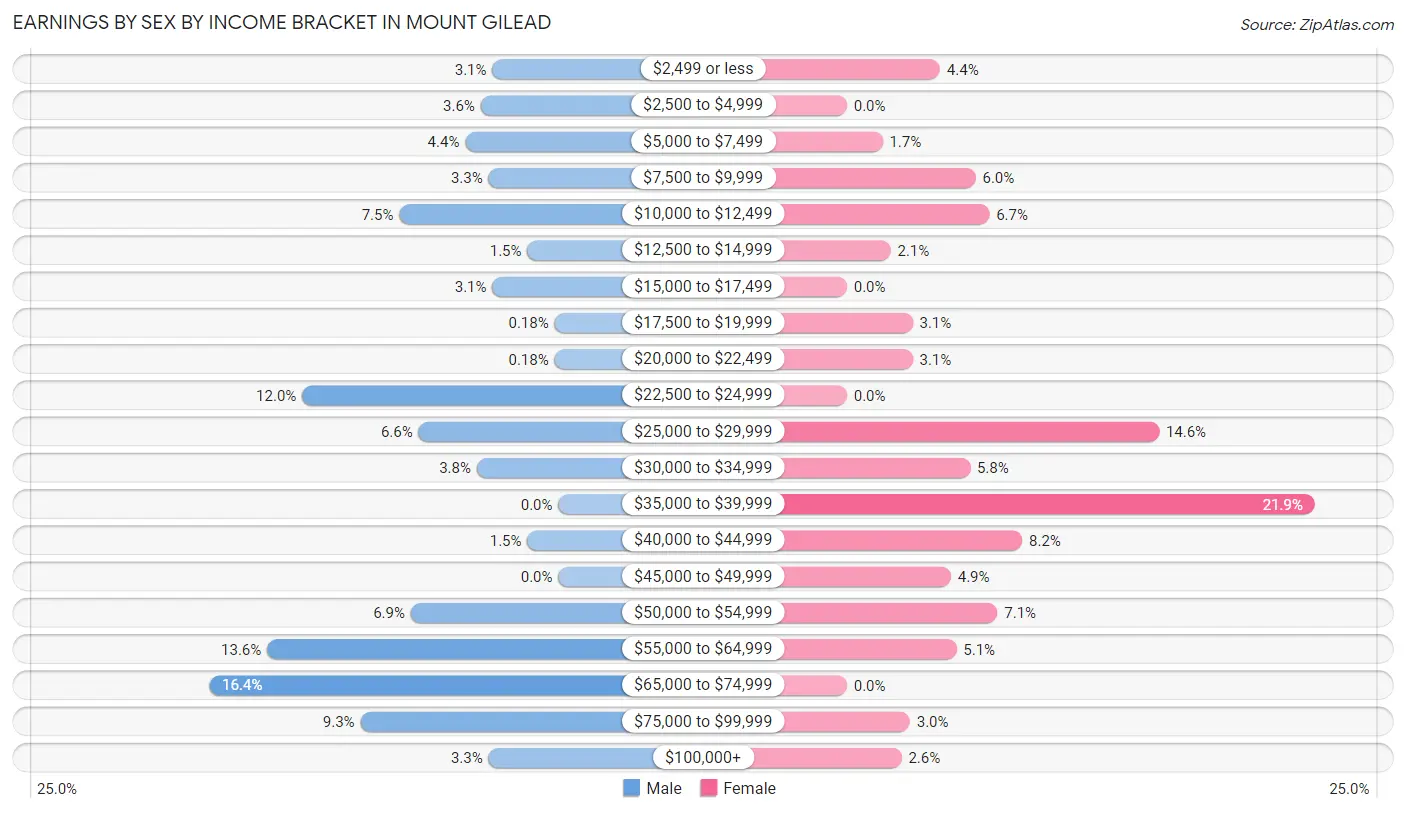
Earnings by Sex by Income Bracket in Mount Gilead
The most common earnings brackets in Mount Gilead are $65,000 to $74,999 for men (90 | 16.4%) and $35,000 to $39,999 for women (171 | 21.9%).
| Income | Male | Female |
| $2,499 or less | 17 (3.1%) | 34 (4.4%) |
| $2,500 to $4,999 | 20 (3.6%) | 0 (0.0%) |
| $5,000 to $7,499 | 24 (4.4%) | 13 (1.7%) |
| $7,500 to $9,999 | 18 (3.3%) | 47 (6.0%) |
| $10,000 to $12,499 | 41 (7.4%) | 52 (6.7%) |
| $12,500 to $14,999 | 8 (1.5%) | 16 (2.1%) |
| $15,000 to $17,499 | 17 (3.1%) | 0 (0.0%) |
| $17,500 to $19,999 | 1 (0.2%) | 24 (3.1%) |
| $20,000 to $22,499 | 1 (0.2%) | 24 (3.1%) |
| $22,500 to $24,999 | 66 (12.0%) | 0 (0.0%) |
| $25,000 to $29,999 | 36 (6.6%) | 114 (14.6%) |
| $30,000 to $34,999 | 21 (3.8%) | 45 (5.8%) |
| $35,000 to $39,999 | 0 (0.0%) | 171 (21.9%) |
| $40,000 to $44,999 | 8 (1.5%) | 64 (8.2%) |
| $45,000 to $49,999 | 0 (0.0%) | 38 (4.9%) |
| $50,000 to $54,999 | 38 (6.9%) | 55 (7.0%) |
| $55,000 to $64,999 | 75 (13.6%) | 40 (5.1%) |
| $65,000 to $74,999 | 90 (16.4%) | 0 (0.0%) |
| $75,000 to $99,999 | 51 (9.3%) | 23 (2.9%) |
| $100,000+ | 18 (3.3%) | 20 (2.6%) |
| Total | 550 (100.0%) | 780 (100.0%) |
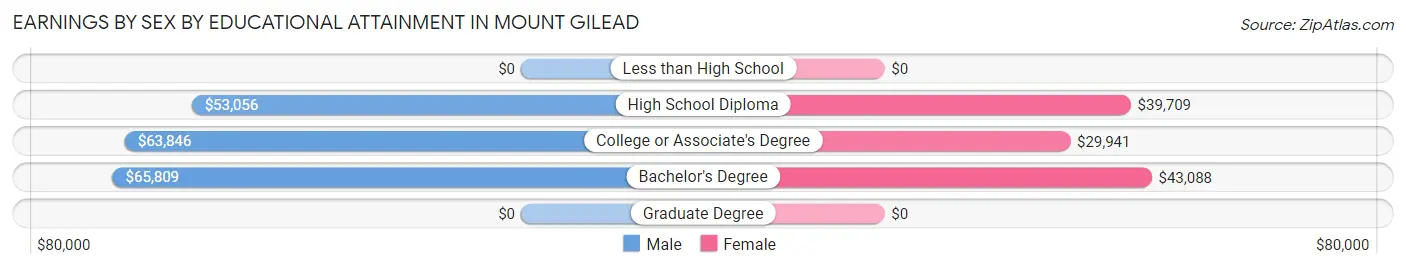
Earnings by Sex by Educational Attainment in Mount Gilead
Average earnings in Mount Gilead are $59,712 for men and $37,116 for women, a difference of 37.8%. Men with an educational attainment of bachelor's degree enjoy the highest average annual earnings of $65,809, while those with high school diploma education earn the least with $53,056. Women with an educational attainment of bachelor's degree earn the most with the average annual earnings of $43,088, while those with college or associate's degree education have the smallest earnings of $29,941.
| Educational Attainment | Male Income | Female Income |
| Less than High School | - | - |
| High School Diploma | $53,056 | $39,709 |
| College or Associate's Degree | $63,846 | $29,941 |
| Bachelor's Degree | $65,809 | $43,088 |
| Graduate Degree | - | - |
| Total | $59,712 | $37,116 |
Family Income in Mount Gilead
Family Income Brackets in Mount Gilead
According to the Mount Gilead family income data, there are 216 families falling into the $50,000 to $74,999 income range, which is the most common income bracket and makes up 33.4% of all families.
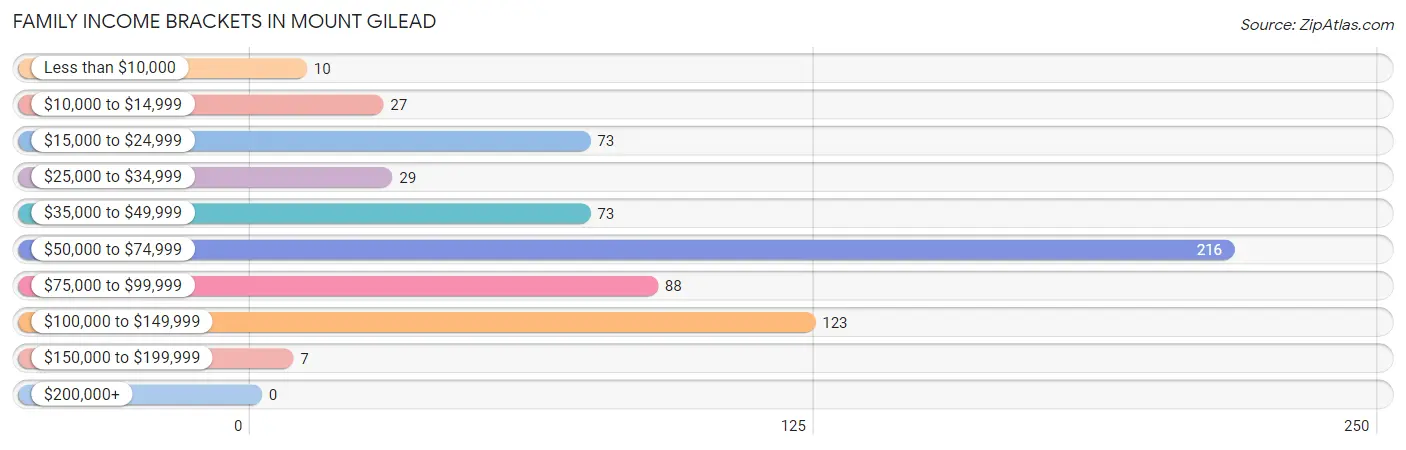
| Income Bracket | # Families | % Families |
| Less than $10,000 | 10 | 1.5% |
| $10,000 to $14,999 | 27 | 4.2% |
| $15,000 to $24,999 | 73 | 11.3% |
| $25,000 to $34,999 | 29 | 4.5% |
| $35,000 to $49,999 | 73 | 11.3% |
| $50,000 to $74,999 | 216 | 33.4% |
| $75,000 to $99,999 | 88 | 13.6% |
| $100,000 to $149,999 | 123 | 19.0% |
| $150,000 to $199,999 | 7 | 1.1% |
| $200,000+ | 0 | 0.0% |
Family Income by Famaliy Size in Mount Gilead
4-person families (148 | 22.9%) account for the highest median family income in Mount Gilead with $102,222 per family, while 3-person families (148 | 22.9%) have the highest median income of $26,667 per family member.
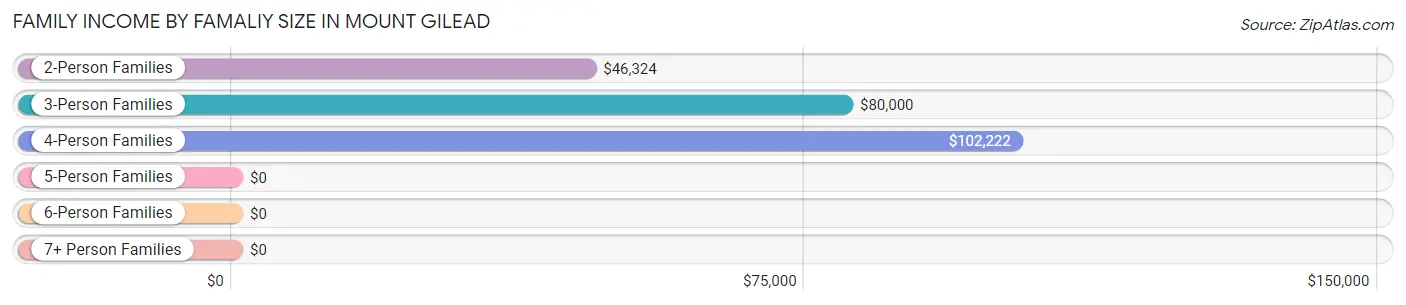
| Income Bracket | # Families | Median Income |
| 2-Person Families | 236 (36.5%) | $46,324 |
| 3-Person Families | 148 (22.9%) | $80,000 |
| 4-Person Families | 148 (22.9%) | $102,222 |
| 5-Person Families | 101 (15.6%) | $0 |
| 6-Person Families | 13 (2.0%) | $0 |
| 7+ Person Families | 0 (0.0%) | $0 |
| Total | 646 (100.0%) | $66,233 |
Family Income by Number of Earners in Mount Gilead
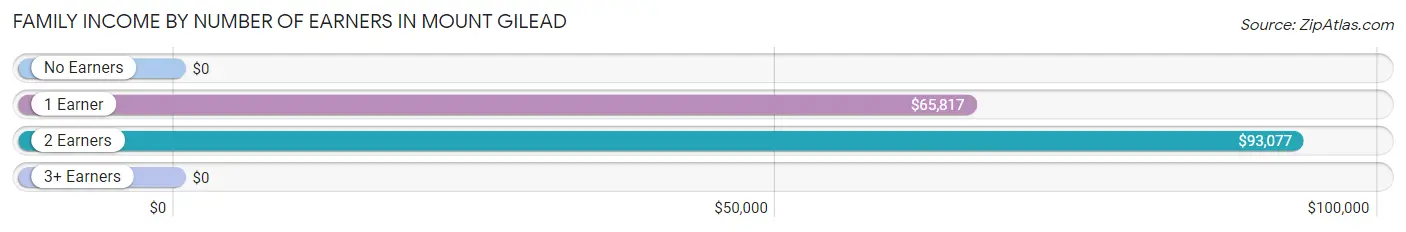
| Number of Earners | # Families | Median Income |
| No Earners | 89 (13.8%) | $0 |
| 1 Earner | 320 (49.5%) | $65,817 |
| 2 Earners | 210 (32.5%) | $93,077 |
| 3+ Earners | 27 (4.2%) | $0 |
| Total | 646 (100.0%) | $66,233 |
Household Income in Mount Gilead
Household Income Brackets in Mount Gilead
With 275 households falling in the category, the $50,000 to $74,999 income range is the most frequent in Mount Gilead, accounting for 23.6% of all households.
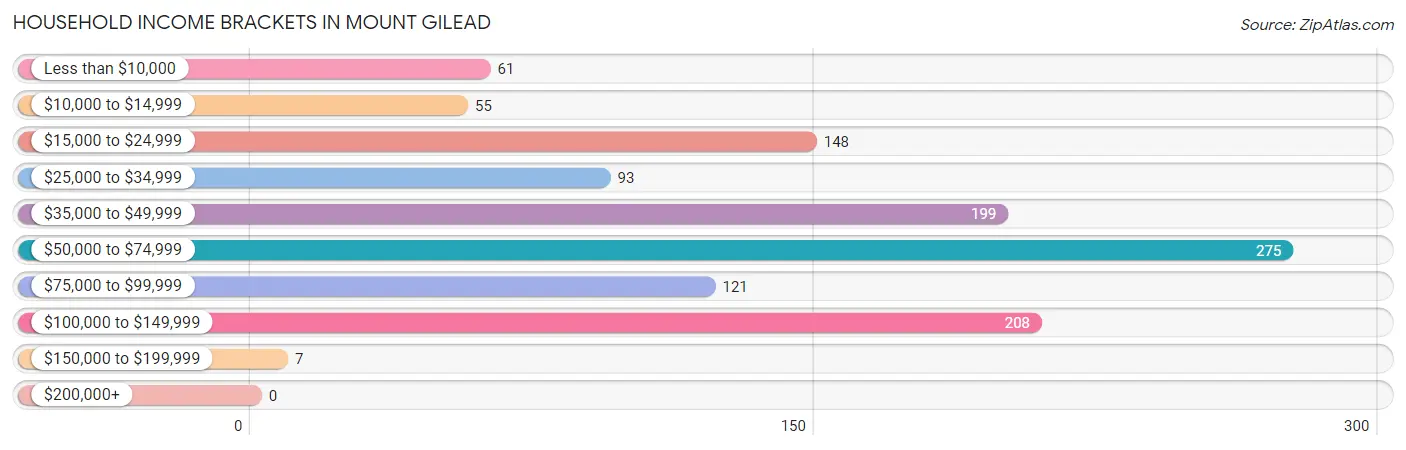
| Income Bracket | # Households | % Households |
| Less than $10,000 | 61 | 5.2% |
| $10,000 to $14,999 | 55 | 4.7% |
| $15,000 to $24,999 | 148 | 12.7% |
| $25,000 to $34,999 | 93 | 8.0% |
| $35,000 to $49,999 | 199 | 17.1% |
| $50,000 to $74,999 | 275 | 23.6% |
| $75,000 to $99,999 | 121 | 10.4% |
| $100,000 to $149,999 | 208 | 17.8% |
| $150,000 to $199,999 | 7 | 0.6% |
| $200,000+ | 0 | 0.0% |
Household Income by Householder Age in Mount Gilead
The median household income in Mount Gilead is $51,534, with the highest median household income of $72,763 found in the 45 to 64 years age bracket for the primary householder. A total of 290 households (24.9%) fall into this category. Meanwhile, the 65+ years age bracket for the primary householder has the lowest median household income of $37,818, with 351 households (30.1%) in this group.
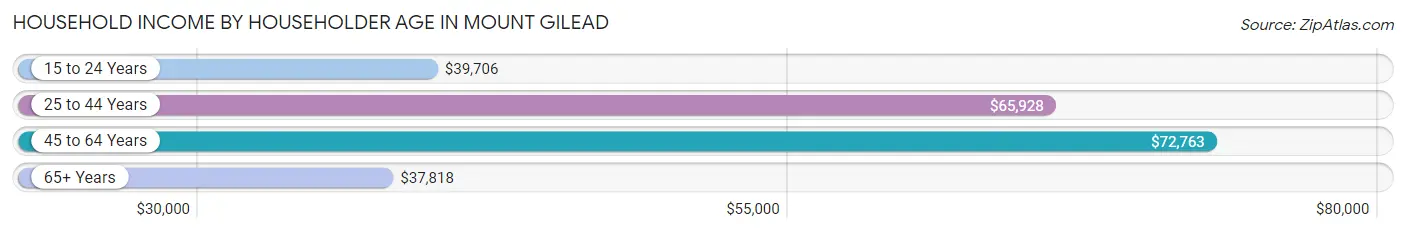
| Income Bracket | # Households | Median Income |
| 15 to 24 Years | 44 (3.8%) | $39,706 |
| 25 to 44 Years | 481 (41.2%) | $65,928 |
| 45 to 64 Years | 290 (24.9%) | $72,763 |
| 65+ Years | 351 (30.1%) | $37,818 |
| Total | 1,166 (100.0%) | $51,534 |
Poverty in Mount Gilead
Income Below Poverty by Sex and Age in Mount Gilead
With 10.4% poverty level for males and 17.3% for females among the residents of Mount Gilead, 45 to 54 year old males and 15 year old females are the most vulnerable to poverty, with 34 males (29.3%) and 23 females (100.0%) in their respective age groups living below the poverty level.
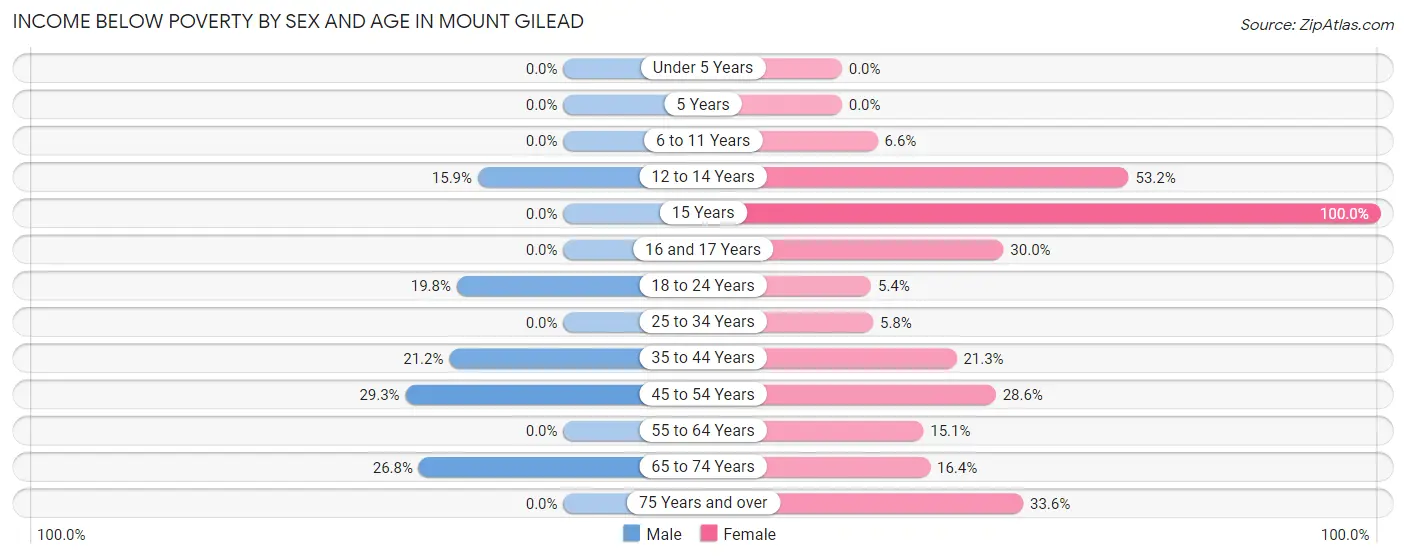
| Age Bracket | Male | Female |
| Under 5 Years | 0 (0.0%) | 0 (0.0%) |
| 5 Years | 0 (0.0%) | 0 (0.0%) |
| 6 to 11 Years | 0 (0.0%) | 16 (6.6%) |
| 12 to 14 Years | 10 (15.9%) | 33 (53.2%) |
| 15 Years | 0 (0.0%) | 23 (100.0%) |
| 16 and 17 Years | 0 (0.0%) | 6 (30.0%) |
| 18 to 24 Years | 18 (19.8%) | 7 (5.4%) |
| 25 to 34 Years | 0 (0.0%) | 16 (5.8%) |
| 35 to 44 Years | 29 (21.2%) | 50 (21.3%) |
| 45 to 54 Years | 34 (29.3%) | 36 (28.6%) |
| 55 to 64 Years | 0 (0.0%) | 18 (15.1%) |
| 65 to 74 Years | 22 (26.8%) | 19 (16.4%) |
| 75 Years and over | 0 (0.0%) | 73 (33.6%) |
| Total | 113 (10.4%) | 297 (17.3%) |
Income Above Poverty by Sex and Age in Mount Gilead
According to the poverty statistics in Mount Gilead, males aged under 5 years and females aged under 5 years are the age groups that are most secure financially, with 100.0% of males and 100.0% of females in these age groups living above the poverty line.
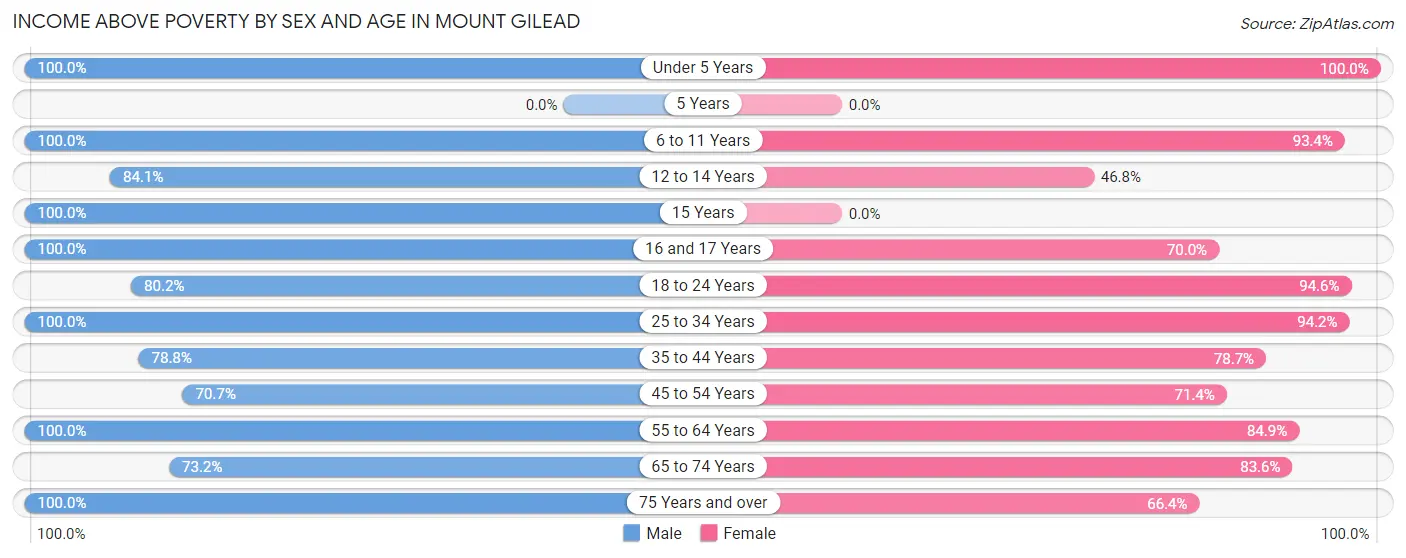
| Age Bracket | Male | Female |
| Under 5 Years | 61 (100.0%) | 151 (100.0%) |
| 5 Years | 0 (0.0%) | 0 (0.0%) |
| 6 to 11 Years | 197 (100.0%) | 225 (93.4%) |
| 12 to 14 Years | 53 (84.1%) | 29 (46.8%) |
| 15 Years | 17 (100.0%) | 0 (0.0%) |
| 16 and 17 Years | 18 (100.0%) | 14 (70.0%) |
| 18 to 24 Years | 73 (80.2%) | 122 (94.6%) |
| 25 to 34 Years | 167 (100.0%) | 260 (94.2%) |
| 35 to 44 Years | 108 (78.8%) | 185 (78.7%) |
| 45 to 54 Years | 82 (70.7%) | 90 (71.4%) |
| 55 to 64 Years | 57 (100.0%) | 101 (84.9%) |
| 65 to 74 Years | 60 (73.2%) | 97 (83.6%) |
| 75 Years and over | 75 (100.0%) | 144 (66.4%) |
| Total | 968 (89.5%) | 1,418 (82.7%) |
Income Below Poverty Among Married-Couple Families in Mount Gilead
The poverty statistics for married-couple families in Mount Gilead show that 9.6% or 29 of the total 303 families live below the poverty line. Families with no children have the highest poverty rate of 21.5%, comprising of 29 families. On the other hand, families with 1 or 2 children have the lowest poverty rate of 0.0%, which includes 0 families.
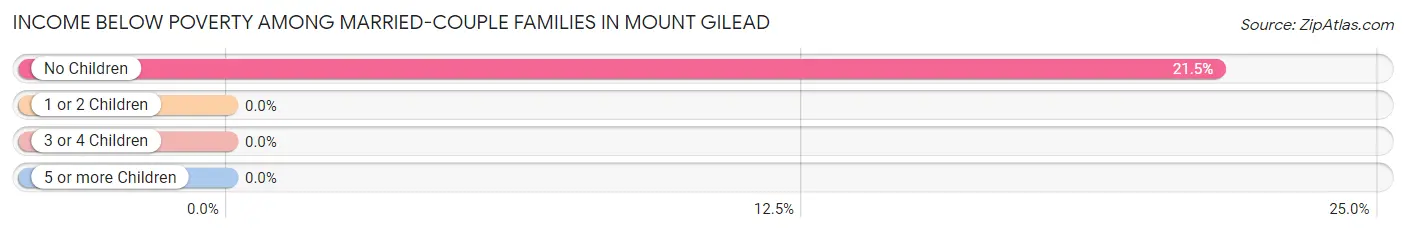
| Children | Above Poverty | Below Poverty |
| No Children | 106 (78.5%) | 29 (21.5%) |
| 1 or 2 Children | 155 (100.0%) | 0 (0.0%) |
| 3 or 4 Children | 13 (100.0%) | 0 (0.0%) |
| 5 or more Children | 0 (0.0%) | 0 (0.0%) |
| Total | 274 (90.4%) | 29 (9.6%) |
Income Below Poverty Among Single-Parent Households in Mount Gilead
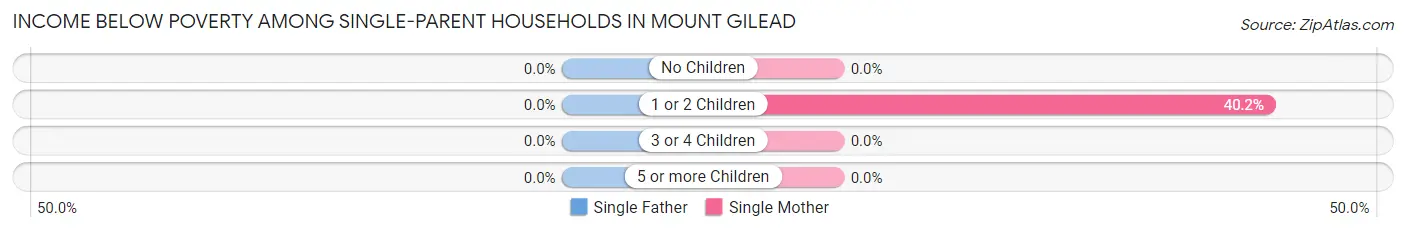
| Children | Single Father | Single Mother |
| No Children | 0 (0.0%) | 0 (0.0%) |
| 1 or 2 Children | 0 (0.0%) | 66 (40.2%) |
| 3 or 4 Children | 0 (0.0%) | 0 (0.0%) |
| 5 or more Children | 0 (0.0%) | 0 (0.0%) |
| Total | 0 (0.0%) | 66 (20.8%) |
Income Below Poverty Among Married-Couple vs Single-Parent Households in Mount Gilead
The poverty data for Mount Gilead shows that 29 of the married-couple family households (9.6%) and 66 of the single-parent households (19.2%) are living below the poverty level. Within the married-couple family households, those with no children have the highest poverty rate, with 29 households (21.5%) falling below the poverty line. Among the single-parent households, those with 1 or 2 children have the highest poverty rate, with 66 household (40.2%) living below poverty.
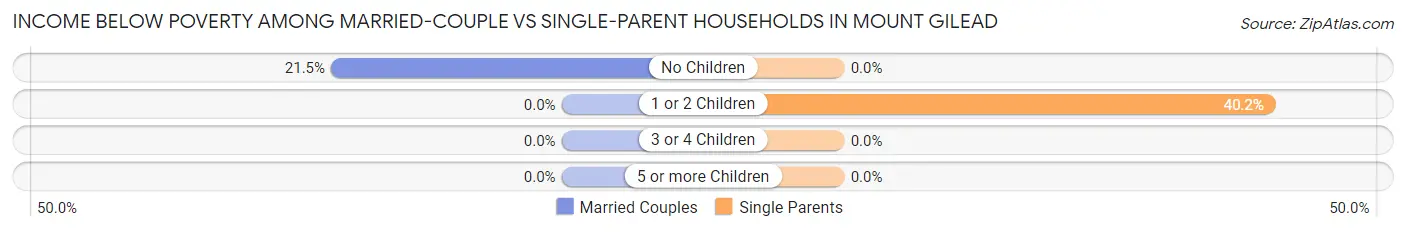
| Children | Married-Couple Families | Single-Parent Households |
| No Children | 29 (21.5%) | 0 (0.0%) |
| 1 or 2 Children | 0 (0.0%) | 66 (40.2%) |
| 3 or 4 Children | 0 (0.0%) | 0 (0.0%) |
| 5 or more Children | 0 (0.0%) | 0 (0.0%) |
| Total | 29 (9.6%) | 66 (19.2%) |
Race in Mount Gilead
The most populous races in Mount Gilead are White / Caucasian (2,499 | 85.4%), Hispanic or Latino (265 | 9.0%), and Two or more Races (260 | 8.9%).
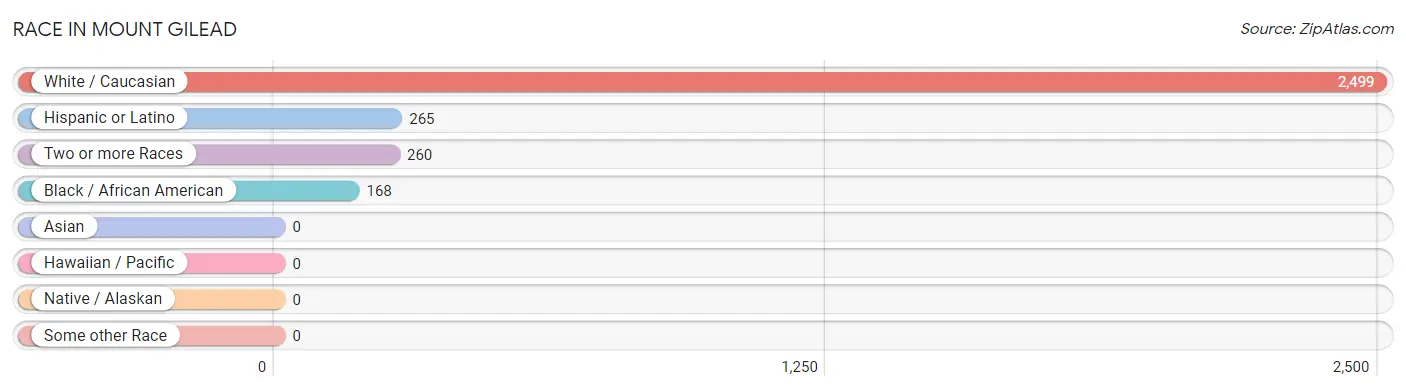
| Race | # Population | % Population |
| Asian | 0 | 0.0% |
| Black / African American | 168 | 5.7% |
| Hawaiian / Pacific | 0 | 0.0% |
| Hispanic or Latino | 265 | 9.0% |
| Native / Alaskan | 0 | 0.0% |
| White / Caucasian | 2,499 | 85.4% |
| Two or more Races | 260 | 8.9% |
| Some other Race | 0 | 0.0% |
| Total | 2,927 | 100.0% |
Ancestry in Mount Gilead
The most populous ancestries reported in Mount Gilead are German (697 | 23.8%), Scottish (236 | 8.1%), English (190 | 6.5%), Irish (186 | 6.4%), and American (153 | 5.2%), together accounting for 49.9% of all Mount Gilead residents.
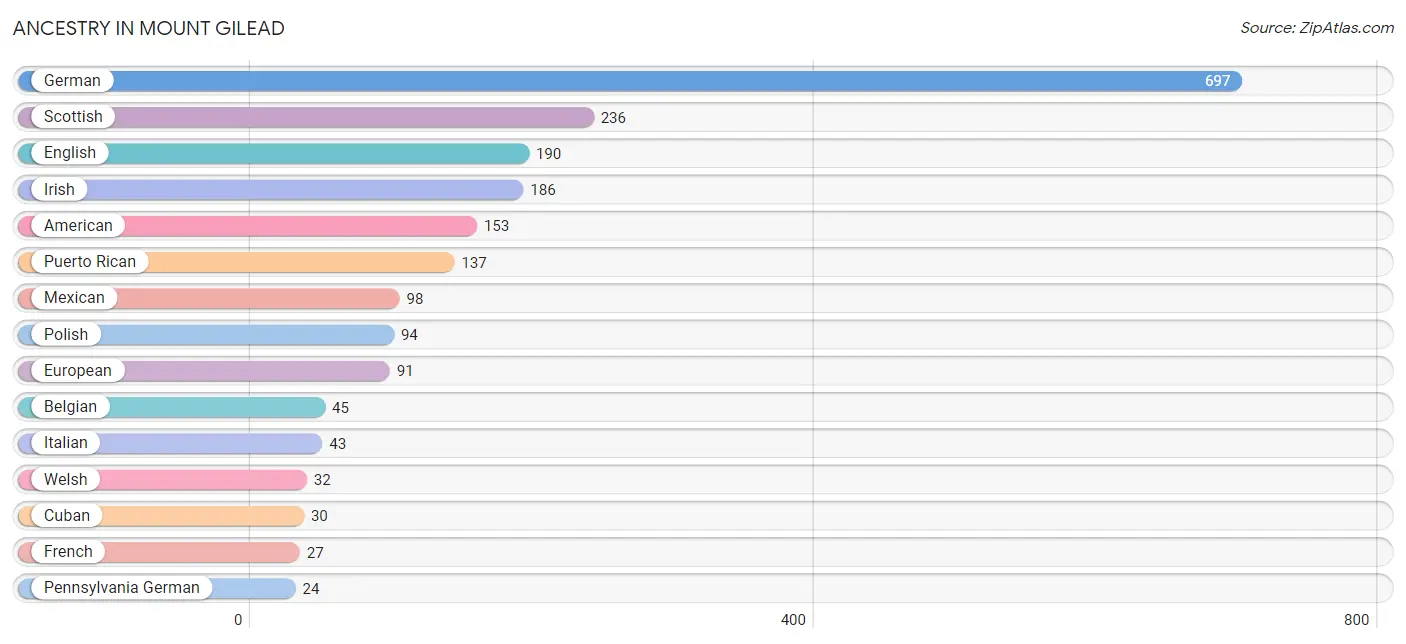
| Ancestry | # Population | % Population |
| African | 7 | 0.2% |
| American | 153 | 5.2% |
| Belgian | 45 | 1.5% |
| Blackfeet | 11 | 0.4% |
| British | 20 | 0.7% |
| Canadian | 9 | 0.3% |
| Cherokee | 11 | 0.4% |
| Cuban | 30 | 1.0% |
| Dutch | 21 | 0.7% |
| English | 190 | 6.5% |
| European | 91 | 3.1% |
| French | 27 | 0.9% |
| German | 697 | 23.8% |
| Irish | 186 | 6.4% |
| Italian | 43 | 1.5% |
| Mexican | 98 | 3.4% |
| Pennsylvania German | 24 | 0.8% |
| Polish | 94 | 3.2% |
| Puerto Rican | 137 | 4.7% |
| Scottish | 236 | 8.1% |
| Sioux | 11 | 0.4% |
| Subsaharan African | 7 | 0.2% |
| Swedish | 18 | 0.6% |
| Swiss | 6 | 0.2% |
| Welsh | 32 | 1.1% | View All 25 Rows |
Immigrants in Mount Gilead

| Immigration Origin | # Population | % Population | View All 0 Rows |
Sex and Age in Mount Gilead
Sex and Age in Mount Gilead
The most populous age groups in Mount Gilead are 5 to 9 Years (132 | 11.3%) for men and 30 to 34 Years (165 | 9.4%) for women.
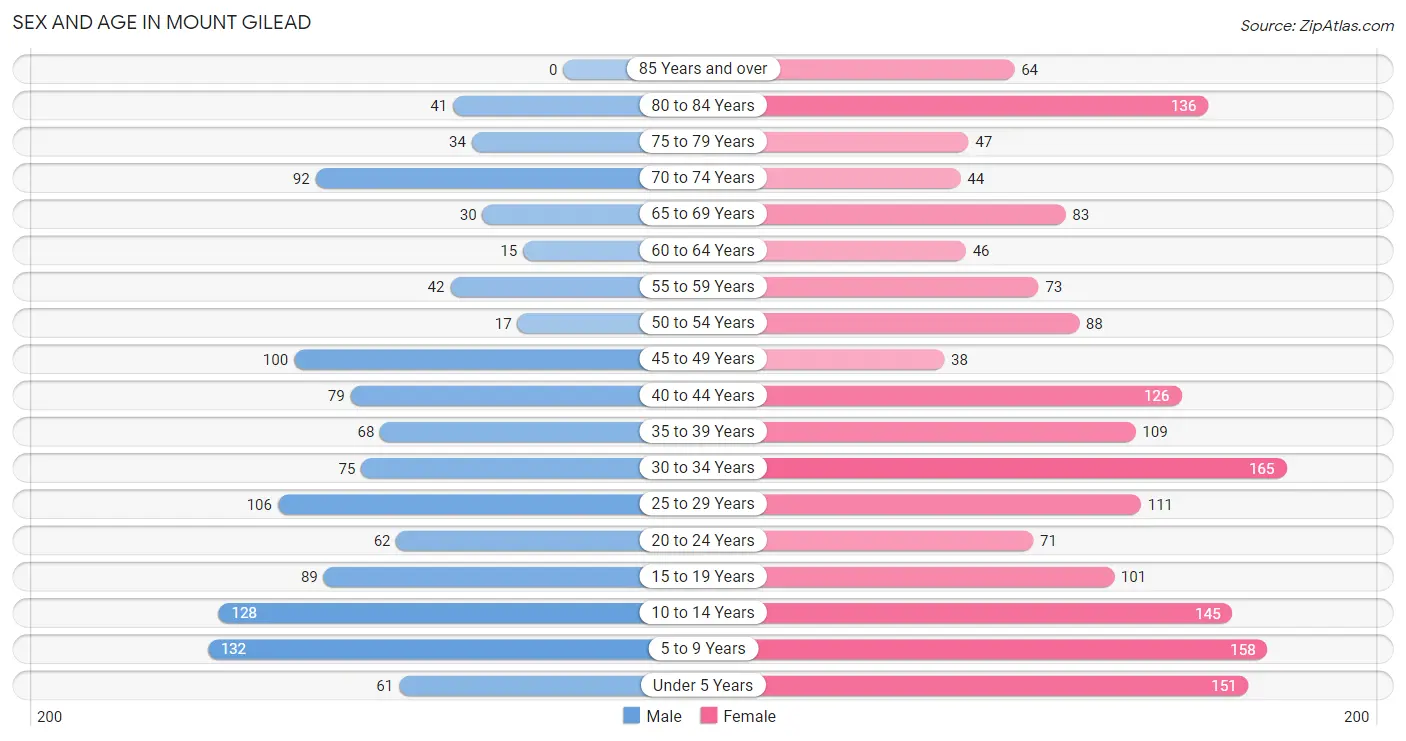
| Age Bracket | Male | Female |
| Under 5 Years | 61 (5.2%) | 151 (8.6%) |
| 5 to 9 Years | 132 (11.3%) | 158 (9.0%) |
| 10 to 14 Years | 128 (10.9%) | 145 (8.3%) |
| 15 to 19 Years | 89 (7.6%) | 101 (5.8%) |
| 20 to 24 Years | 62 (5.3%) | 71 (4.0%) |
| 25 to 29 Years | 106 (9.0%) | 111 (6.3%) |
| 30 to 34 Years | 75 (6.4%) | 165 (9.4%) |
| 35 to 39 Years | 68 (5.8%) | 109 (6.2%) |
| 40 to 44 Years | 79 (6.8%) | 126 (7.2%) |
| 45 to 49 Years | 100 (8.5%) | 38 (2.2%) |
| 50 to 54 Years | 17 (1.5%) | 88 (5.0%) |
| 55 to 59 Years | 42 (3.6%) | 73 (4.2%) |
| 60 to 64 Years | 15 (1.3%) | 46 (2.6%) |
| 65 to 69 Years | 30 (2.6%) | 83 (4.7%) |
| 70 to 74 Years | 92 (7.9%) | 44 (2.5%) |
| 75 to 79 Years | 34 (2.9%) | 47 (2.7%) |
| 80 to 84 Years | 41 (3.5%) | 136 (7.7%) |
| 85 Years and over | 0 (0.0%) | 64 (3.6%) |
| Total | 1,171 (100.0%) | 1,756 (100.0%) |
Families and Households in Mount Gilead
Median Family Size in Mount Gilead
The median family size in Mount Gilead is 3.18 persons per family, with married-couple families (303 | 46.9%) accounting for the largest median family size of 3.33 persons per family. On the other hand, single female/mother families (317 | 49.1%) represent the smallest median family size with 3.05 persons per family.
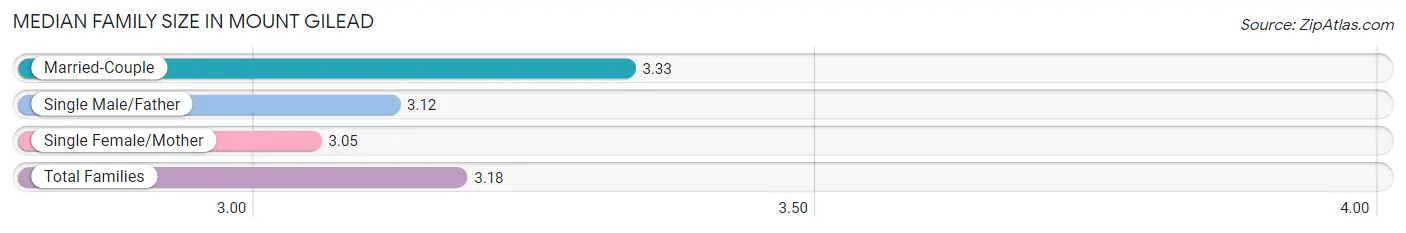
| Family Type | # Families | Family Size |
| Married-Couple | 303 (46.9%) | 3.33 |
| Single Male/Father | 26 (4.0%) | 3.12 |
| Single Female/Mother | 317 (49.1%) | 3.05 |
| Total Families | 646 (100.0%) | 3.18 |
Median Household Size in Mount Gilead
The median household size in Mount Gilead is 2.40 persons per household, with single female/mother households (317 | 27.2%) accounting for the largest median household size of 3.56 persons per household. non-family households (520 | 44.6%) represent the smallest median household size with 1.11 persons per household.
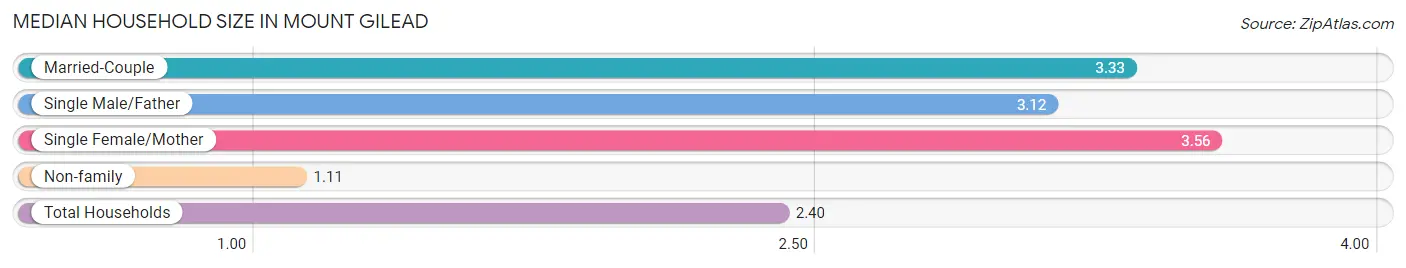
| Household Type | # Households | Household Size |
| Married-Couple | 303 (26.0%) | 3.33 |
| Single Male/Father | 26 (2.2%) | 3.12 |
| Single Female/Mother | 317 (27.2%) | 3.56 |
| Non-family | 520 (44.6%) | 1.11 |
| Total Households | 1,166 (100.0%) | 2.40 |
Household Size by Marriage Status in Mount Gilead
Out of a total of 1,166 households in Mount Gilead, 646 (55.4%) are family households, while 520 (44.6%) are nonfamily households. The most numerous type of family households are 4-person households, comprising 233, and the most common type of nonfamily households are 1-person households, comprising 413.
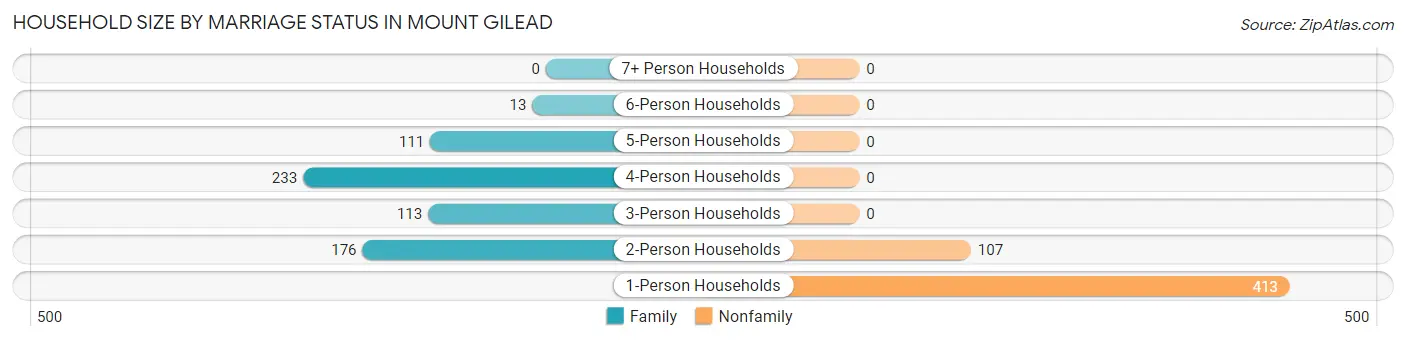
| Household Size | Family Households | Nonfamily Households |
| 1-Person Households | - | 413 (35.4%) |
| 2-Person Households | 176 (15.1%) | 107 (9.2%) |
| 3-Person Households | 113 (9.7%) | 0 (0.0%) |
| 4-Person Households | 233 (20.0%) | 0 (0.0%) |
| 5-Person Households | 111 (9.5%) | 0 (0.0%) |
| 6-Person Households | 13 (1.1%) | 0 (0.0%) |
| 7+ Person Households | 0 (0.0%) | 0 (0.0%) |
| Total | 646 (55.4%) | 520 (44.6%) |
Female Fertility in Mount Gilead
Fertility by Age in Mount Gilead
Average fertility rate in Mount Gilead is 67.0 births per 1,000 women. Women in the age bracket of 20 to 34 years have the highest fertility rate with 144.0 births per 1,000 women. Women in the age bracket of 20 to 34 years acount for 100.0% of all women with births.
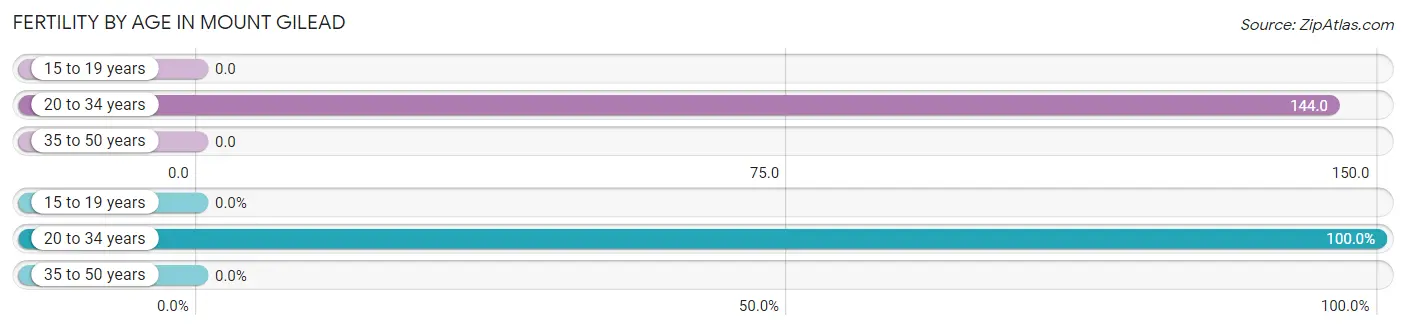
| Age Bracket | Women with Births | Births / 1,000 Women |
| 15 to 19 years | 0 (0.0%) | 0.0 |
| 20 to 34 years | 50 (100.0%) | 144.0 |
| 35 to 50 years | 0 (0.0%) | 0.0 |
| Total | 50 (100.0%) | 67.0 |
Fertility by Age by Marriage Status in Mount Gilead
66.0% of women with births (50) in Mount Gilead are married. The highest percentage of unmarried women with births falls into 20 to 34 years age bracket with 34.0% of them unmarried at the time of birth, while the lowest percentage of unmarried women with births belong to 20 to 34 years age bracket with 34.0% of them unmarried.
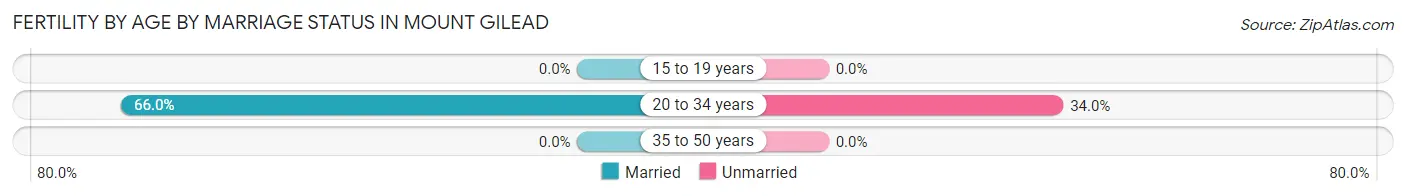
| Age Bracket | Married | Unmarried |
| 15 to 19 years | 0 (0.0%) | 0 (0.0%) |
| 20 to 34 years | 33 (66.0%) | 17 (34.0%) |
| 35 to 50 years | 0 (0.0%) | 0 (0.0%) |
| Total | 33 (66.0%) | 17 (34.0%) |
Fertility by Education in Mount Gilead
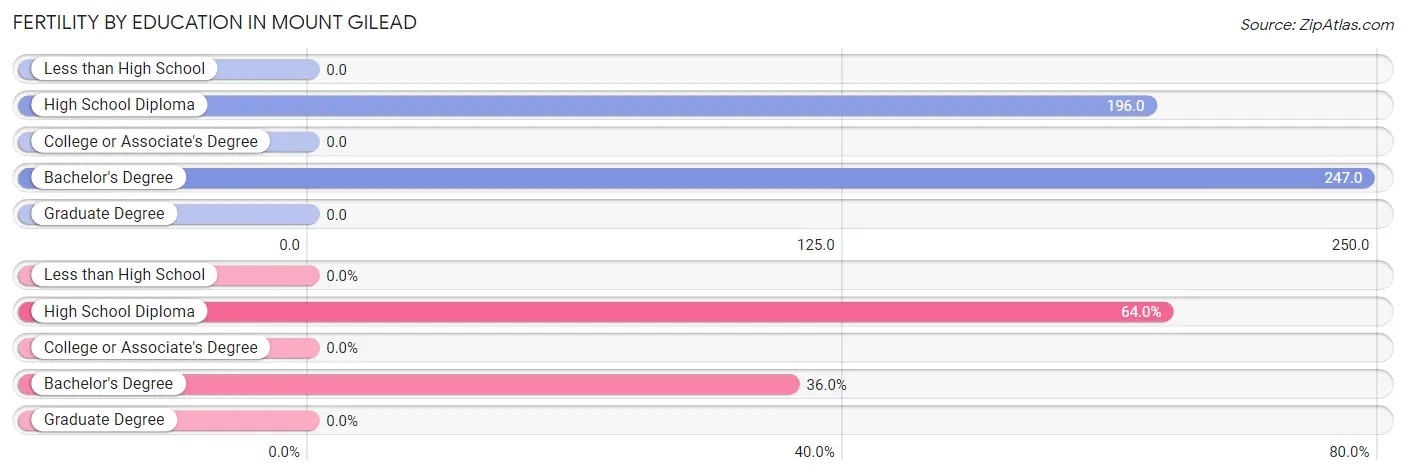
| Educational Attainment | Women with Births | Births / 1,000 Women |
| Less than High School | 0 (0.0%) | 0.0 |
| High School Diploma | 32 (64.0%) | 196.0 |
| College or Associate's Degree | 0 (0.0%) | 0.0 |
| Bachelor's Degree | 18 (36.0%) | 247.0 |
| Graduate Degree | 0 (0.0%) | 0.0 |
| Total | 50 (100.0%) | 67.0 |
Fertility by Education by Marriage Status in Mount Gilead
34.0% of women with births in Mount Gilead are unmarried. Women with the educational attainment of bachelor's degree are most likely to be married with 100.0% of them married at childbirth, while women with the educational attainment of high school diploma are least likely to be married with 53.1% of them unmarried at childbirth.
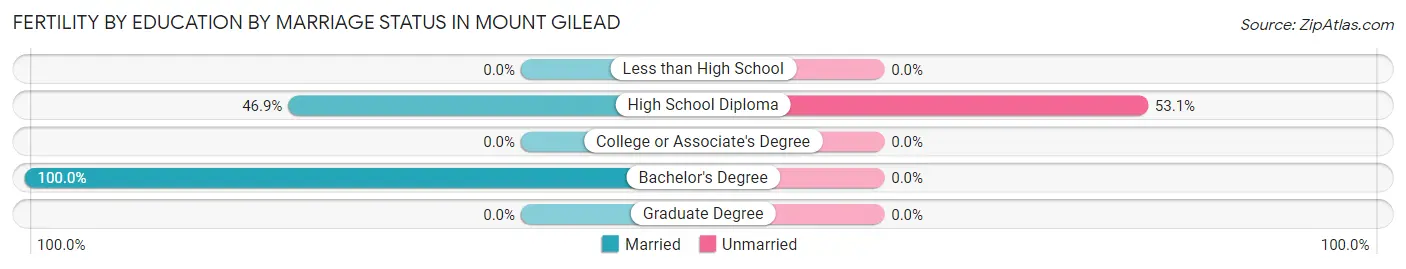
| Educational Attainment | Married | Unmarried |
| Less than High School | 0 (0.0%) | 0 (0.0%) |
| High School Diploma | 15 (46.9%) | 17 (53.1%) |
| College or Associate's Degree | 0 (0.0%) | 0 (0.0%) |
| Bachelor's Degree | 18 (100.0%) | 0 (0.0%) |
| Graduate Degree | 0 (0.0%) | 0 (0.0%) |
| Total | 33 (66.0%) | 17 (34.0%) |
Employment Characteristics in Mount Gilead
Employment by Class of Employer in Mount Gilead
Among the 1,262 employed individuals in Mount Gilead, private company employees (817 | 64.7%), not-for-profit organizations (183 | 14.5%), and local government employees (149 | 11.8%) make up the most common classes of employment.
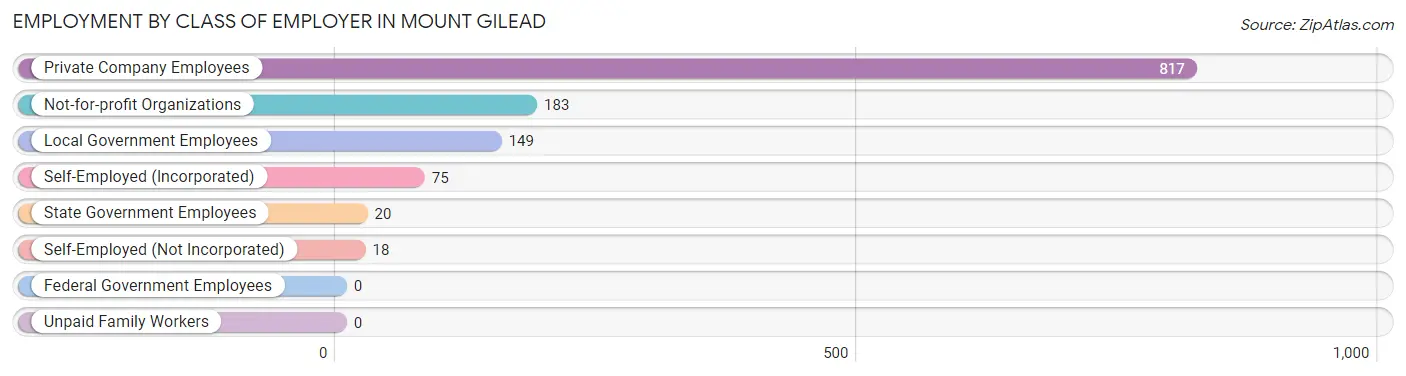
| Employer Class | # Employees | % Employees |
| Private Company Employees | 817 | 64.7% |
| Self-Employed (Incorporated) | 75 | 5.9% |
| Self-Employed (Not Incorporated) | 18 | 1.4% |
| Not-for-profit Organizations | 183 | 14.5% |
| Local Government Employees | 149 | 11.8% |
| State Government Employees | 20 | 1.6% |
| Federal Government Employees | 0 | 0.0% |
| Unpaid Family Workers | 0 | 0.0% |
| Total | 1,262 | 100.0% |
Employment Status by Age in Mount Gilead
According to the labor force statistics for Mount Gilead, out of the total population over 16 years of age (2,112), 61.4% or 1,297 individuals are in the labor force, with 2.6% or 34 of them unemployed. The age group with the highest labor force participation rate is 30 to 34 years, with 94.6% or 227 individuals in the labor force. Within the labor force, the 20 to 24 years age range has the highest percentage of unemployed individuals, with 16.5% or 15 of them being unemployed.
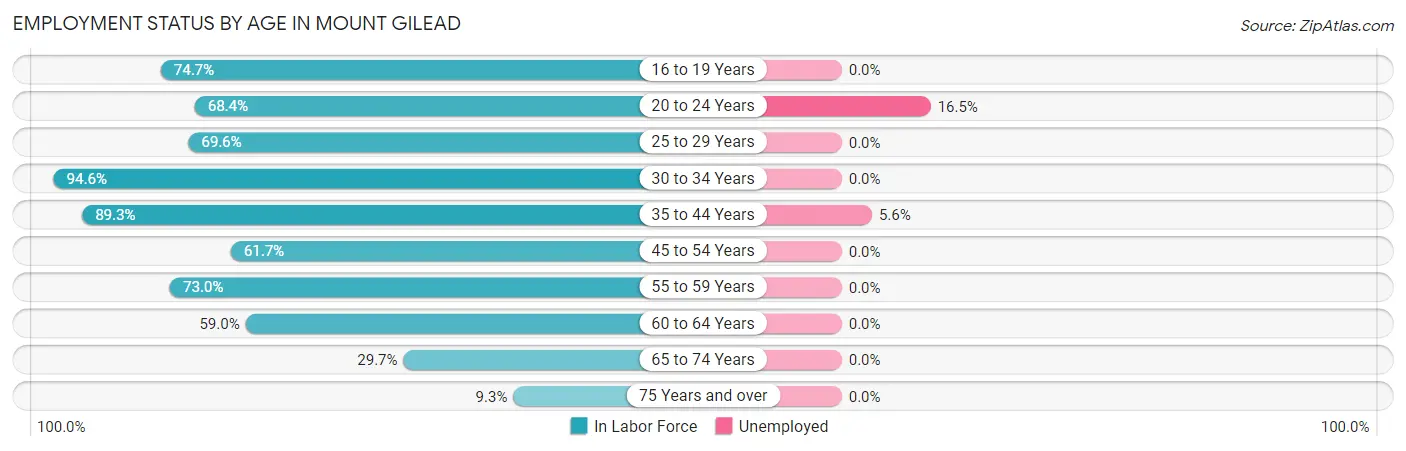
| Age Bracket | In Labor Force | Unemployed |
| 16 to 19 Years | 112 (74.7%) | 0 (0.0%) |
| 20 to 24 Years | 91 (68.4%) | 15 (16.5%) |
| 25 to 29 Years | 151 (69.6%) | 0 (0.0%) |
| 30 to 34 Years | 227 (94.6%) | 0 (0.0%) |
| 35 to 44 Years | 341 (89.3%) | 19 (5.6%) |
| 45 to 54 Years | 150 (61.7%) | 0 (0.0%) |
| 55 to 59 Years | 84 (73.0%) | 0 (0.0%) |
| 60 to 64 Years | 36 (59.0%) | 0 (0.0%) |
| 65 to 74 Years | 74 (29.7%) | 0 (0.0%) |
| 75 Years and over | 30 (9.3%) | 0 (0.0%) |
| Total | 1,297 (61.4%) | 34 (2.6%) |
Employment Status by Educational Attainment in Mount Gilead
According to labor force statistics for Mount Gilead, 78.6% of individuals (989) out of the total population between 25 and 64 years of age (1,258) are in the labor force, with 1.9% or 19 of them being unemployed. The group with the highest labor force participation rate are those with the educational attainment of bachelor's degree or higher, with 93.0% or 146 individuals in the labor force. Within the labor force, individuals with college / associate degree education have the highest percentage of unemployment, with 5.6% or 19 of them being unemployed.
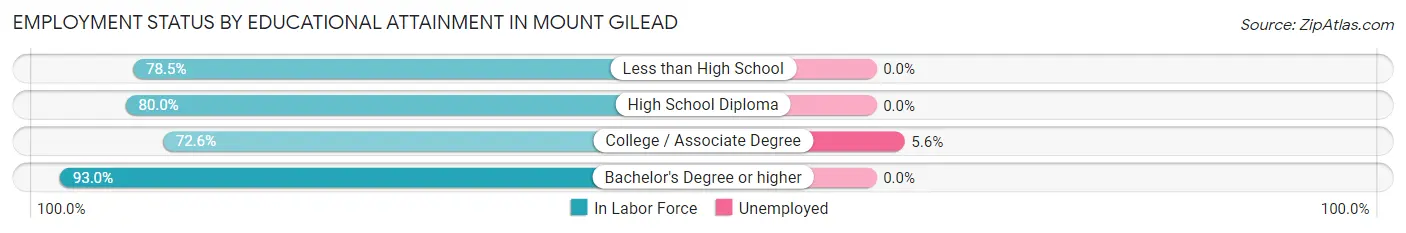
| Educational Attainment | In Labor Force | Unemployed |
| Less than High School | 175 (78.5%) | 0 (0.0%) |
| High School Diploma | 329 (80.0%) | 0 (0.0%) |
| College / Associate Degree | 339 (72.6%) | 26 (5.6%) |
| Bachelor's Degree or higher | 146 (93.0%) | 0 (0.0%) |
| Total | 989 (78.6%) | 24 (1.9%) |
Employment Occupations by Sex in Mount Gilead
Management, Business, Science and Arts Occupations
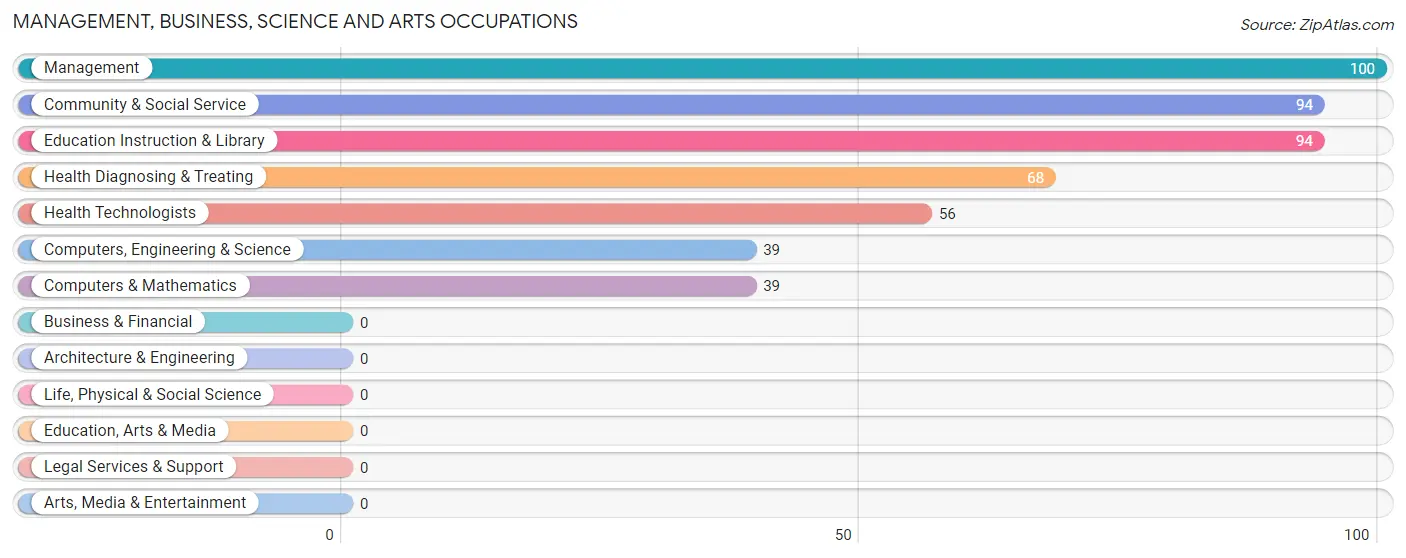
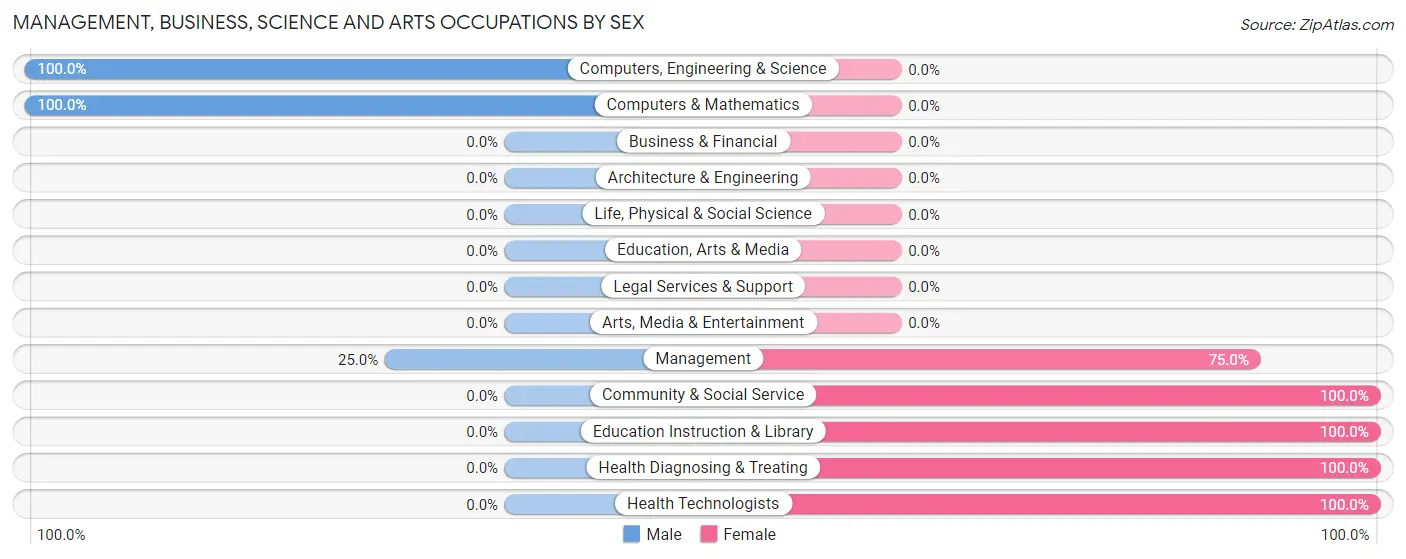
The most common Management, Business, Science and Arts occupations in Mount Gilead are Management (100 | 7.9%), Community & Social Service (94 | 7.4%), Education Instruction & Library (94 | 7.4%), Health Diagnosing & Treating (68 | 5.4%), and Health Technologists (56 | 4.4%).
Management, Business, Science and Arts Occupations by Sex
Within the Management, Business, Science and Arts occupations in Mount Gilead, the most male-oriented occupations are Computers, Engineering & Science (100.0%), Computers & Mathematics (100.0%), and Management (25.0%), while the most female-oriented occupations are Community & Social Service (100.0%), Education Instruction & Library (100.0%), and Health Diagnosing & Treating (100.0%).
| Occupation | Male | Female |
| Management | 25 (25.0%) | 75 (75.0%) |
| Business & Financial | 0 (0.0%) | 0 (0.0%) |
| Computers, Engineering & Science | 39 (100.0%) | 0 (0.0%) |
| Computers & Mathematics | 39 (100.0%) | 0 (0.0%) |
| Architecture & Engineering | 0 (0.0%) | 0 (0.0%) |
| Life, Physical & Social Science | 0 (0.0%) | 0 (0.0%) |
| Community & Social Service | 0 (0.0%) | 94 (100.0%) |
| Education, Arts & Media | 0 (0.0%) | 0 (0.0%) |
| Legal Services & Support | 0 (0.0%) | 0 (0.0%) |
| Education Instruction & Library | 0 (0.0%) | 94 (100.0%) |
| Arts, Media & Entertainment | 0 (0.0%) | 0 (0.0%) |
| Health Diagnosing & Treating | 0 (0.0%) | 68 (100.0%) |
| Health Technologists | 0 (0.0%) | 56 (100.0%) |
| Total (Category) | 64 (21.3%) | 237 (78.7%) |
| Total (Overall) | 533 (42.2%) | 729 (57.8%) |
Services Occupations
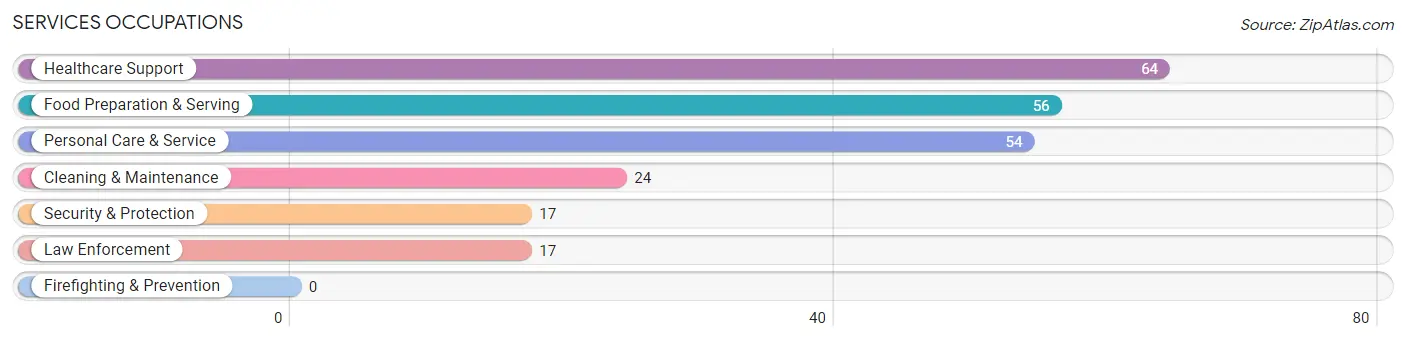
The most common Services occupations in Mount Gilead are Healthcare Support (64 | 5.1%), Food Preparation & Serving (56 | 4.4%), Personal Care & Service (54 | 4.3%), Cleaning & Maintenance (24 | 1.9%), and Security & Protection (17 | 1.3%).
Services Occupations by Sex
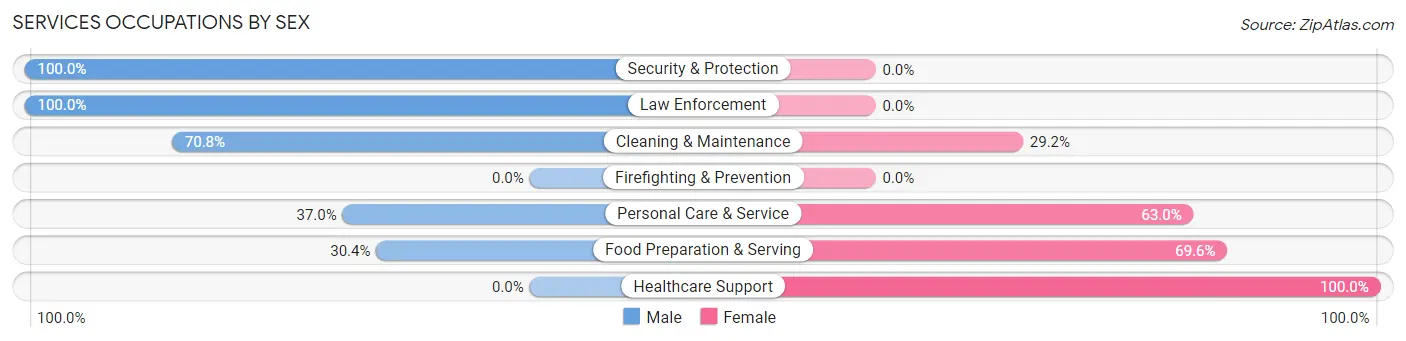
Within the Services occupations in Mount Gilead, the most male-oriented occupations are Security & Protection (100.0%), Law Enforcement (100.0%), and Cleaning & Maintenance (70.8%), while the most female-oriented occupations are Healthcare Support (100.0%), Food Preparation & Serving (69.6%), and Personal Care & Service (63.0%).
| Occupation | Male | Female |
| Healthcare Support | 0 (0.0%) | 64 (100.0%) |
| Security & Protection | 17 (100.0%) | 0 (0.0%) |
| Firefighting & Prevention | 0 (0.0%) | 0 (0.0%) |
| Law Enforcement | 17 (100.0%) | 0 (0.0%) |
| Food Preparation & Serving | 17 (30.4%) | 39 (69.6%) |
| Cleaning & Maintenance | 17 (70.8%) | 7 (29.2%) |
| Personal Care & Service | 20 (37.0%) | 34 (63.0%) |
| Total (Category) | 71 (33.0%) | 144 (67.0%) |
| Total (Overall) | 533 (42.2%) | 729 (57.8%) |
Sales and Office Occupations
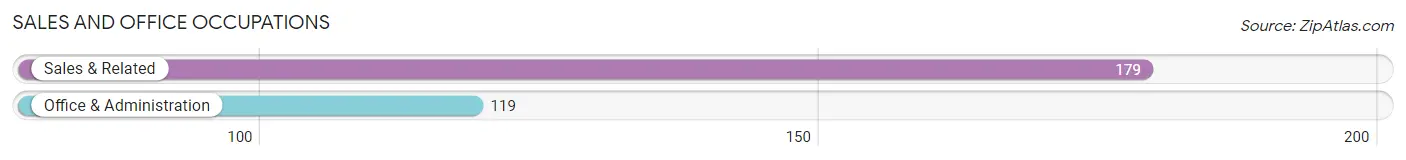
The most common Sales and Office occupations in Mount Gilead are Sales & Related (179 | 14.2%), and Office & Administration (119 | 9.4%).
Sales and Office Occupations by Sex
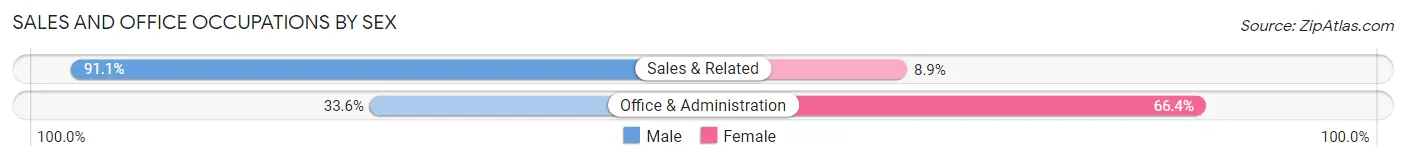
| Occupation | Male | Female |
| Sales & Related | 163 (91.1%) | 16 (8.9%) |
| Office & Administration | 40 (33.6%) | 79 (66.4%) |
| Total (Category) | 203 (68.1%) | 95 (31.9%) |
| Total (Overall) | 533 (42.2%) | 729 (57.8%) |
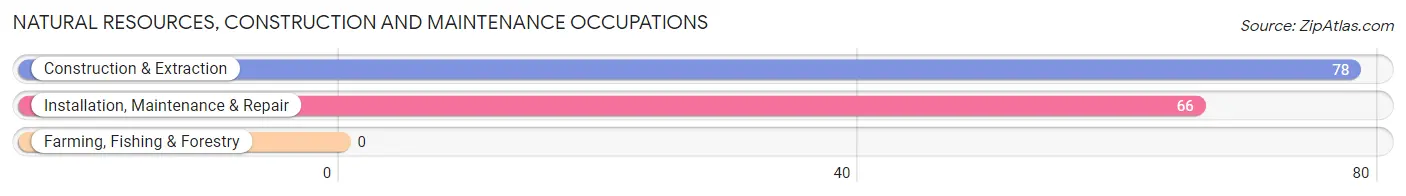
Natural Resources, Construction and Maintenance Occupations
The most common Natural Resources, Construction and Maintenance occupations in Mount Gilead are Construction & Extraction (78 | 6.2%), and Installation, Maintenance & Repair (66 | 5.2%).
Natural Resources, Construction and Maintenance Occupations by Sex
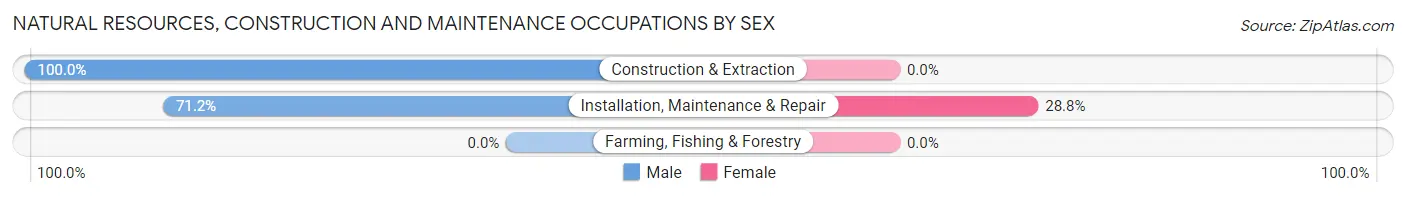
| Occupation | Male | Female |
| Farming, Fishing & Forestry | 0 (0.0%) | 0 (0.0%) |
| Construction & Extraction | 78 (100.0%) | 0 (0.0%) |
| Installation, Maintenance & Repair | 47 (71.2%) | 19 (28.8%) |
| Total (Category) | 125 (86.8%) | 19 (13.2%) |
| Total (Overall) | 533 (42.2%) | 729 (57.8%) |
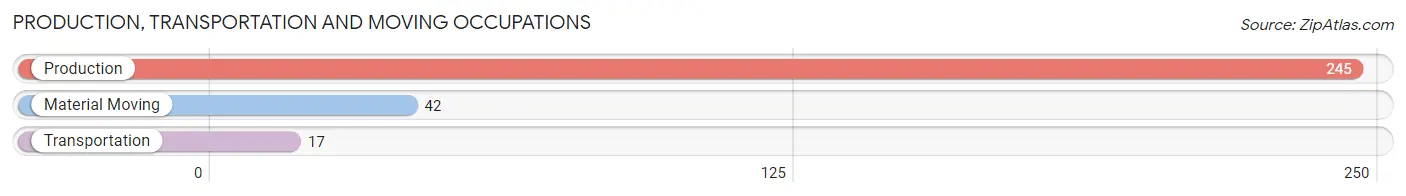
Production, Transportation and Moving Occupations
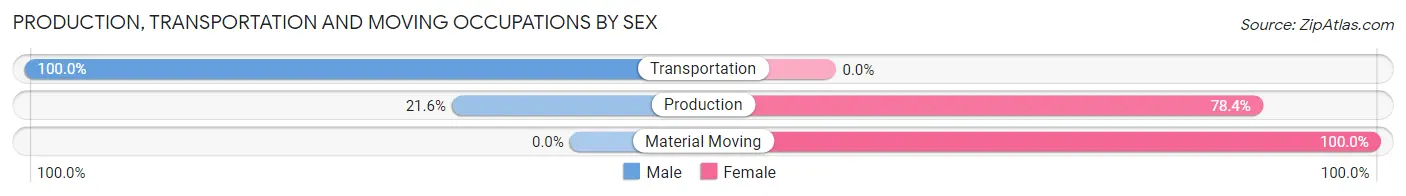
The most common Production, Transportation and Moving occupations in Mount Gilead are Production (245 | 19.4%), Material Moving (42 | 3.3%), and Transportation (17 | 1.3%).
Production, Transportation and Moving Occupations by Sex
| Occupation | Male | Female |
| Production | 53 (21.6%) | 192 (78.4%) |
| Transportation | 17 (100.0%) | 0 (0.0%) |
| Material Moving | 0 (0.0%) | 42 (100.0%) |
| Total (Category) | 70 (23.0%) | 234 (77.0%) |
| Total (Overall) | 533 (42.2%) | 729 (57.8%) |
Employment Industries by Sex in Mount Gilead
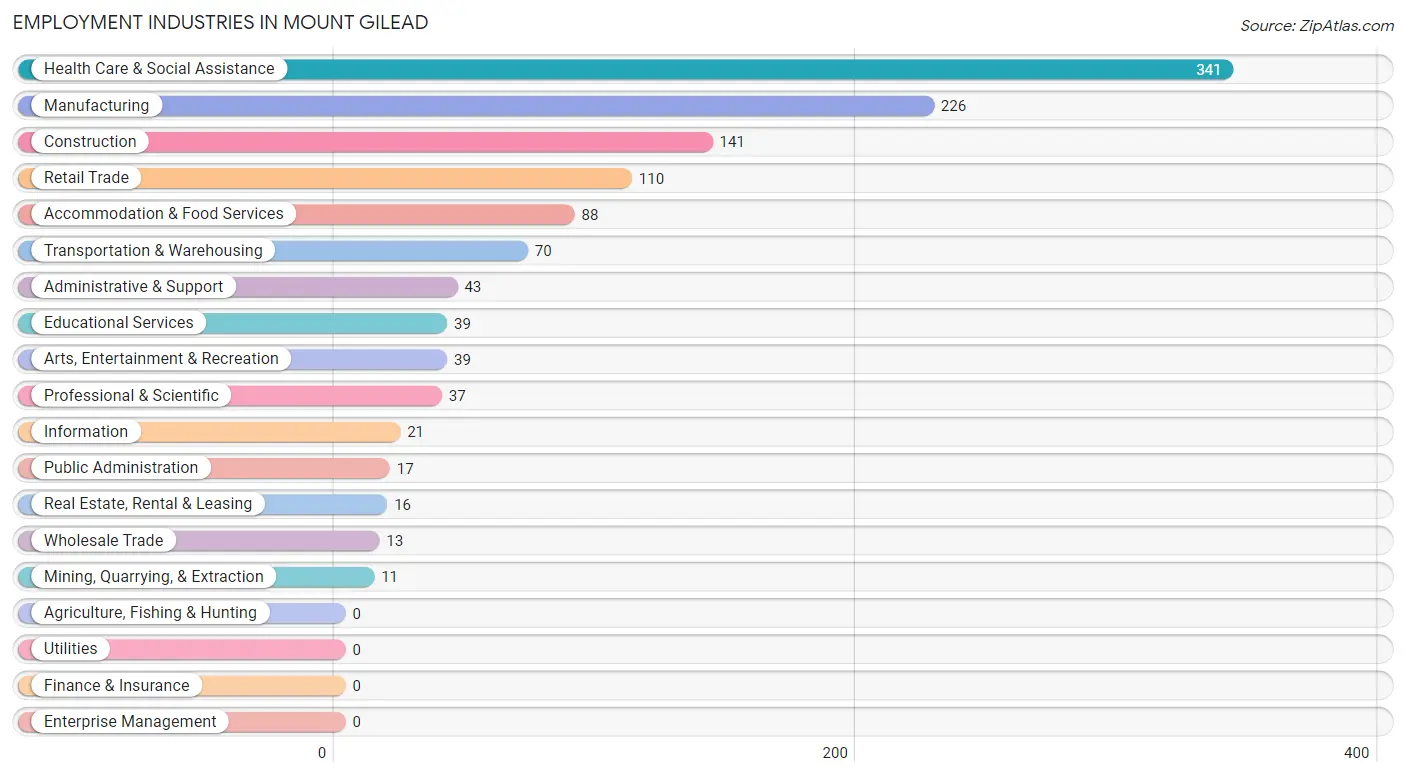
Employment Industries in Mount Gilead
The major employment industries in Mount Gilead include Health Care & Social Assistance (341 | 27.0%), Manufacturing (226 | 17.9%), Construction (141 | 11.2%), Retail Trade (110 | 8.7%), and Accommodation & Food Services (88 | 7.0%).
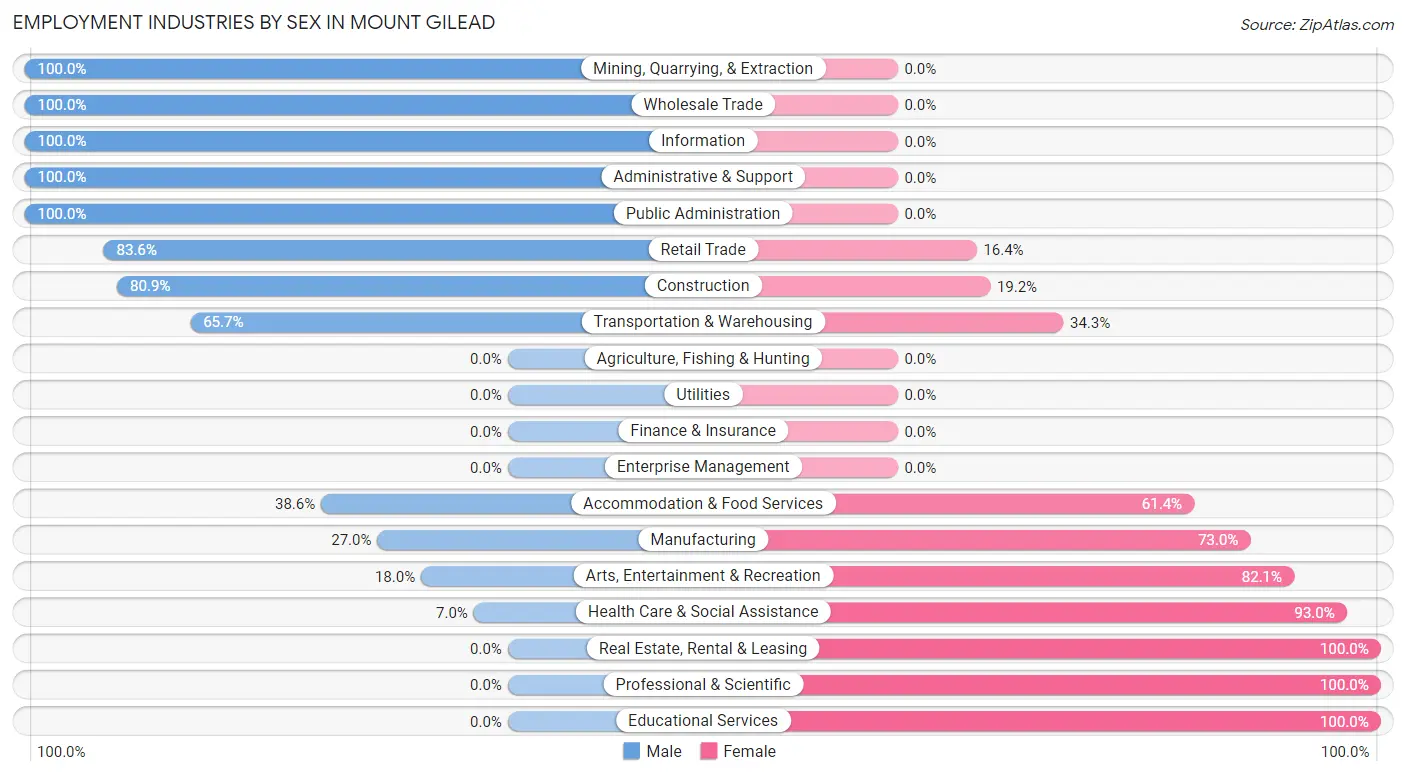
Employment Industries by Sex in Mount Gilead
The Mount Gilead industries that see more men than women are Mining, Quarrying, & Extraction (100.0%), Wholesale Trade (100.0%), and Information (100.0%), whereas the industries that tend to have a higher number of women are Real Estate, Rental & Leasing (100.0%), Professional & Scientific (100.0%), and Educational Services (100.0%).
| Industry | Male | Female |
| Agriculture, Fishing & Hunting | 0 (0.0%) | 0 (0.0%) |
| Mining, Quarrying, & Extraction | 11 (100.0%) | 0 (0.0%) |
| Construction | 114 (80.8%) | 27 (19.2%) |
| Manufacturing | 61 (27.0%) | 165 (73.0%) |
| Wholesale Trade | 13 (100.0%) | 0 (0.0%) |
| Retail Trade | 92 (83.6%) | 18 (16.4%) |
| Transportation & Warehousing | 46 (65.7%) | 24 (34.3%) |
| Utilities | 0 (0.0%) | 0 (0.0%) |
| Information | 21 (100.0%) | 0 (0.0%) |
| Finance & Insurance | 0 (0.0%) | 0 (0.0%) |
| Real Estate, Rental & Leasing | 0 (0.0%) | 16 (100.0%) |
| Professional & Scientific | 0 (0.0%) | 37 (100.0%) |
| Enterprise Management | 0 (0.0%) | 0 (0.0%) |
| Administrative & Support | 43 (100.0%) | 0 (0.0%) |
| Educational Services | 0 (0.0%) | 39 (100.0%) |
| Health Care & Social Assistance | 24 (7.0%) | 317 (93.0%) |
| Arts, Entertainment & Recreation | 7 (17.9%) | 32 (82.1%) |
| Accommodation & Food Services | 34 (38.6%) | 54 (61.4%) |
| Public Administration | 17 (100.0%) | 0 (0.0%) |
| Total | 533 (42.2%) | 729 (57.8%) |
Education in Mount Gilead
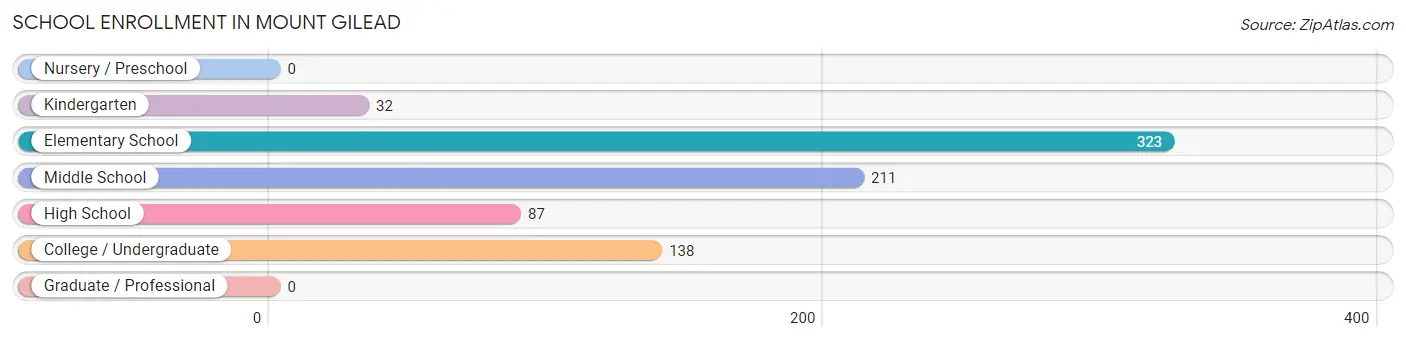
School Enrollment in Mount Gilead
The most common levels of schooling among the 791 students in Mount Gilead are elementary school (323 | 40.8%), middle school (211 | 26.7%), and college / undergraduate (138 | 17.4%).
| School Level | # Students | % Students |
| Nursery / Preschool | 0 | 0.0% |
| Kindergarten | 32 | 4.1% |
| Elementary School | 323 | 40.8% |
| Middle School | 211 | 26.7% |
| High School | 87 | 11.0% |
| College / Undergraduate | 138 | 17.4% |
| Graduate / Professional | 0 | 0.0% |
| Total | 791 | 100.0% |
School Enrollment by Age by Funding Source in Mount Gilead
Out of a total of 791 students who are enrolled in schools in Mount Gilead, 118 (14.9%) attend a private institution, while the remaining 673 (85.1%) are enrolled in public schools. The age group of 35 years and over has the highest likelihood of being enrolled in private schools, with 23 (65.7% in the age bracket) enrolled. Conversely, the age group of 15 to 17 year olds has the lowest likelihood of being enrolled in a private school, with 78 (100.0% in the age bracket) attending a public institution.
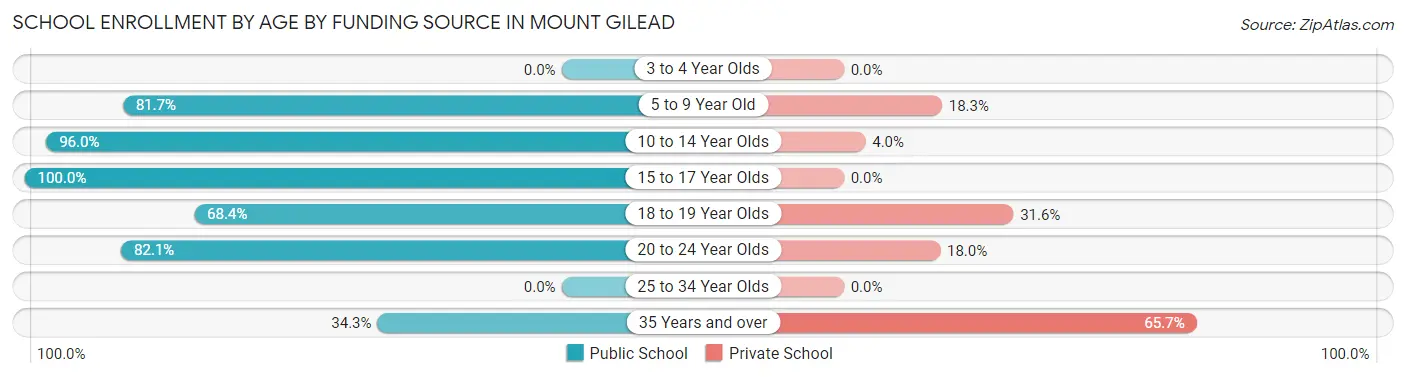
| Age Bracket | Public School | Private School |
| 3 to 4 Year Olds | 0 (0.0%) | 0 (0.0%) |
| 5 to 9 Year Old | 237 (81.7%) | 53 (18.3%) |
| 10 to 14 Year Olds | 262 (96.0%) | 11 (4.0%) |
| 15 to 17 Year Olds | 78 (100.0%) | 0 (0.0%) |
| 18 to 19 Year Olds | 52 (68.4%) | 24 (31.6%) |
| 20 to 24 Year Olds | 32 (82.1%) | 7 (17.9%) |
| 25 to 34 Year Olds | 0 (0.0%) | 0 (0.0%) |
| 35 Years and over | 12 (34.3%) | 23 (65.7%) |
| Total | 673 (85.1%) | 118 (14.9%) |
Educational Attainment by Field of Study in Mount Gilead
Education (139 | 68.5%), liberal arts & history (24 | 11.8%), literature & languages (20 | 9.9%), psychology (13 | 6.4%), and arts & humanities (7 | 3.5%) are the most common fields of study among 203 individuals in Mount Gilead who have obtained a bachelor's degree or higher.
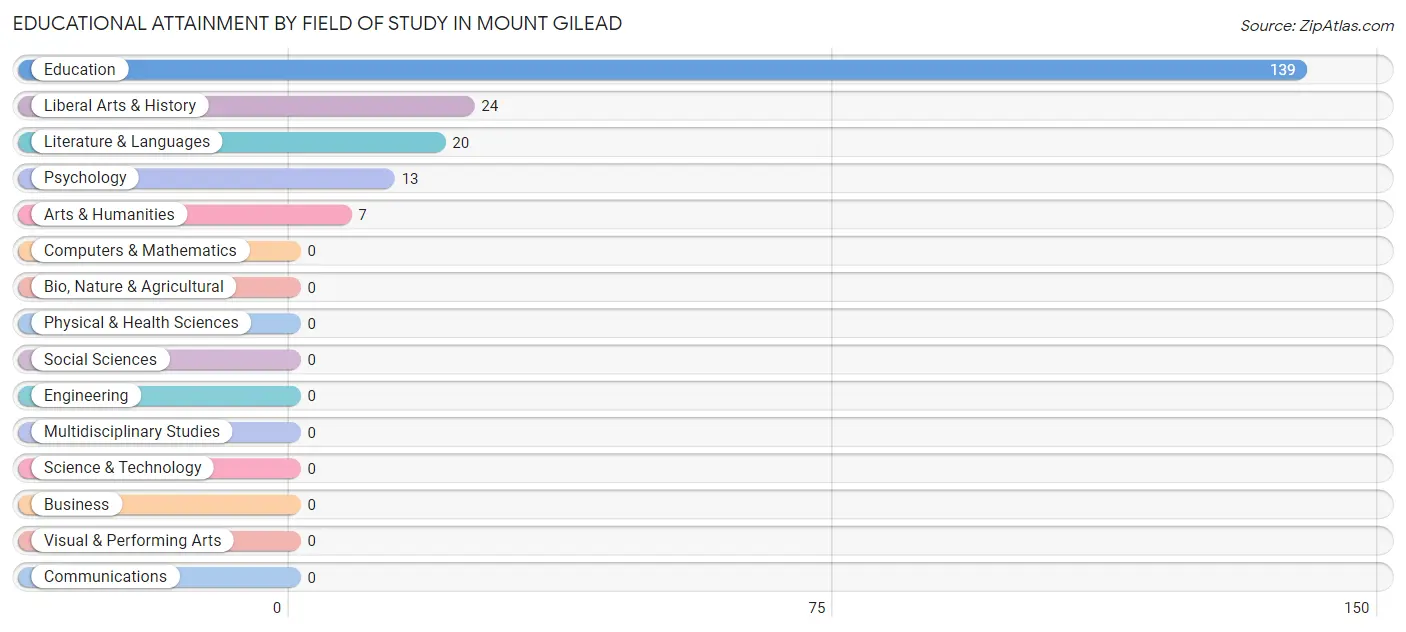
| Field of Study | # Graduates | % Graduates |
| Computers & Mathematics | 0 | 0.0% |
| Bio, Nature & Agricultural | 0 | 0.0% |
| Physical & Health Sciences | 0 | 0.0% |
| Psychology | 13 | 6.4% |
| Social Sciences | 0 | 0.0% |
| Engineering | 0 | 0.0% |
| Multidisciplinary Studies | 0 | 0.0% |
| Science & Technology | 0 | 0.0% |
| Business | 0 | 0.0% |
| Education | 139 | 68.5% |
| Literature & Languages | 20 | 9.9% |
| Liberal Arts & History | 24 | 11.8% |
| Visual & Performing Arts | 0 | 0.0% |
| Communications | 0 | 0.0% |
| Arts & Humanities | 7 | 3.5% |
| Total | 203 | 100.0% |
Transportation & Commute in Mount Gilead
Vehicle Availability by Sex in Mount Gilead
The most prevalent vehicle ownership categories in Mount Gilead are males with 2 vehicles (209, accounting for 39.2%) and females with 2 vehicles (215, making up 28.7%).
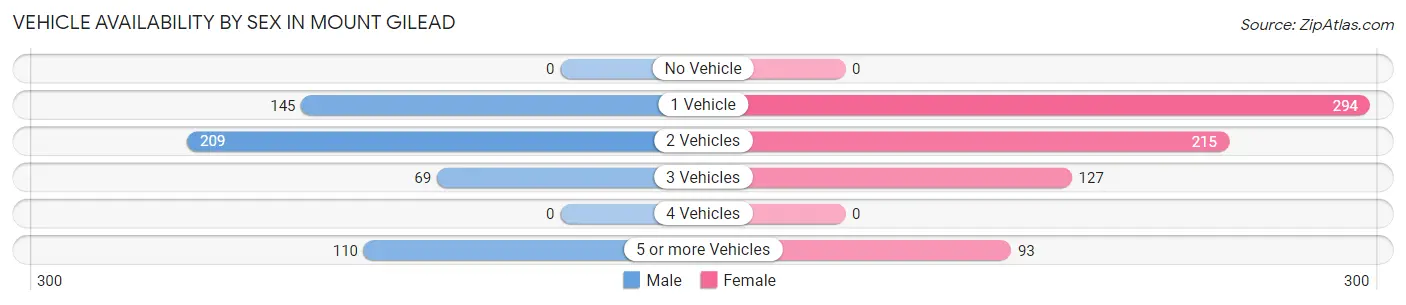
| Vehicles Available | Male | Female |
| No Vehicle | 0 (0.0%) | 0 (0.0%) |
| 1 Vehicle | 145 (27.2%) | 294 (40.3%) |
| 2 Vehicles | 209 (39.2%) | 215 (29.5%) |
| 3 Vehicles | 69 (13.0%) | 127 (17.4%) |
| 4 Vehicles | 0 (0.0%) | 0 (0.0%) |
| 5 or more Vehicles | 110 (20.6%) | 93 (12.8%) |
| Total | 533 (100.0%) | 729 (100.0%) |
Commute Time in Mount Gilead
The most frequently occuring commute durations in Mount Gilead are 10 to 14 minutes (204 commuters, 16.2%), 20 to 24 minutes (146 commuters, 11.6%), and 60 to 89 minutes (130 commuters, 10.3%).
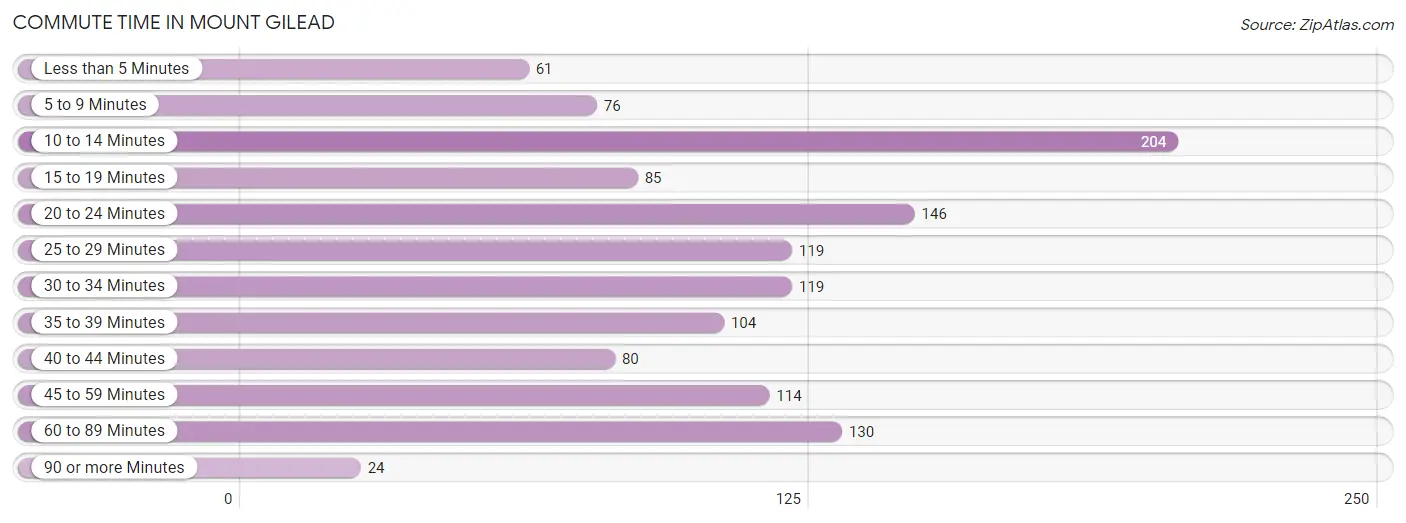
| Commute Time | # Commuters | % Commuters |
| Less than 5 Minutes | 61 | 4.8% |
| 5 to 9 Minutes | 76 | 6.0% |
| 10 to 14 Minutes | 204 | 16.2% |
| 15 to 19 Minutes | 85 | 6.7% |
| 20 to 24 Minutes | 146 | 11.6% |
| 25 to 29 Minutes | 119 | 9.4% |
| 30 to 34 Minutes | 119 | 9.4% |
| 35 to 39 Minutes | 104 | 8.2% |
| 40 to 44 Minutes | 80 | 6.3% |
| 45 to 59 Minutes | 114 | 9.0% |
| 60 to 89 Minutes | 130 | 10.3% |
| 90 or more Minutes | 24 | 1.9% |
Commute Time by Sex in Mount Gilead
The most common commute times in Mount Gilead are 60 to 89 minutes (130 commuters, 24.4%) for males and 10 to 14 minutes (204 commuters, 28.0%) for females.
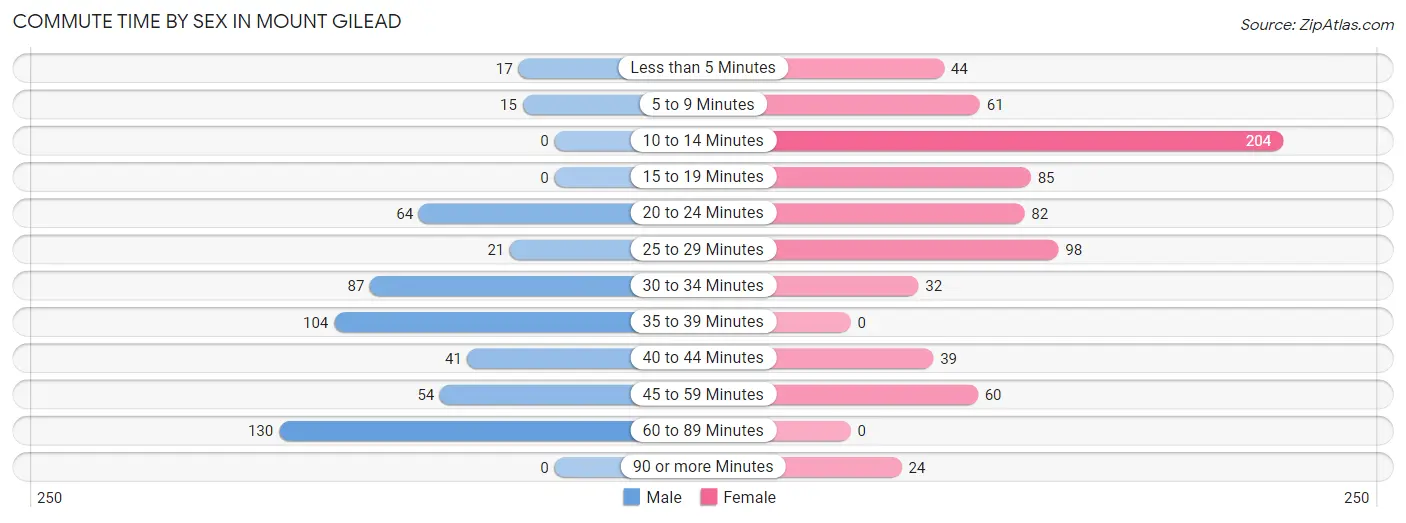
| Commute Time | Male | Female |
| Less than 5 Minutes | 17 (3.2%) | 44 (6.0%) |
| 5 to 9 Minutes | 15 (2.8%) | 61 (8.4%) |
| 10 to 14 Minutes | 0 (0.0%) | 204 (28.0%) |
| 15 to 19 Minutes | 0 (0.0%) | 85 (11.7%) |
| 20 to 24 Minutes | 64 (12.0%) | 82 (11.3%) |
| 25 to 29 Minutes | 21 (3.9%) | 98 (13.4%) |
| 30 to 34 Minutes | 87 (16.3%) | 32 (4.4%) |
| 35 to 39 Minutes | 104 (19.5%) | 0 (0.0%) |
| 40 to 44 Minutes | 41 (7.7%) | 39 (5.3%) |
| 45 to 59 Minutes | 54 (10.1%) | 60 (8.2%) |
| 60 to 89 Minutes | 130 (24.4%) | 0 (0.0%) |
| 90 or more Minutes | 0 (0.0%) | 24 (3.3%) |
Time of Departure to Work by Sex in Mount Gilead
The most frequent times of departure to work in Mount Gilead are 12:00 PM to 3:59 PM (107, 20.1%) for males and 7:30 AM to 7:59 AM (137, 18.8%) for females.
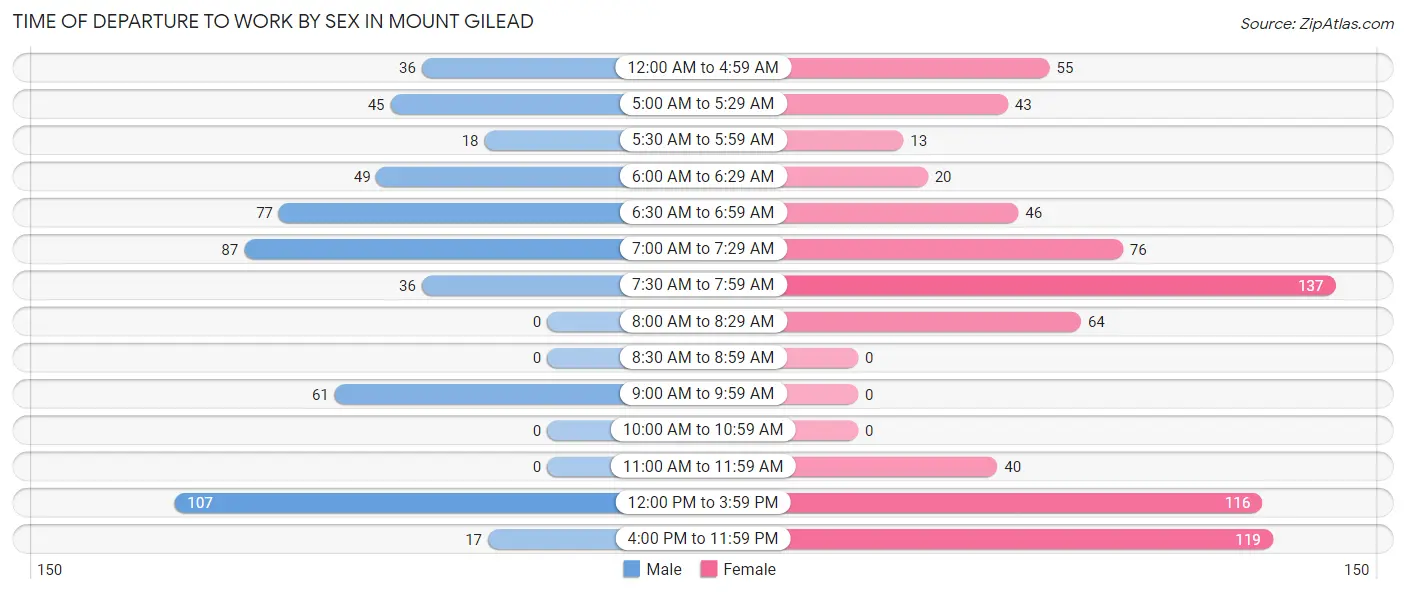
| Time of Departure | Male | Female |
| 12:00 AM to 4:59 AM | 36 (6.8%) | 55 (7.5%) |
| 5:00 AM to 5:29 AM | 45 (8.4%) | 43 (5.9%) |
| 5:30 AM to 5:59 AM | 18 (3.4%) | 13 (1.8%) |
| 6:00 AM to 6:29 AM | 49 (9.2%) | 20 (2.7%) |
| 6:30 AM to 6:59 AM | 77 (14.4%) | 46 (6.3%) |
| 7:00 AM to 7:29 AM | 87 (16.3%) | 76 (10.4%) |
| 7:30 AM to 7:59 AM | 36 (6.8%) | 137 (18.8%) |
| 8:00 AM to 8:29 AM | 0 (0.0%) | 64 (8.8%) |
| 8:30 AM to 8:59 AM | 0 (0.0%) | 0 (0.0%) |
| 9:00 AM to 9:59 AM | 61 (11.4%) | 0 (0.0%) |
| 10:00 AM to 10:59 AM | 0 (0.0%) | 0 (0.0%) |
| 11:00 AM to 11:59 AM | 0 (0.0%) | 40 (5.5%) |
| 12:00 PM to 3:59 PM | 107 (20.1%) | 116 (15.9%) |
| 4:00 PM to 11:59 PM | 17 (3.2%) | 119 (16.3%) |
| Total | 533 (100.0%) | 729 (100.0%) |
Housing Occupancy in Mount Gilead
Occupancy by Ownership in Mount Gilead
Of the total 1,166 dwellings in Mount Gilead, owner-occupied units account for 655 (56.2%), while renter-occupied units make up 511 (43.8%).
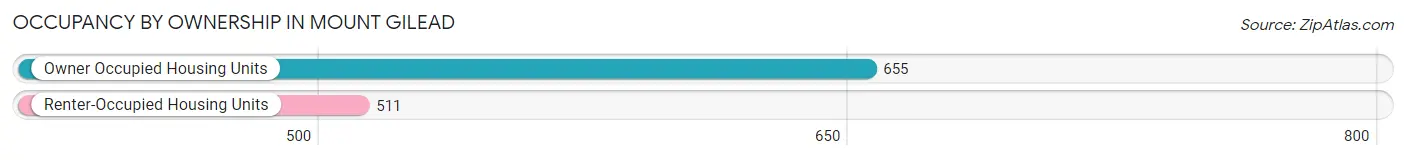
| Occupancy | # Housing Units | % Housing Units |
| Owner Occupied Housing Units | 655 | 56.2% |
| Renter-Occupied Housing Units | 511 | 43.8% |
| Total Occupied Housing Units | 1,166 | 100.0% |
Occupancy by Household Size in Mount Gilead
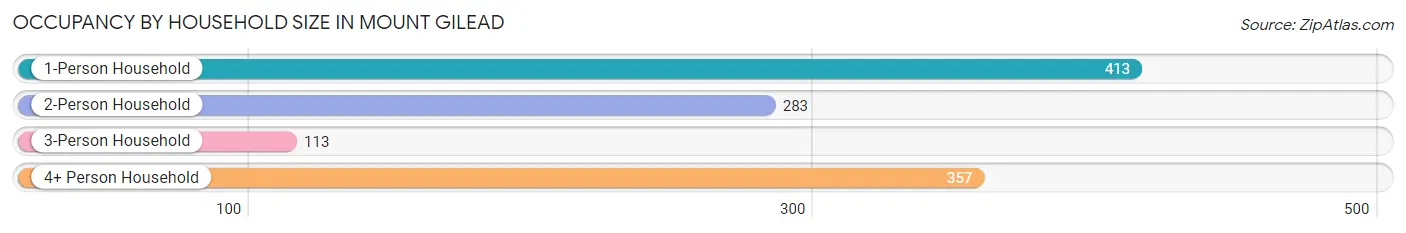
| Household Size | # Housing Units | % Housing Units |
| 1-Person Household | 413 | 35.4% |
| 2-Person Household | 283 | 24.3% |
| 3-Person Household | 113 | 9.7% |
| 4+ Person Household | 357 | 30.6% |
| Total Housing Units | 1,166 | 100.0% |
Occupancy by Ownership by Household Size in Mount Gilead
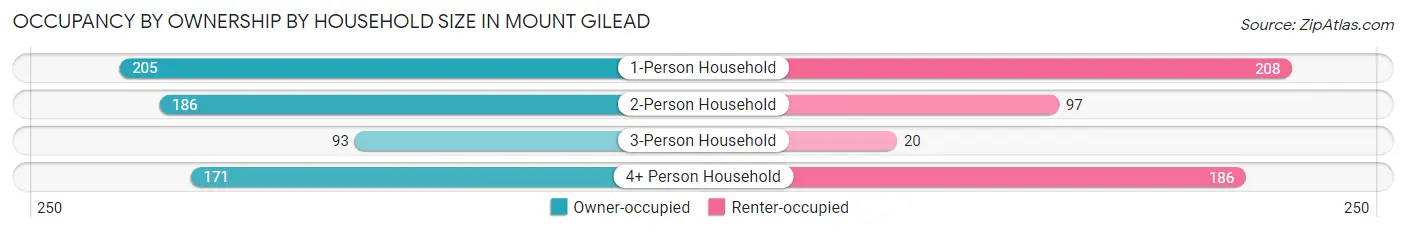
| Household Size | Owner-occupied | Renter-occupied |
| 1-Person Household | 205 (49.6%) | 208 (50.4%) |
| 2-Person Household | 186 (65.7%) | 97 (34.3%) |
| 3-Person Household | 93 (82.3%) | 20 (17.7%) |
| 4+ Person Household | 171 (47.9%) | 186 (52.1%) |
| Total Housing Units | 655 (56.2%) | 511 (43.8%) |
Occupancy by Educational Attainment in Mount Gilead
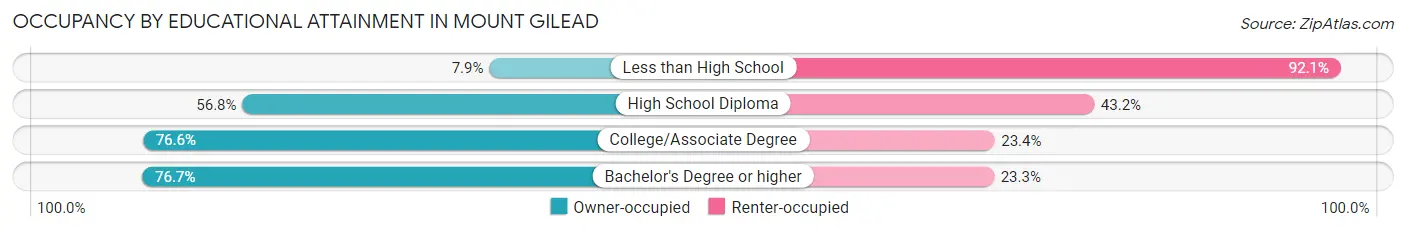
| Household Size | Owner-occupied | Renter-occupied |
| Less than High School | 17 (7.9%) | 199 (92.1%) |
| High School Diploma | 258 (56.8%) | 196 (43.2%) |
| College/Associate Degree | 278 (76.6%) | 85 (23.4%) |
| Bachelor's Degree or higher | 102 (76.7%) | 31 (23.3%) |
Occupancy by Age of Householder in Mount Gilead
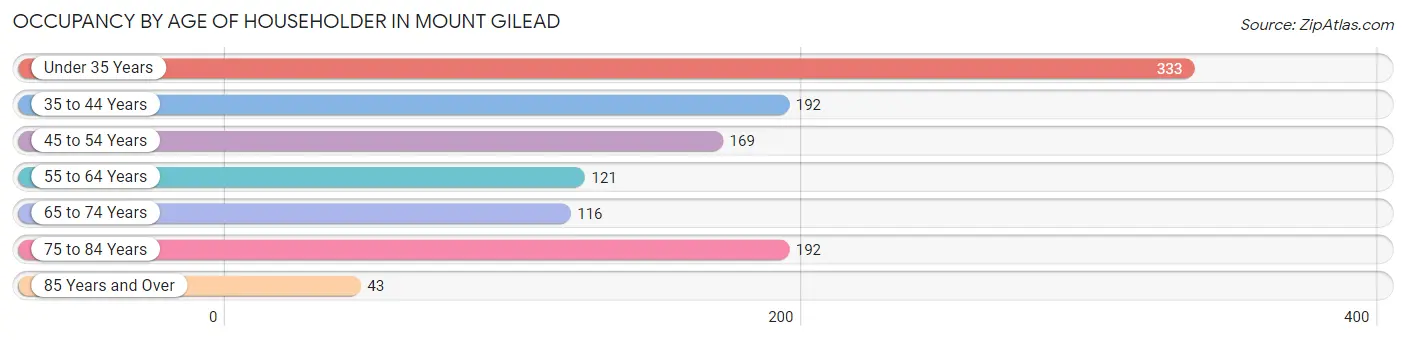
| Age Bracket | # Households | % Households |
| Under 35 Years | 333 | 28.6% |
| 35 to 44 Years | 192 | 16.5% |
| 45 to 54 Years | 169 | 14.5% |
| 55 to 64 Years | 121 | 10.4% |
| 65 to 74 Years | 116 | 10.0% |
| 75 to 84 Years | 192 | 16.5% |
| 85 Years and Over | 43 | 3.7% |
| Total | 1,166 | 100.0% |
Housing Finances in Mount Gilead
Median Income by Occupancy in Mount Gilead
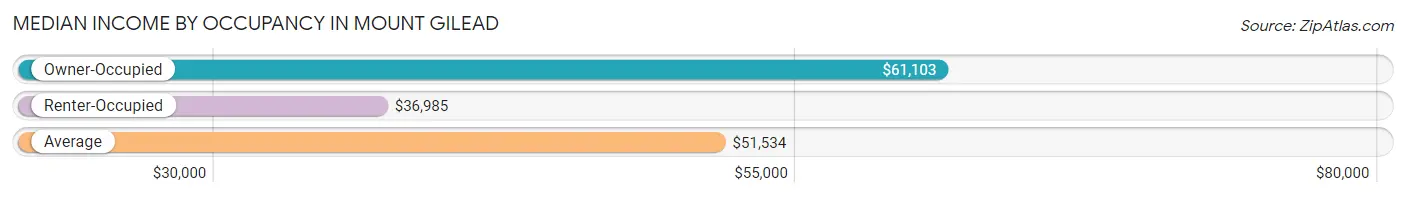
| Occupancy Type | # Households | Median Income |
| Owner-Occupied | 655 (56.2%) | $61,103 |
| Renter-Occupied | 511 (43.8%) | $36,985 |
| Average | 1,166 (100.0%) | $51,534 |
Occupancy by Householder Income Bracket in Mount Gilead
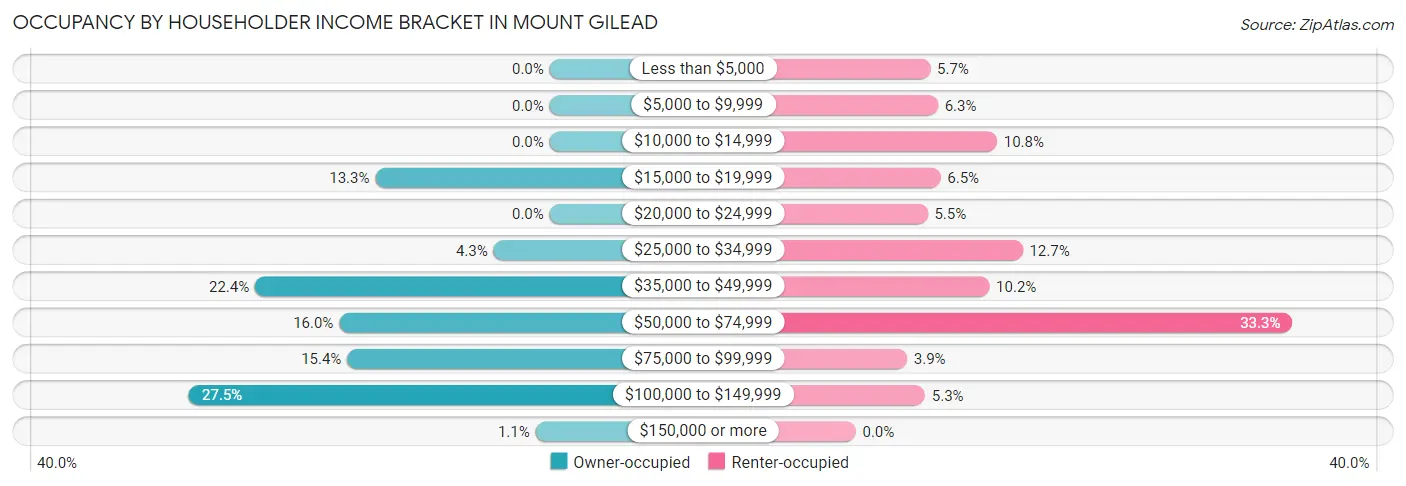
| Income Bracket | Owner-occupied | Renter-occupied |
| Less than $5,000 | 0 (0.0%) | 29 (5.7%) |
| $5,000 to $9,999 | 0 (0.0%) | 32 (6.3%) |
| $10,000 to $14,999 | 0 (0.0%) | 55 (10.8%) |
| $15,000 to $19,999 | 87 (13.3%) | 33 (6.5%) |
| $20,000 to $24,999 | 0 (0.0%) | 28 (5.5%) |
| $25,000 to $34,999 | 28 (4.3%) | 65 (12.7%) |
| $35,000 to $49,999 | 147 (22.4%) | 52 (10.2%) |
| $50,000 to $74,999 | 105 (16.0%) | 170 (33.3%) |
| $75,000 to $99,999 | 101 (15.4%) | 20 (3.9%) |
| $100,000 to $149,999 | 180 (27.5%) | 27 (5.3%) |
| $150,000 or more | 7 (1.1%) | 0 (0.0%) |
| Total | 655 (100.0%) | 511 (100.0%) |
Monthly Housing Cost Tiers in Mount Gilead
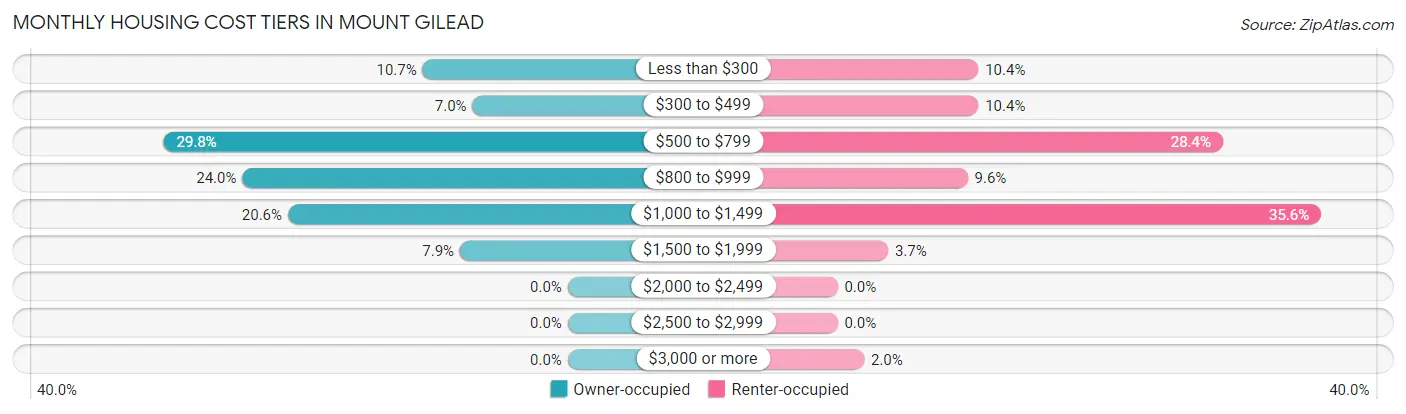
| Monthly Cost | Owner-occupied | Renter-occupied |
| Less than $300 | 70 (10.7%) | 53 (10.4%) |
| $300 to $499 | 46 (7.0%) | 53 (10.4%) |
| $500 to $799 | 195 (29.8%) | 145 (28.4%) |
| $800 to $999 | 157 (24.0%) | 49 (9.6%) |
| $1,000 to $1,499 | 135 (20.6%) | 182 (35.6%) |
| $1,500 to $1,999 | 52 (7.9%) | 19 (3.7%) |
| $2,000 to $2,499 | 0 (0.0%) | 0 (0.0%) |
| $2,500 to $2,999 | 0 (0.0%) | 0 (0.0%) |
| $3,000 or more | 0 (0.0%) | 10 (2.0%) |
| Total | 655 (100.0%) | 511 (100.0%) |
Physical Housing Characteristics in Mount Gilead
Housing Structures in Mount Gilead
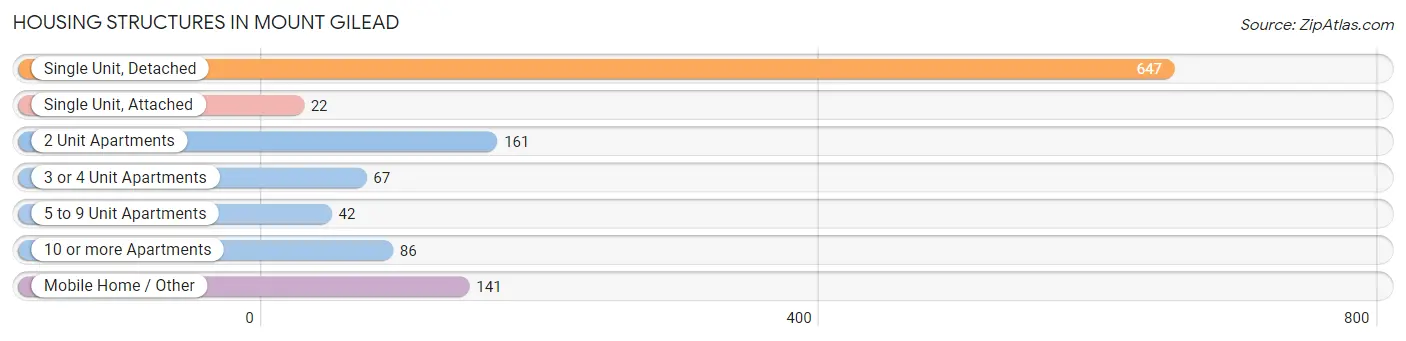
| Structure Type | # Housing Units | % Housing Units |
| Single Unit, Detached | 647 | 55.5% |
| Single Unit, Attached | 22 | 1.9% |
| 2 Unit Apartments | 161 | 13.8% |
| 3 or 4 Unit Apartments | 67 | 5.8% |
| 5 to 9 Unit Apartments | 42 | 3.6% |
| 10 or more Apartments | 86 | 7.4% |
| Mobile Home / Other | 141 | 12.1% |
| Total | 1,166 | 100.0% |
Housing Structures by Occupancy in Mount Gilead
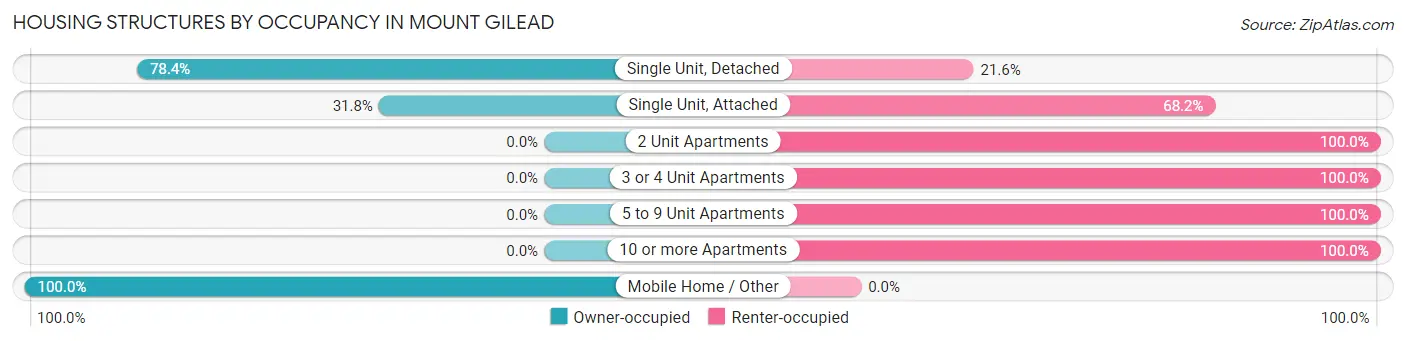
| Structure Type | Owner-occupied | Renter-occupied |
| Single Unit, Detached | 507 (78.4%) | 140 (21.6%) |
| Single Unit, Attached | 7 (31.8%) | 15 (68.2%) |
| 2 Unit Apartments | 0 (0.0%) | 161 (100.0%) |
| 3 or 4 Unit Apartments | 0 (0.0%) | 67 (100.0%) |
| 5 to 9 Unit Apartments | 0 (0.0%) | 42 (100.0%) |
| 10 or more Apartments | 0 (0.0%) | 86 (100.0%) |
| Mobile Home / Other | 141 (100.0%) | 0 (0.0%) |
| Total | 655 (56.2%) | 511 (43.8%) |
Housing Structures by Number of Rooms in Mount Gilead
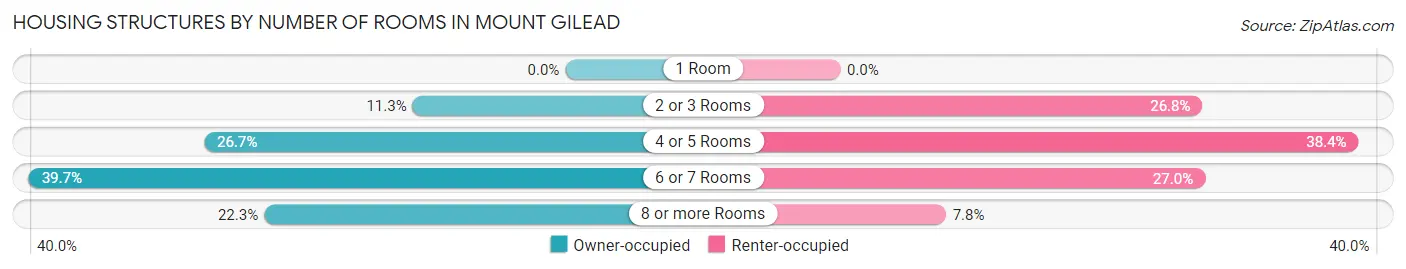
| Number of Rooms | Owner-occupied | Renter-occupied |
| 1 Room | 0 (0.0%) | 0 (0.0%) |
| 2 or 3 Rooms | 74 (11.3%) | 137 (26.8%) |
| 4 or 5 Rooms | 175 (26.7%) | 196 (38.4%) |
| 6 or 7 Rooms | 260 (39.7%) | 138 (27.0%) |
| 8 or more Rooms | 146 (22.3%) | 40 (7.8%) |
| Total | 655 (100.0%) | 511 (100.0%) |
Housing Structure by Heating Type in Mount Gilead
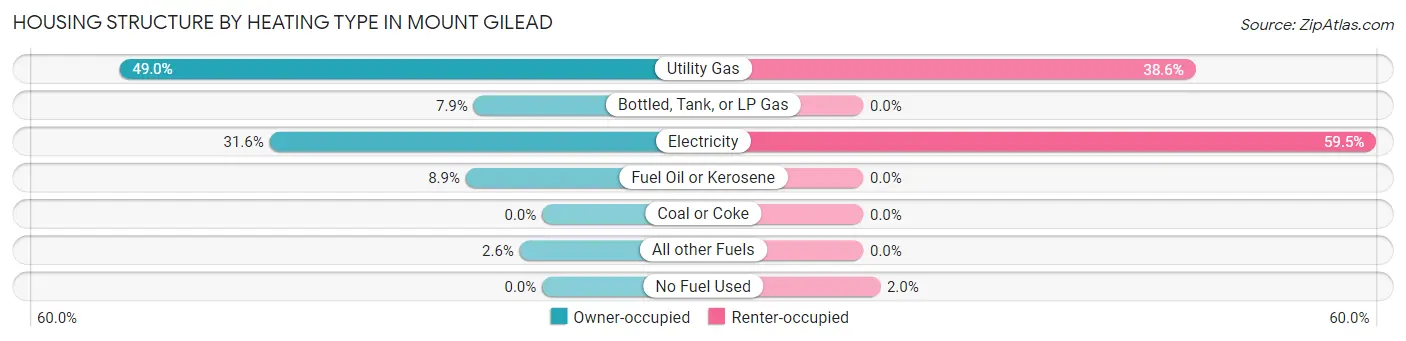
| Heating Type | Owner-occupied | Renter-occupied |
| Utility Gas | 321 (49.0%) | 197 (38.6%) |
| Bottled, Tank, or LP Gas | 52 (7.9%) | 0 (0.0%) |
| Electricity | 207 (31.6%) | 304 (59.5%) |
| Fuel Oil or Kerosene | 58 (8.8%) | 0 (0.0%) |
| Coal or Coke | 0 (0.0%) | 0 (0.0%) |
| All other Fuels | 17 (2.6%) | 0 (0.0%) |
| No Fuel Used | 0 (0.0%) | 10 (2.0%) |
| Total | 655 (100.0%) | 511 (100.0%) |
Household Vehicle Usage in Mount Gilead
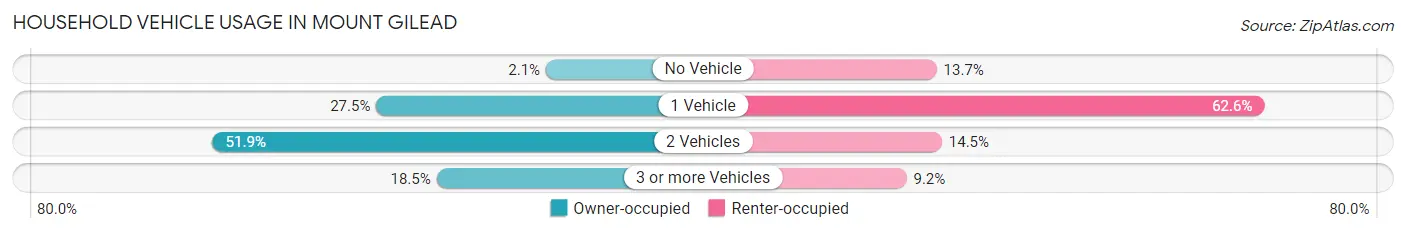
| Vehicles per Household | Owner-occupied | Renter-occupied |
| No Vehicle | 14 (2.1%) | 70 (13.7%) |
| 1 Vehicle | 180 (27.5%) | 320 (62.6%) |
| 2 Vehicles | 340 (51.9%) | 74 (14.5%) |
| 3 or more Vehicles | 121 (18.5%) | 47 (9.2%) |
| Total | 655 (100.0%) | 511 (100.0%) |
Real Estate & Mortgages in Mount Gilead
Real Estate and Mortgage Overview in Mount Gilead
| Characteristic | Without Mortgage | With Mortgage |
| Housing Units | 262 | 393 |
| Median Property Value | - | - |
| Median Household Income | $46,397 | $7 |
| Monthly Housing Costs | $519 | $0 |
| Real Estate Taxes | $1,239 | $0 |
Property Value by Mortgage Status in Mount Gilead
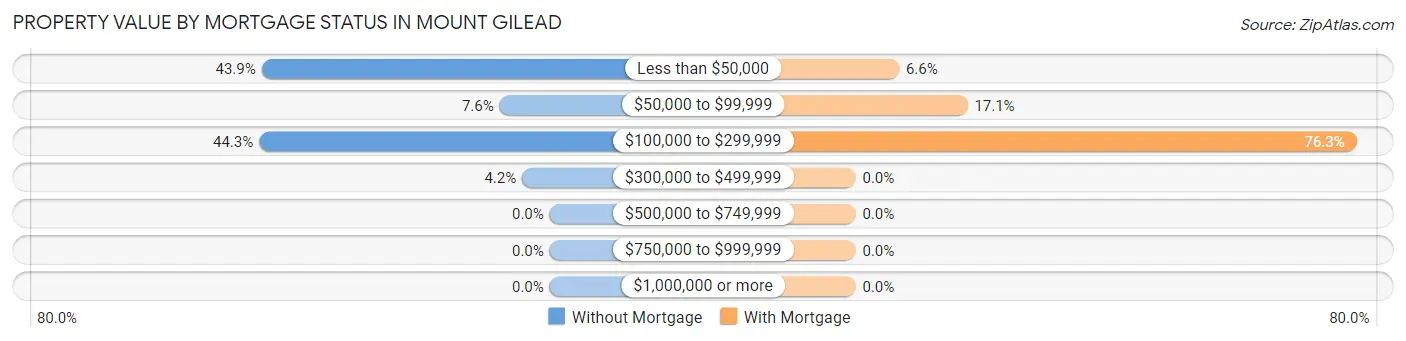
| Property Value | Without Mortgage | With Mortgage |
| Less than $50,000 | 115 (43.9%) | 26 (6.6%) |
| $50,000 to $99,999 | 20 (7.6%) | 67 (17.1%) |
| $100,000 to $299,999 | 116 (44.3%) | 300 (76.3%) |
| $300,000 to $499,999 | 11 (4.2%) | 0 (0.0%) |
| $500,000 to $749,999 | 0 (0.0%) | 0 (0.0%) |
| $750,000 to $999,999 | 0 (0.0%) | 0 (0.0%) |
| $1,000,000 or more | 0 (0.0%) | 0 (0.0%) |
| Total | 262 (100.0%) | 393 (100.0%) |
Household Income by Mortgage Status in Mount Gilead
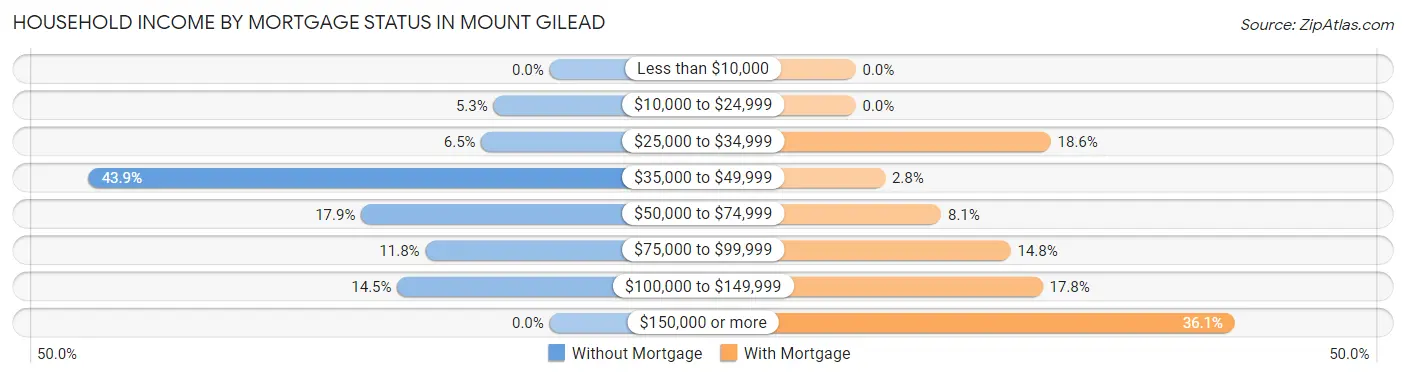
| Household Income | Without Mortgage | With Mortgage |
| Less than $10,000 | 0 (0.0%) | 0 (0.0%) |
| $10,000 to $24,999 | 14 (5.3%) | 0 (0.0%) |
| $25,000 to $34,999 | 17 (6.5%) | 73 (18.6%) |
| $35,000 to $49,999 | 115 (43.9%) | 11 (2.8%) |
| $50,000 to $74,999 | 47 (17.9%) | 32 (8.1%) |
| $75,000 to $99,999 | 31 (11.8%) | 58 (14.8%) |
| $100,000 to $149,999 | 38 (14.5%) | 70 (17.8%) |
| $150,000 or more | 0 (0.0%) | 142 (36.1%) |
| Total | 262 (100.0%) | 393 (100.0%) |
Property Value to Household Income Ratio in Mount Gilead
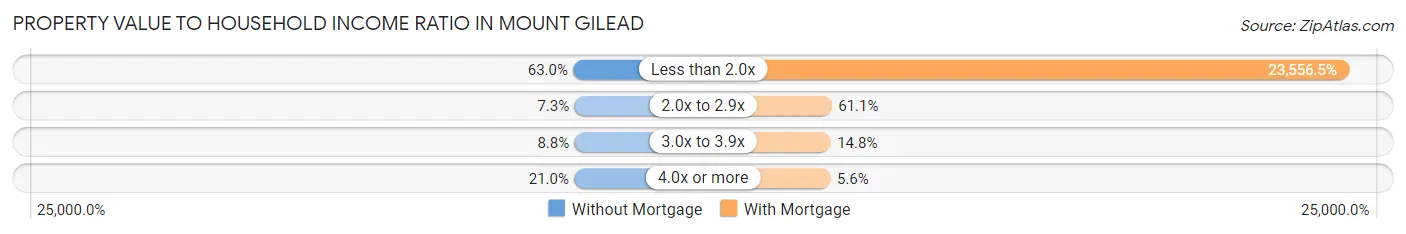
| Value-to-Income Ratio | Without Mortgage | With Mortgage |
| Less than 2.0x | 165 (63.0%) | 92,577 (23,556.5%) |
| 2.0x to 2.9x | 19 (7.2%) | 240 (61.1%) |
| 3.0x to 3.9x | 23 (8.8%) | 58 (14.8%) |
| 4.0x or more | 55 (21.0%) | 22 (5.6%) |
| Total | 262 (100.0%) | 393 (100.0%) |
Real Estate Taxes by Mortgage Status in Mount Gilead
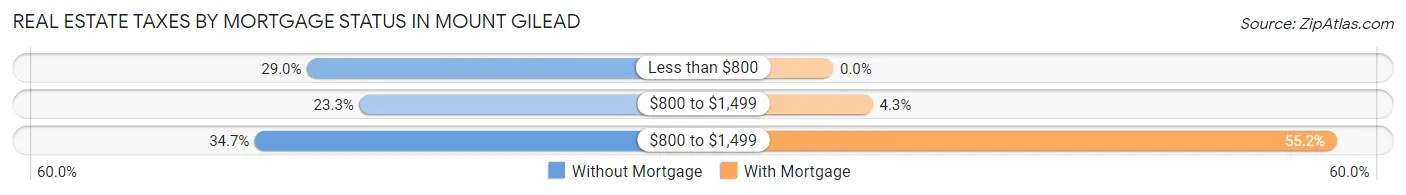
| Property Taxes | Without Mortgage | With Mortgage |
| Less than $800 | 76 (29.0%) | 0 (0.0%) |
| $800 to $1,499 | 61 (23.3%) | 17 (4.3%) |
| $800 to $1,499 | 91 (34.7%) | 217 (55.2%) |
| Total | 262 (100.0%) | 393 (100.0%) |
Health & Disability in Mount Gilead
Health Insurance Coverage by Age in Mount Gilead
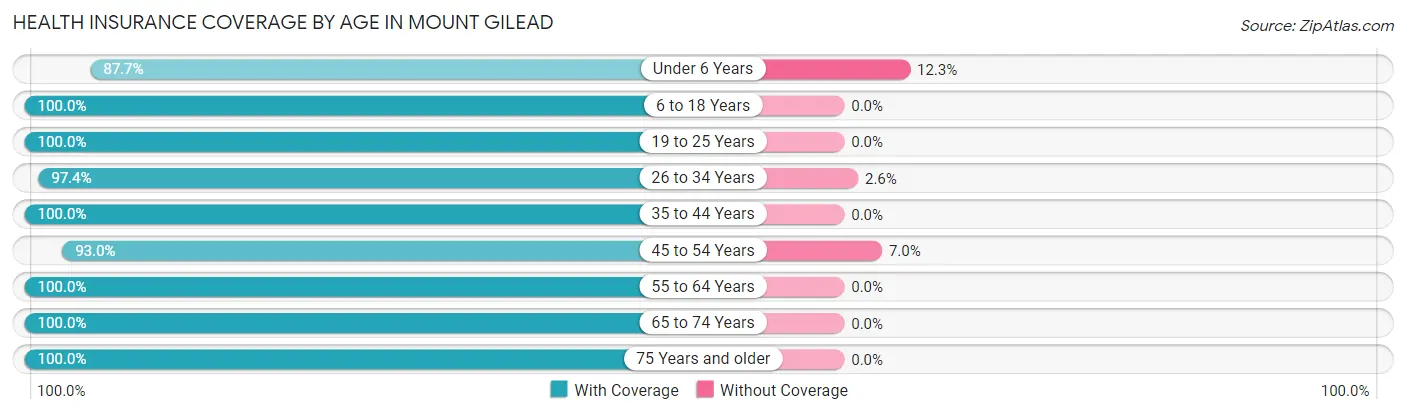
| Age Bracket | With Coverage | Without Coverage |
| Under 6 Years | 186 (87.7%) | 26 (12.3%) |
| 6 to 18 Years | 659 (100.0%) | 0 (0.0%) |
| 19 to 25 Years | 254 (100.0%) | 0 (0.0%) |
| 26 to 34 Years | 381 (97.4%) | 10 (2.6%) |
| 35 to 44 Years | 372 (100.0%) | 0 (0.0%) |
| 45 to 54 Years | 225 (93.0%) | 17 (7.0%) |
| 55 to 64 Years | 176 (100.0%) | 0 (0.0%) |
| 65 to 74 Years | 198 (100.0%) | 0 (0.0%) |
| 75 Years and older | 292 (100.0%) | 0 (0.0%) |
| Total | 2,743 (98.1%) | 53 (1.9%) |
Health Insurance Coverage by Citizenship Status in Mount Gilead
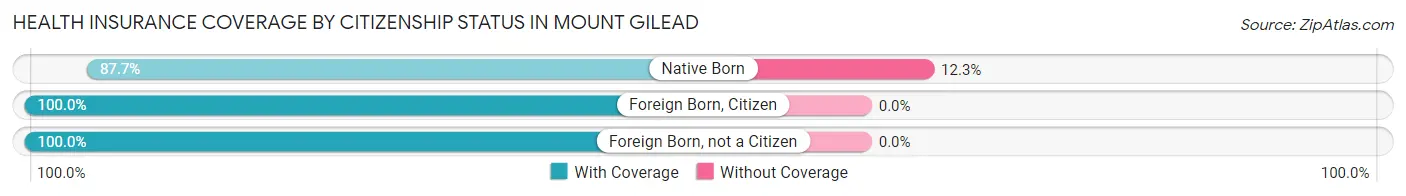
| Citizenship Status | With Coverage | Without Coverage |
| Native Born | 186 (87.7%) | 26 (12.3%) |
| Foreign Born, Citizen | 659 (100.0%) | 0 (0.0%) |
| Foreign Born, not a Citizen | 254 (100.0%) | 0 (0.0%) |
Health Insurance Coverage by Household Income in Mount Gilead
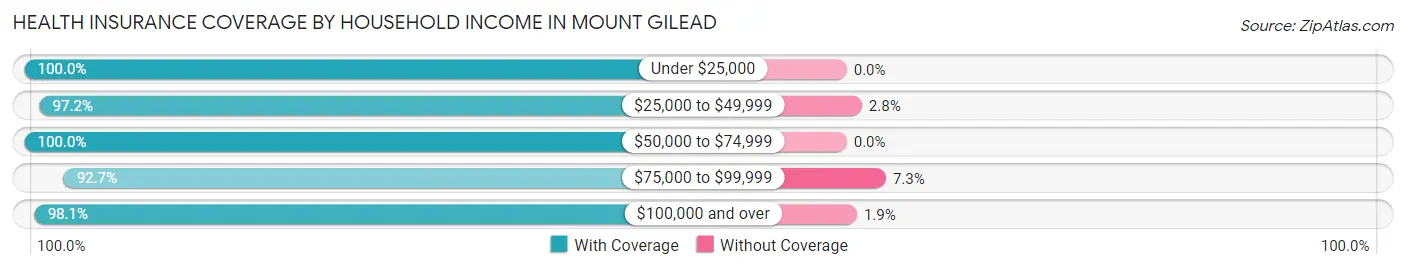
| Household Income | With Coverage | Without Coverage |
| Under $25,000 | 352 (100.0%) | 0 (0.0%) |
| $25,000 to $49,999 | 583 (97.2%) | 17 (2.8%) |
| $50,000 to $74,999 | 769 (100.0%) | 0 (0.0%) |
| $75,000 to $99,999 | 265 (92.7%) | 21 (7.3%) |
| $100,000 and over | 774 (98.1%) | 15 (1.9%) |
Public vs Private Health Insurance Coverage by Age in Mount Gilead
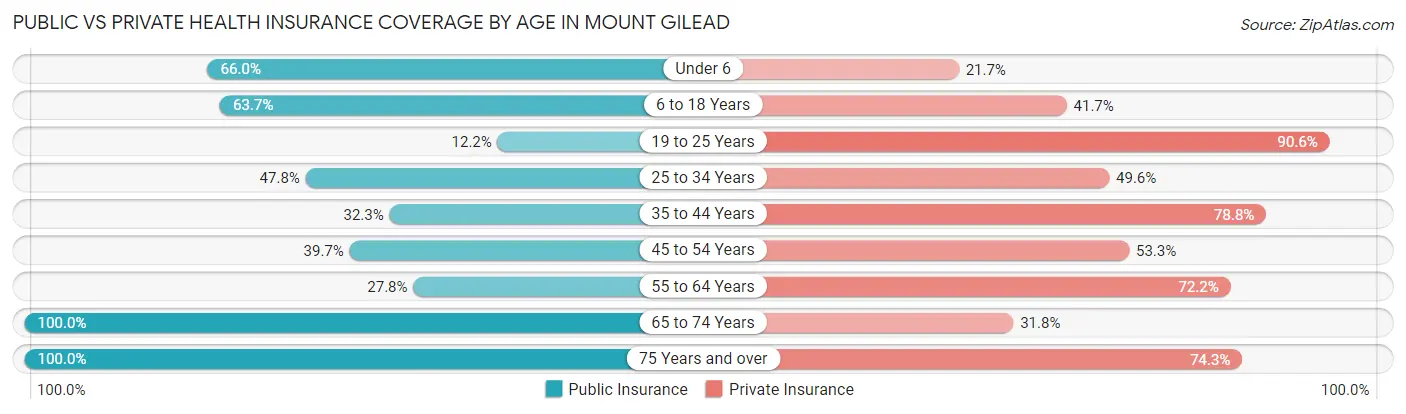
| Age Bracket | Public Insurance | Private Insurance |
| Under 6 | 140 (66.0%) | 46 (21.7%) |
| 6 to 18 Years | 420 (63.7%) | 275 (41.7%) |
| 19 to 25 Years | 31 (12.2%) | 230 (90.5%) |
| 25 to 34 Years | 187 (47.8%) | 194 (49.6%) |
| 35 to 44 Years | 120 (32.3%) | 293 (78.8%) |
| 45 to 54 Years | 96 (39.7%) | 129 (53.3%) |
| 55 to 64 Years | 49 (27.8%) | 127 (72.2%) |
| 65 to 74 Years | 198 (100.0%) | 63 (31.8%) |
| 75 Years and over | 292 (100.0%) | 217 (74.3%) |
| Total | 1,533 (54.8%) | 1,574 (56.3%) |
Disability Status by Sex by Age in Mount Gilead
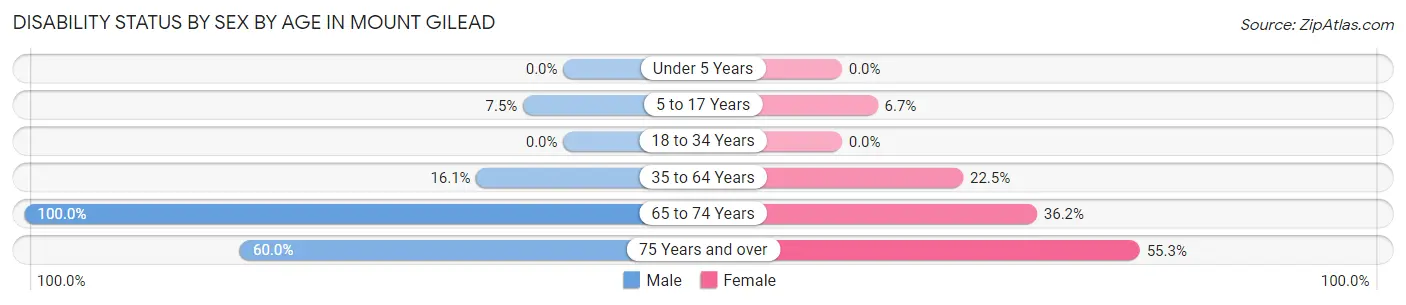
| Age Bracket | Male | Female |
| Under 5 Years | 0 (0.0%) | 0 (0.0%) |
| 5 to 17 Years | 22 (7.5%) | 23 (6.7%) |
| 18 to 34 Years | 0 (0.0%) | 0 (0.0%) |
| 35 to 64 Years | 50 (16.1%) | 108 (22.5%) |
| 65 to 74 Years | 82 (100.0%) | 42 (36.2%) |
| 75 Years and over | 45 (60.0%) | 120 (55.3%) |
Disability Class by Sex by Age in Mount Gilead
Disability Class: Hearing Difficulty
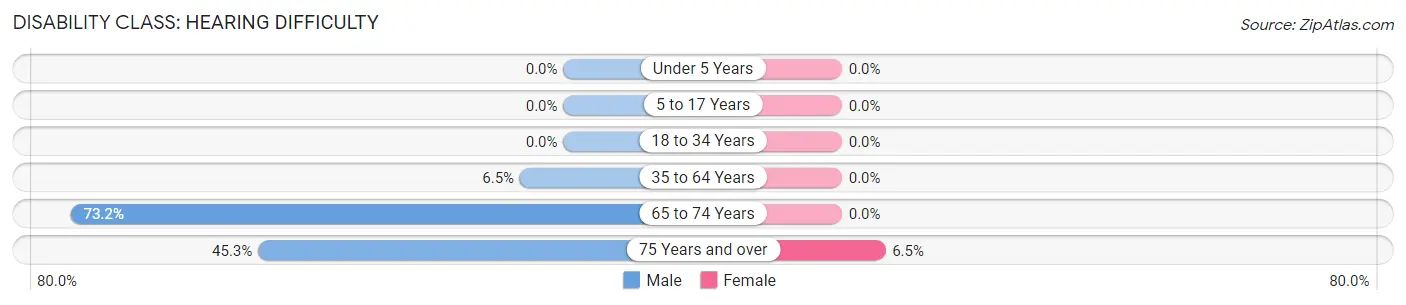
| Age Bracket | Male | Female |
| Under 5 Years | 0 (0.0%) | 0 (0.0%) |
| 5 to 17 Years | 0 (0.0%) | 0 (0.0%) |
| 18 to 34 Years | 0 (0.0%) | 0 (0.0%) |
| 35 to 64 Years | 20 (6.5%) | 0 (0.0%) |
| 65 to 74 Years | 60 (73.2%) | 0 (0.0%) |
| 75 Years and over | 34 (45.3%) | 14 (6.5%) |
Disability Class: Vision Difficulty
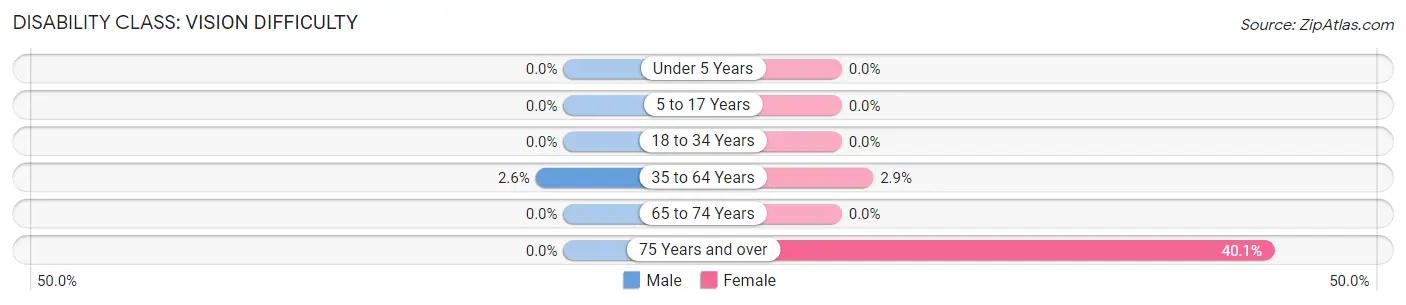
| Age Bracket | Male | Female |
| Under 5 Years | 0 (0.0%) | 0 (0.0%) |
| 5 to 17 Years | 0 (0.0%) | 0 (0.0%) |
| 18 to 34 Years | 0 (0.0%) | 0 (0.0%) |
| 35 to 64 Years | 8 (2.6%) | 14 (2.9%) |
| 65 to 74 Years | 0 (0.0%) | 0 (0.0%) |
| 75 Years and over | 0 (0.0%) | 87 (40.1%) |
Disability Class: Cognitive Difficulty
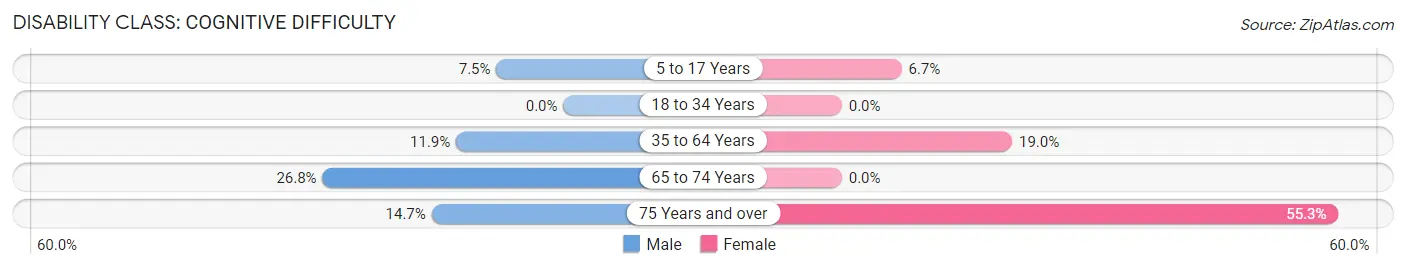
| Age Bracket | Male | Female |
| 5 to 17 Years | 22 (7.5%) | 23 (6.7%) |
| 18 to 34 Years | 0 (0.0%) | 0 (0.0%) |
| 35 to 64 Years | 37 (11.9%) | 91 (19.0%) |
| 65 to 74 Years | 22 (26.8%) | 0 (0.0%) |
| 75 Years and over | 11 (14.7%) | 120 (55.3%) |
Disability Class: Ambulatory Difficulty
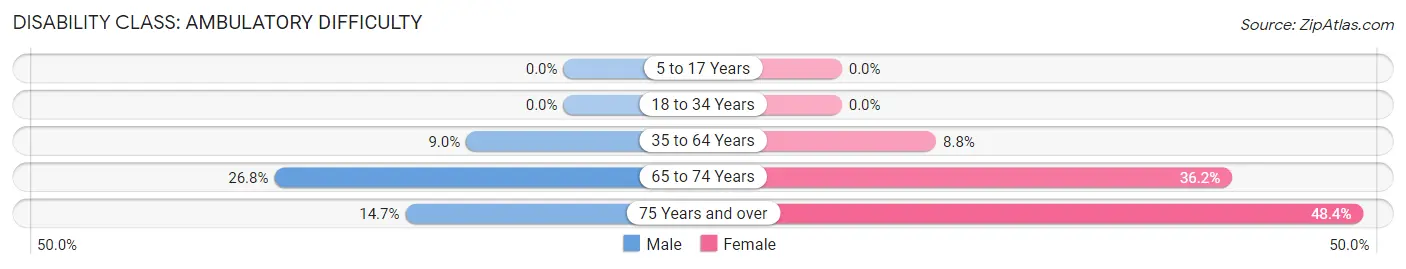
| Age Bracket | Male | Female |
| 5 to 17 Years | 0 (0.0%) | 0 (0.0%) |
| 18 to 34 Years | 0 (0.0%) | 0 (0.0%) |
| 35 to 64 Years | 28 (9.0%) | 42 (8.7%) |
| 65 to 74 Years | 22 (26.8%) | 42 (36.2%) |
| 75 Years and over | 11 (14.7%) | 105 (48.4%) |
Disability Class: Self-Care Difficulty
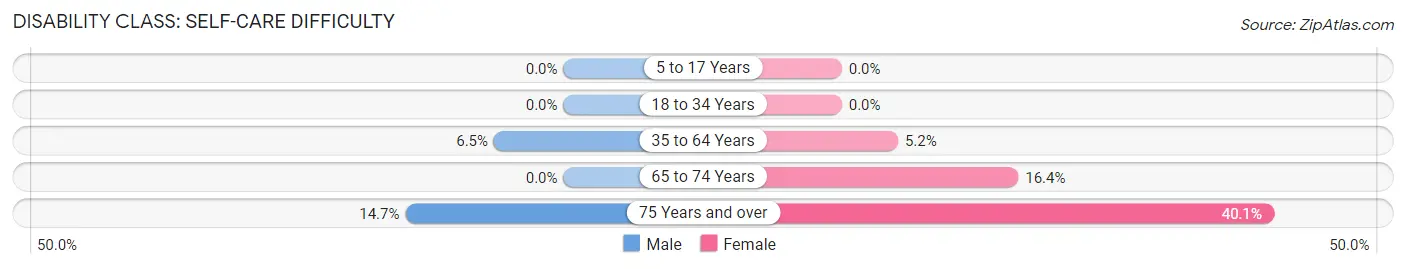
| Age Bracket | Male | Female |
| 5 to 17 Years | 0 (0.0%) | 0 (0.0%) |
| 18 to 34 Years | 0 (0.0%) | 0 (0.0%) |
| 35 to 64 Years | 20 (6.5%) | 25 (5.2%) |
| 65 to 74 Years | 0 (0.0%) | 19 (16.4%) |
| 75 Years and over | 11 (14.7%) | 87 (40.1%) |
Technology Access in Mount Gilead
Computing Device Access in Mount Gilead
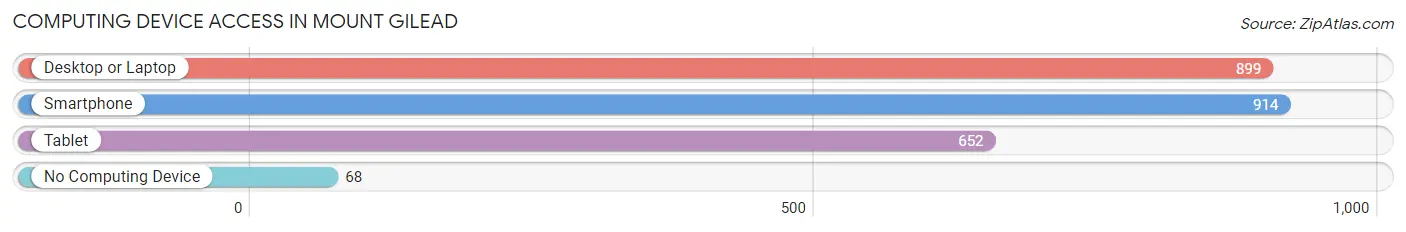
| Device Type | # Households | % Households |
| Desktop or Laptop | 899 | 77.1% |
| Smartphone | 914 | 78.4% |
| Tablet | 652 | 55.9% |
| No Computing Device | 68 | 5.8% |
| Total | 1,166 | 100.0% |
Internet Access in Mount Gilead
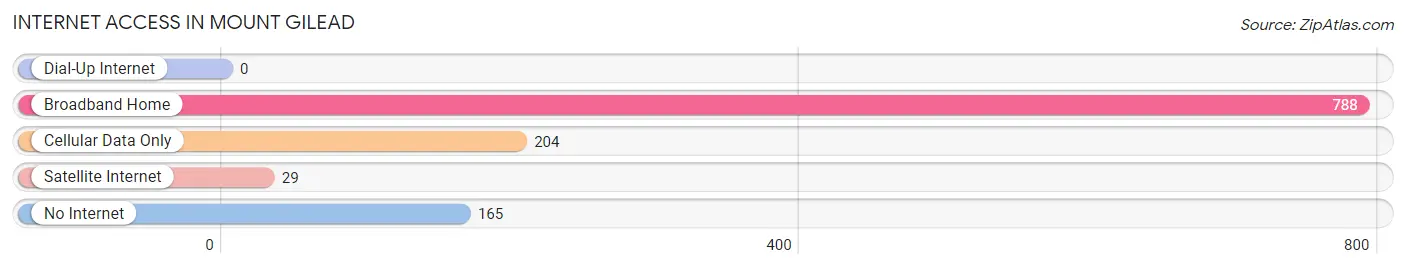
| Internet Type | # Households | % Households |
| Dial-Up Internet | 0 | 0.0% |
| Broadband Home | 788 | 67.6% |
| Cellular Data Only | 204 | 17.5% |
| Satellite Internet | 29 | 2.5% |
| No Internet | 165 | 14.1% |
| Total | 1,166 | 100.0% |
Mount Gilead Summary
Mount Gilead, Ohio is a small village located in Morrow County, Ohio. It is situated in the north-central part of the state, approximately 40 miles north of Columbus. The village has a population of approximately 2,500 people and is part of the larger Mount Gilead Micropolitan Statistical Area.
History
Mount Gilead was founded in 1817 by a group of settlers from New England. The village was named after the biblical Mount Gilead, which is mentioned in the Old Testament. The settlers were attracted to the area due to its fertile soil and abundant natural resources. The village was incorporated in 1837 and quickly became a thriving agricultural community.
In the late 19th century, the village began to experience a period of growth and development. The railroad arrived in 1881, connecting Mount Gilead to the larger cities of Columbus and Cleveland. This allowed for the transportation of goods and services, which helped to spur economic growth. The village also experienced a population boom, as many people moved to the area to take advantage of the new opportunities.
Geography
Mount Gilead is located in the north-central part of Ohio, approximately 40 miles north of Columbus. The village is situated in the heart of the Black Fork Mohican River Valley, which is surrounded by rolling hills and lush forests. The village is located at the intersection of State Route 95 and State Route 61.
The village has a total area of 1.3 square miles, all of which is land. The village is located at an elevation of 890 feet above sea level. The climate in Mount Gilead is classified as humid continental, with hot summers and cold winters.
Economy
The economy of Mount Gilead is largely based on agriculture and manufacturing. The village is home to several large farms, which produce a variety of crops, including corn, soybeans, and wheat. The village also has several manufacturing plants, which produce a variety of products, including furniture, automotive parts, and plastics.
The village also has a thriving retail sector, with several stores and restaurants located in the downtown area. The village is also home to several small businesses, including a hardware store, a grocery store, and a pharmacy.
Demographics
As of the 2010 census, the population of Mount Gilead was 2,521. The racial makeup of the village was 97.2% White, 0.7% African American, 0.2% Native American, 0.3% Asian, 0.1% Pacific Islander, 0.4% from other races, and 1.1% from two or more races. Hispanic or Latino of any race were 1.2% of the population.
The median household income in Mount Gilead was $41,250, and the median family income was $50,000. The per capita income for the village was $20,845. About 11.2% of families and 14.2% of the population were below the poverty line, including 19.2% of those under age 18 and 8.2% of those age 65 or over.
Mount Gilead is served by the Mount Gilead Exempted Village School District. The village is home to two schools, Mount Gilead Elementary School and Mount Gilead High School. The village also has several churches, including the First United Methodist Church, the First Presbyterian Church, and the Church of the Nazarene.
Mount Gilead is a small village with a rich history and a vibrant economy. The village is home to a diverse population and offers a variety of amenities and services. The village is a great place to live, work, and raise a family.
Common Questions
What is Per Capita Income in Mount Gilead?
Per Capita income in Mount Gilead is $24,290.
What is the Median Family Income in Mount Gilead?
Median Family Income in Mount Gilead is $66,233.
What is the Median Household income in Mount Gilead?
Median Household Income in Mount Gilead is $51,534.
What is Income or Wage Gap in Mount Gilead?
Income or Wage Gap in Mount Gilead is 19.4%.
Women in Mount Gilead earn 80.6 cents for every dollar earned by a man.
What is Inequality or Gini Index in Mount Gilead?
Inequality or Gini Index in Mount Gilead is 0.36.
What is the Total Population of Mount Gilead?
Total Population of Mount Gilead is 2,927.
What is the Total Male Population of Mount Gilead?
Total Male Population of Mount Gilead is 1,171.
What is the Total Female Population of Mount Gilead?
Total Female Population of Mount Gilead is 1,756.
What is the Ratio of Males per 100 Females in Mount Gilead?
There are 66.69 Males per 100 Females in Mount Gilead.
What is the Ratio of Females per 100 Males in Mount Gilead?
There are 149.96 Females per 100 Males in Mount Gilead.
What is the Median Population Age in Mount Gilead?
Median Population Age in Mount Gilead is 33.7 Years.
What is the Average Family Size in Mount Gilead
Average Family Size in Mount Gilead is 3.2 People.
What is the Average Household Size in Mount Gilead
Average Household Size in Mount Gilead is 2.4 People.
How Large is the Labor Force in Mount Gilead?
There are 1,297 People in the Labor Forcein in Mount Gilead.
What is the Percentage of People in the Labor Force in Mount Gilead?
61.4% of People are in the Labor Force in Mount Gilead.
What is the Unemployment Rate in Mount Gilead?
Unemployment Rate in Mount Gilead is 2.6%.