North Madison, OH Map & Demographics
North Madison Map
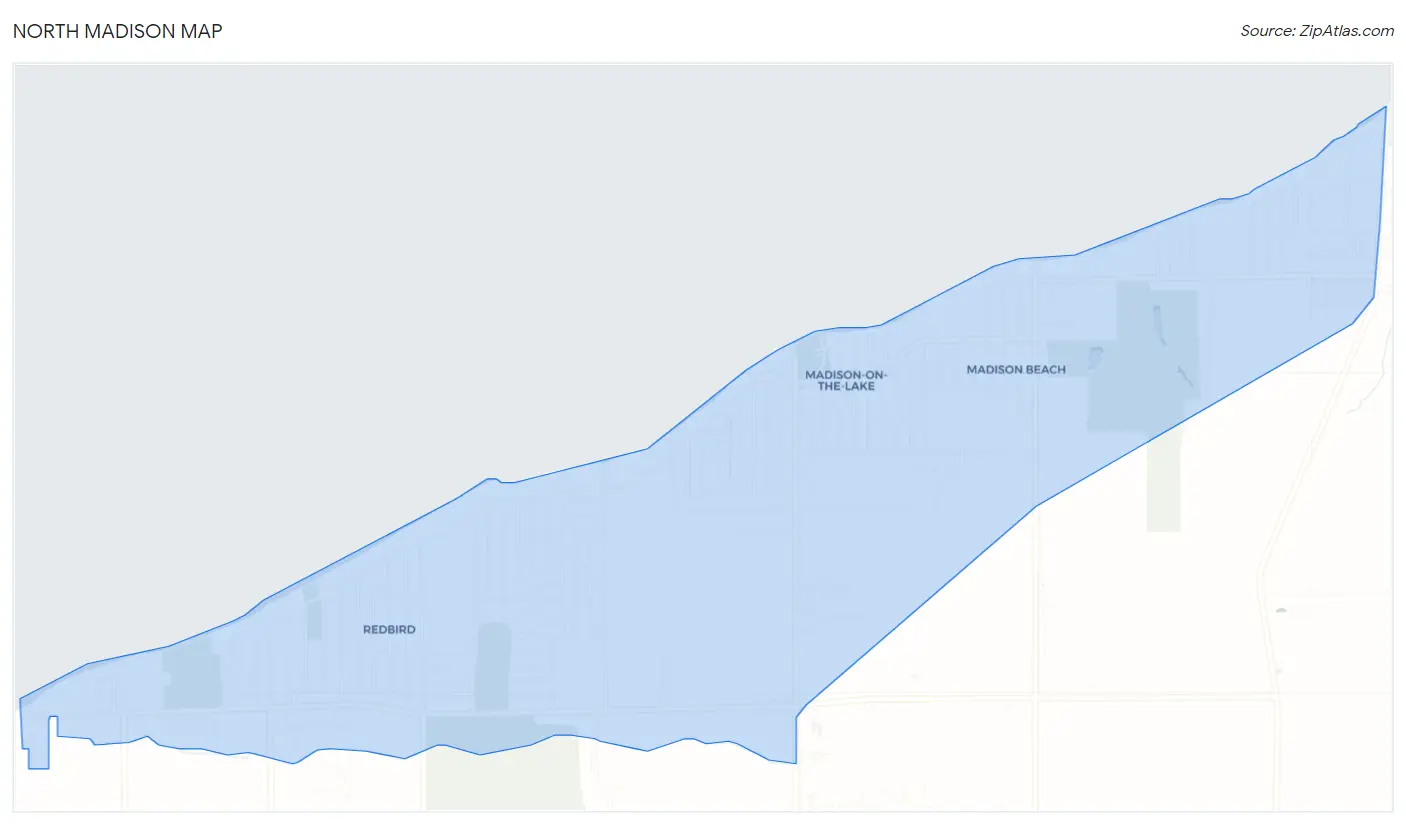
North Madison Overview
$31,456
PER CAPITA INCOME
$71,397
AVG FAMILY INCOME
$54,917
AVG HOUSEHOLD INCOME
27.1%
WAGE / INCOME GAP [ % ]
72.9¢/ $1
WAGE / INCOME GAP [ $ ]
0.39
INEQUALITY / GINI INDEX
8,313
TOTAL POPULATION
4,018
MALE POPULATION
4,295
FEMALE POPULATION
93.55
MALES / 100 FEMALES
106.89
FEMALES / 100 MALES
38.0
MEDIAN AGE
3.0
AVG FAMILY SIZE
2.4
AVG HOUSEHOLD SIZE
4,431
LABOR FORCE [ PEOPLE ]
67.0%
PERCENT IN LABOR FORCE
7.6%
UNEMPLOYMENT RATE
Income in North Madison
Income Overview in North Madison
Per Capita Income in North Madison is $31,456, while median incomes of families and households are $71,397 and $54,917 respectively.
| Characteristic | Number | Measure |
| Per Capita Income | 8,313 | $31,456 |
| Median Family Income | 2,122 | $71,397 |
| Mean Family Income | 2,122 | $91,193 |
| Median Household Income | 3,429 | $54,917 |
| Mean Household Income | 3,429 | $75,486 |
| Income Deficit | 2,122 | $0 |
| Wage / Income Gap (%) | 8,313 | 27.12% |
| Wage / Income Gap ($) | 8,313 | 72.88¢ per $1 |
| Gini / Inequality Index | 8,313 | 0.39 |
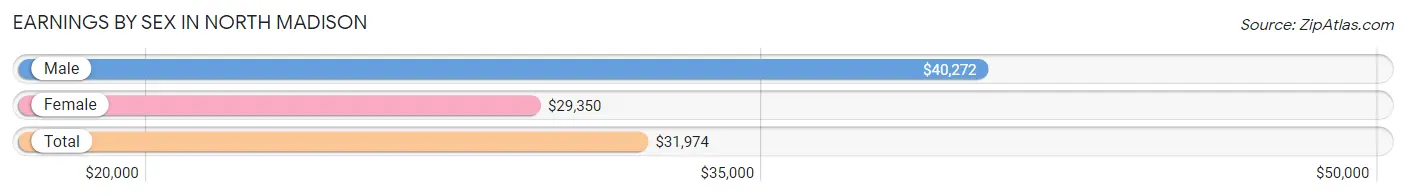
Earnings by Sex in North Madison
Average Earnings in North Madison are $31,974, $40,272 for men and $29,350 for women, a difference of 27.1%.
| Sex | Number | Average Earnings |
| Male | 2,363 (51.4%) | $40,272 |
| Female | 2,237 (48.6%) | $29,350 |
| Total | 4,600 (100.0%) | $31,974 |
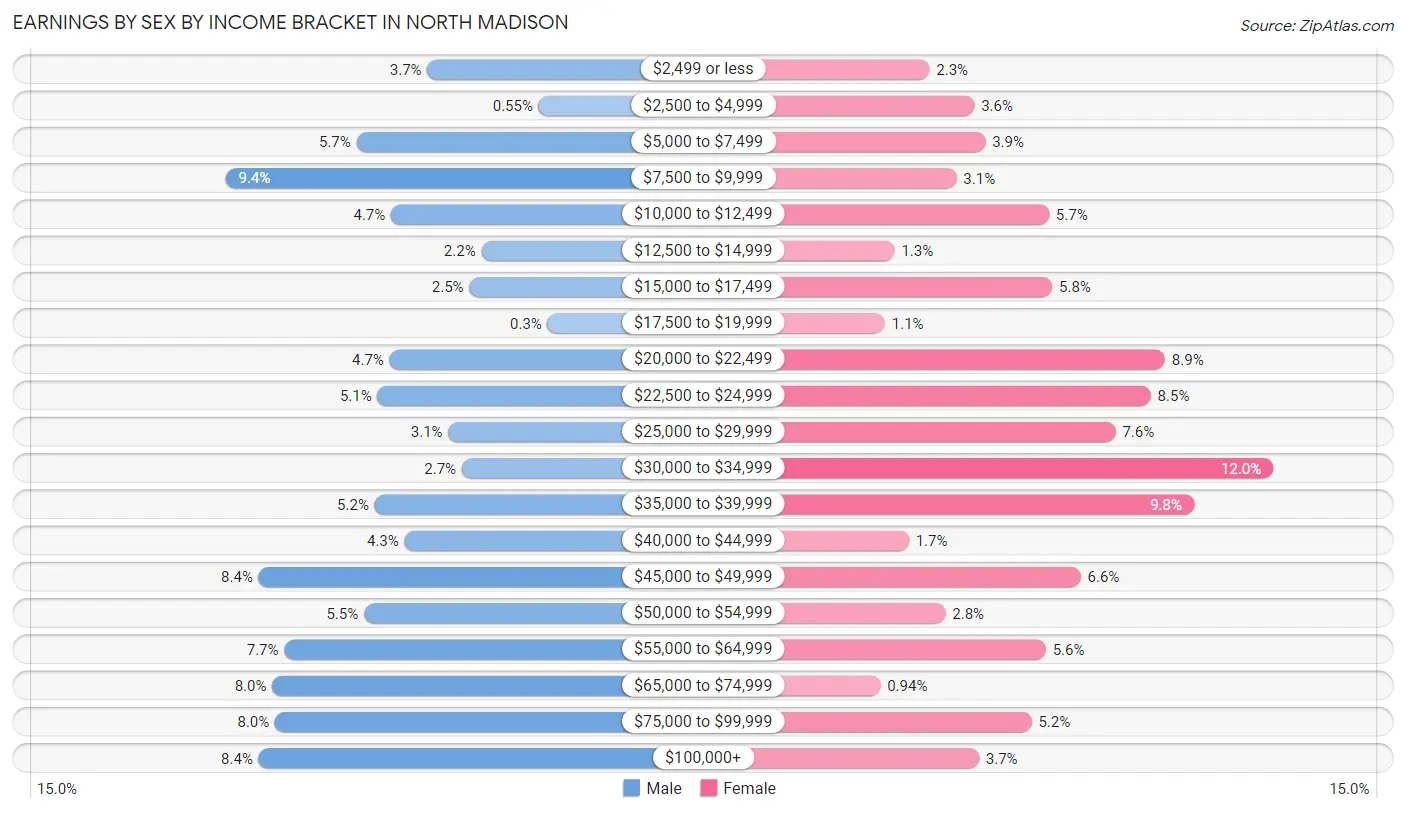
Earnings by Sex by Income Bracket in North Madison
The most common earnings brackets in North Madison are $7,500 to $9,999 for men (221 | 9.3%) and $30,000 to $34,999 for women (268 | 12.0%).
| Income | Male | Female |
| $2,499 or less | 87 (3.7%) | 52 (2.3%) |
| $2,500 to $4,999 | 13 (0.5%) | 80 (3.6%) |
| $5,000 to $7,499 | 134 (5.7%) | 87 (3.9%) |
| $7,500 to $9,999 | 221 (9.3%) | 69 (3.1%) |
| $10,000 to $12,499 | 111 (4.7%) | 127 (5.7%) |
| $12,500 to $14,999 | 51 (2.2%) | 30 (1.3%) |
| $15,000 to $17,499 | 59 (2.5%) | 129 (5.8%) |
| $17,500 to $19,999 | 7 (0.3%) | 24 (1.1%) |
| $20,000 to $22,499 | 112 (4.7%) | 200 (8.9%) |
| $22,500 to $24,999 | 120 (5.1%) | 191 (8.5%) |
| $25,000 to $29,999 | 73 (3.1%) | 169 (7.5%) |
| $30,000 to $34,999 | 64 (2.7%) | 268 (12.0%) |
| $35,000 to $39,999 | 122 (5.2%) | 218 (9.8%) |
| $40,000 to $44,999 | 102 (4.3%) | 39 (1.7%) |
| $45,000 to $49,999 | 199 (8.4%) | 147 (6.6%) |
| $50,000 to $54,999 | 129 (5.5%) | 62 (2.8%) |
| $55,000 to $64,999 | 182 (7.7%) | 125 (5.6%) |
| $65,000 to $74,999 | 190 (8.0%) | 21 (0.9%) |
| $75,000 to $99,999 | 188 (8.0%) | 116 (5.2%) |
| $100,000+ | 199 (8.4%) | 83 (3.7%) |
| Total | 2,363 (100.0%) | 2,237 (100.0%) |
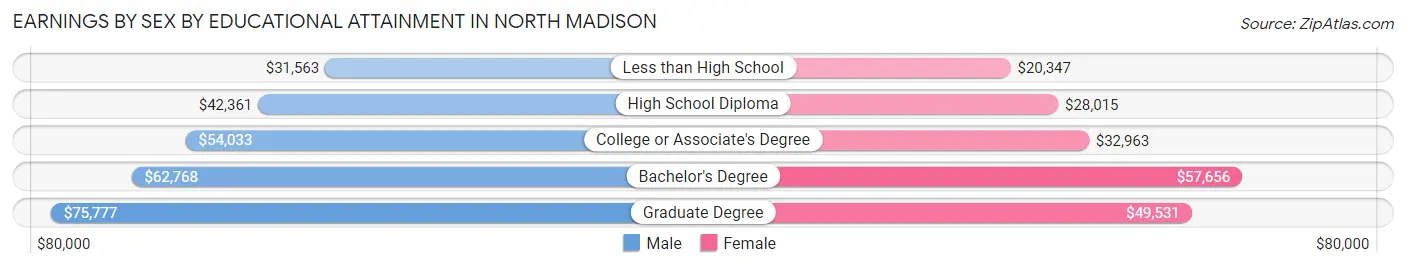
Earnings by Sex by Educational Attainment in North Madison
Average earnings in North Madison are $47,035 for men and $31,750 for women, a difference of 32.5%. Men with an educational attainment of graduate degree enjoy the highest average annual earnings of $75,777, while those with less than high school education earn the least with $31,563. Women with an educational attainment of bachelor's degree earn the most with the average annual earnings of $57,656, while those with less than high school education have the smallest earnings of $20,347.
| Educational Attainment | Male Income | Female Income |
| Less than High School | $31,563 | $20,347 |
| High School Diploma | $42,361 | $28,015 |
| College or Associate's Degree | $54,033 | $32,963 |
| Bachelor's Degree | $62,768 | $57,656 |
| Graduate Degree | $75,777 | $49,531 |
| Total | $47,035 | $31,750 |
Family Income in North Madison
Family Income Brackets in North Madison
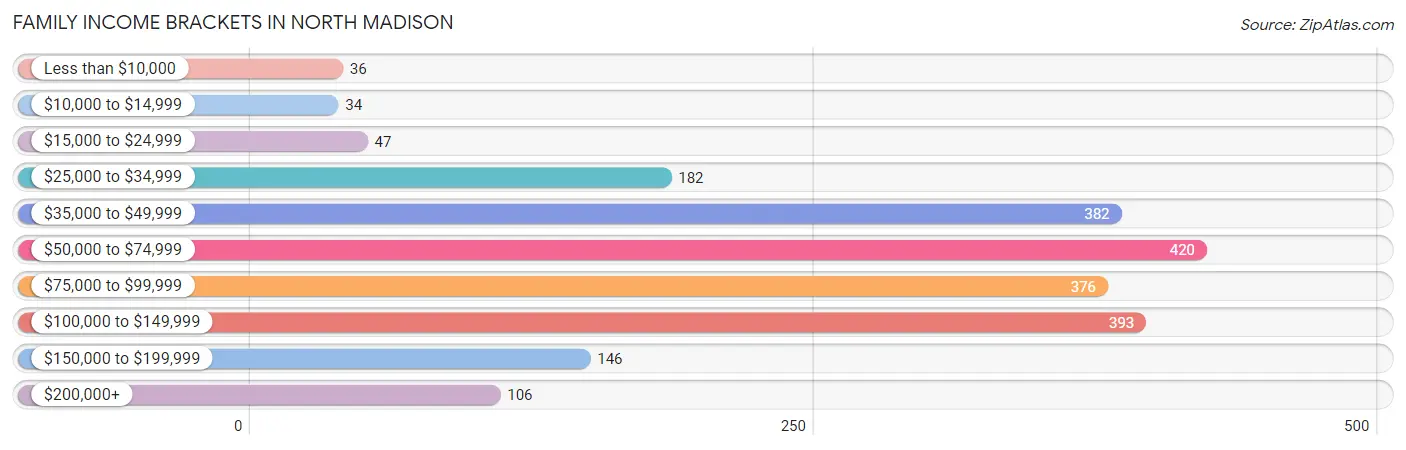
According to the North Madison family income data, there are 420 families falling into the $50,000 to $74,999 income range, which is the most common income bracket and makes up 19.8% of all families. Conversely, the $10,000 to $14,999 income bracket is the least frequent group with only 34 families (1.6%) belonging to this category.
| Income Bracket | # Families | % Families |
| Less than $10,000 | 36 | 1.7% |
| $10,000 to $14,999 | 34 | 1.6% |
| $15,000 to $24,999 | 47 | 2.2% |
| $25,000 to $34,999 | 182 | 8.6% |
| $35,000 to $49,999 | 382 | 18.0% |
| $50,000 to $74,999 | 420 | 19.8% |
| $75,000 to $99,999 | 376 | 17.7% |
| $100,000 to $149,999 | 393 | 18.5% |
| $150,000 to $199,999 | 146 | 6.9% |
| $200,000+ | 106 | 5.0% |
Family Income by Famaliy Size in North Madison
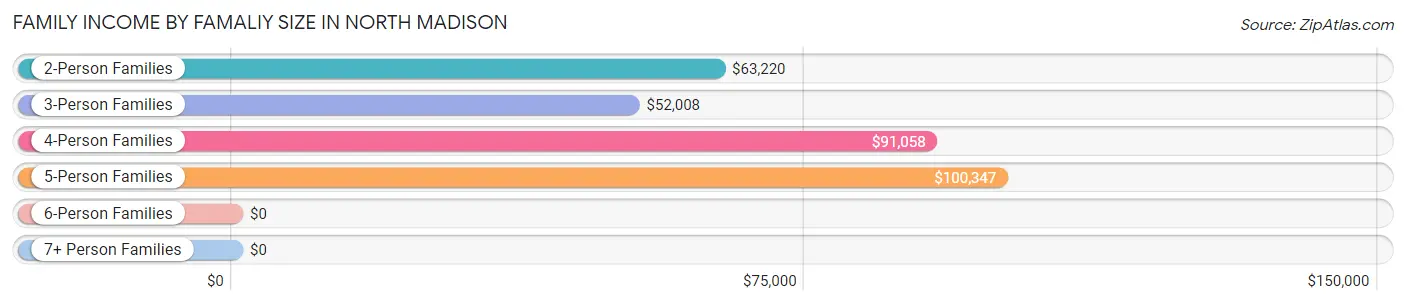
5-person families (117 | 5.5%) account for the highest median family income in North Madison with $100,347 per family, while 2-person families (1,069 | 50.4%) have the highest median income of $31,610 per family member.
| Income Bracket | # Families | Median Income |
| 2-Person Families | 1,069 (50.4%) | $63,220 |
| 3-Person Families | 473 (22.3%) | $52,008 |
| 4-Person Families | 421 (19.8%) | $91,058 |
| 5-Person Families | 117 (5.5%) | $100,347 |
| 6-Person Families | 34 (1.6%) | $0 |
| 7+ Person Families | 8 (0.4%) | $0 |
| Total | 2,122 (100.0%) | $71,397 |
Family Income by Number of Earners in North Madison
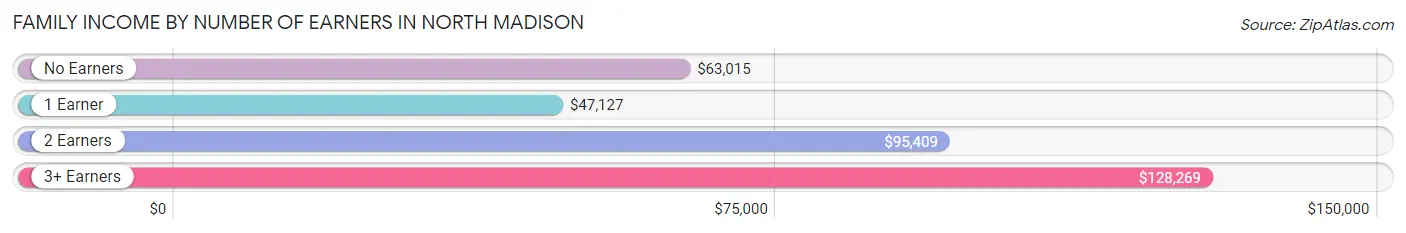
The median family income in North Madison is $71,397, with families comprising 3+ earners (238) having the highest median family income of $128,269, while families with 1 earner (725) have the lowest median family income of $47,127, accounting for 11.2% and 34.2% of families, respectively.
| Number of Earners | # Families | Median Income |
| No Earners | 321 (15.1%) | $63,015 |
| 1 Earner | 725 (34.2%) | $47,127 |
| 2 Earners | 838 (39.5%) | $95,409 |
| 3+ Earners | 238 (11.2%) | $128,269 |
| Total | 2,122 (100.0%) | $71,397 |
Household Income in North Madison
Household Income Brackets in North Madison
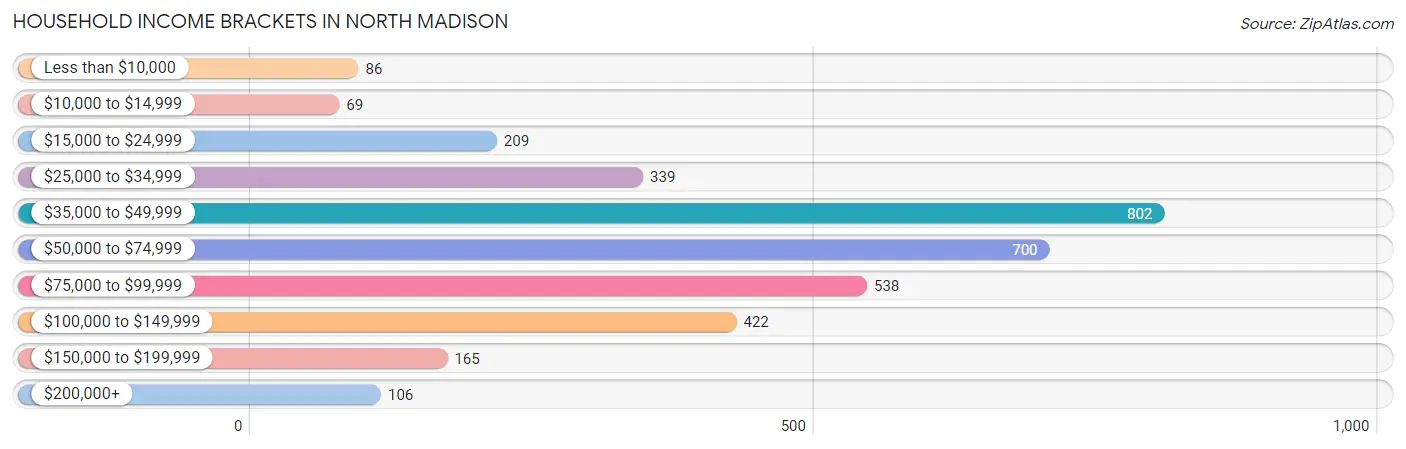
With 802 households falling in the category, the $35,000 to $49,999 income range is the most frequent in North Madison, accounting for 23.4% of all households. In contrast, only 69 households (2.0%) fall into the $10,000 to $14,999 income bracket, making it the least populous group.
| Income Bracket | # Households | % Households |
| Less than $10,000 | 86 | 2.5% |
| $10,000 to $14,999 | 69 | 2.0% |
| $15,000 to $24,999 | 209 | 6.1% |
| $25,000 to $34,999 | 339 | 9.9% |
| $35,000 to $49,999 | 802 | 23.4% |
| $50,000 to $74,999 | 700 | 20.4% |
| $75,000 to $99,999 | 538 | 15.7% |
| $100,000 to $149,999 | 422 | 12.3% |
| $150,000 to $199,999 | 165 | 4.8% |
| $200,000+ | 106 | 3.1% |
Household Income by Householder Age in North Madison
The median household income in North Madison is $54,917, with the highest median household income of $62,216 found in the 25 to 44 years age bracket for the primary householder. A total of 971 households (28.3%) fall into this category. Meanwhile, the 65+ years age bracket for the primary householder has the lowest median household income of $47,040, with 1,029 households (30.0%) in this group.
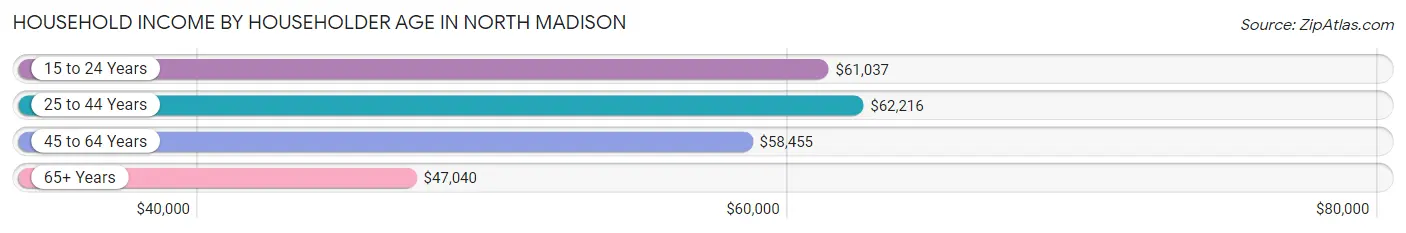
| Income Bracket | # Households | Median Income |
| 15 to 24 Years | 221 (6.5%) | $61,037 |
| 25 to 44 Years | 971 (28.3%) | $62,216 |
| 45 to 64 Years | 1,208 (35.2%) | $58,455 |
| 65+ Years | 1,029 (30.0%) | $47,040 |
| Total | 3,429 (100.0%) | $54,917 |
Poverty in North Madison
Income Below Poverty by Sex and Age in North Madison
With 6.2% poverty level for males and 6.5% for females among the residents of North Madison, 18 to 24 year old males and under 5 year old females are the most vulnerable to poverty, with 71 males (16.1%) and 53 females (26.0%) in their respective age groups living below the poverty level.
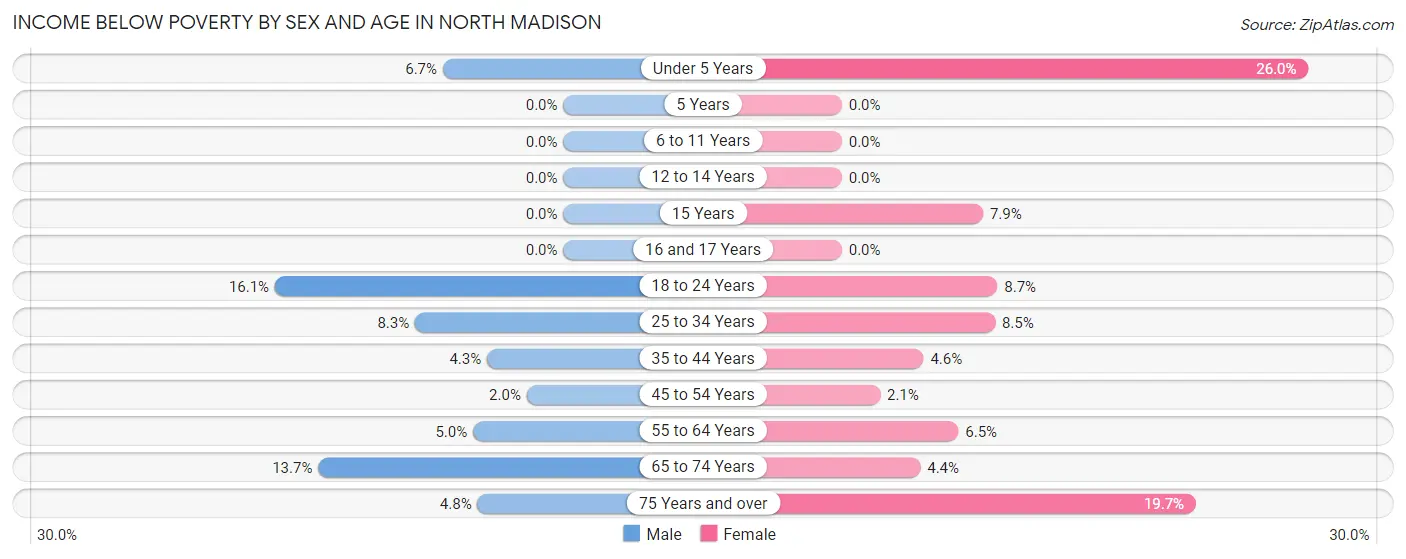
| Age Bracket | Male | Female |
| Under 5 Years | 11 (6.7%) | 53 (26.0%) |
| 5 Years | 0 (0.0%) | 0 (0.0%) |
| 6 to 11 Years | 0 (0.0%) | 0 (0.0%) |
| 12 to 14 Years | 0 (0.0%) | 0 (0.0%) |
| 15 Years | 0 (0.0%) | 11 (7.9%) |
| 16 and 17 Years | 0 (0.0%) | 0 (0.0%) |
| 18 to 24 Years | 71 (16.1%) | 51 (8.7%) |
| 25 to 34 Years | 49 (8.3%) | 44 (8.5%) |
| 35 to 44 Years | 11 (4.3%) | 19 (4.5%) |
| 45 to 54 Years | 12 (2.0%) | 10 (2.1%) |
| 55 to 64 Years | 30 (5.0%) | 34 (6.5%) |
| 65 to 74 Years | 52 (13.7%) | 29 (4.4%) |
| 75 Years and over | 14 (4.8%) | 28 (19.7%) |
| Total | 250 (6.2%) | 279 (6.5%) |
Income Above Poverty by Sex and Age in North Madison
According to the poverty statistics in North Madison, males aged 5 years and females aged 5 years are the age groups that are most secure financially, with 100.0% of males and 100.0% of females in these age groups living above the poverty line.
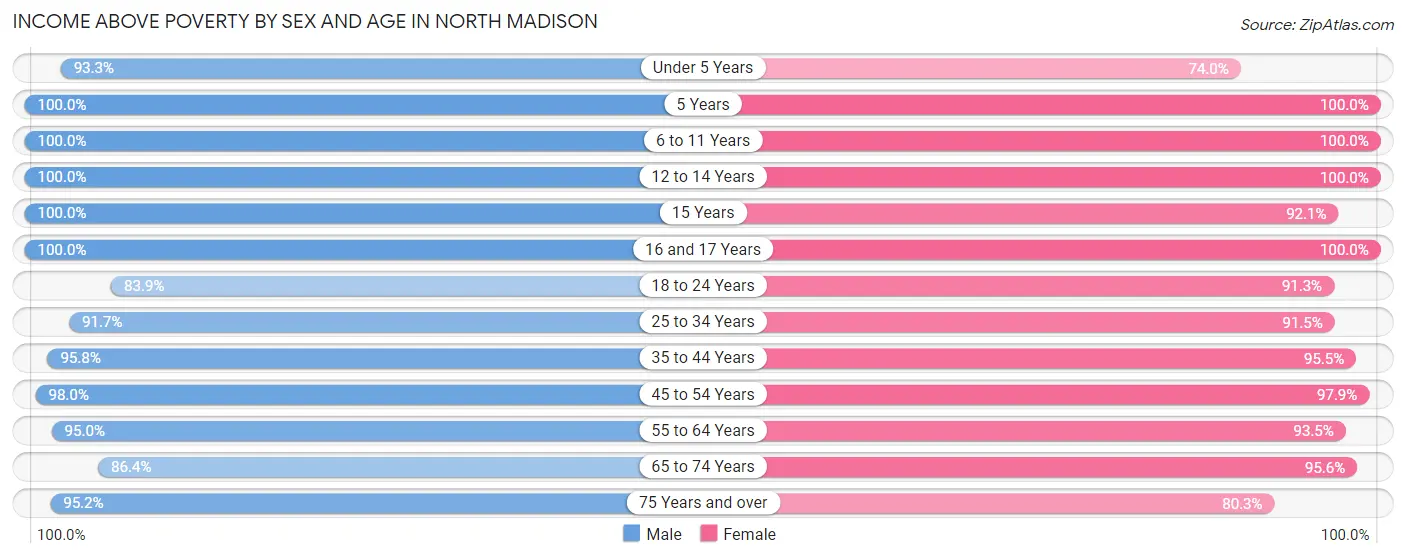
| Age Bracket | Male | Female |
| Under 5 Years | 153 (93.3%) | 151 (74.0%) |
| 5 Years | 11 (100.0%) | 45 (100.0%) |
| 6 to 11 Years | 472 (100.0%) | 318 (100.0%) |
| 12 to 14 Years | 63 (100.0%) | 247 (100.0%) |
| 15 Years | 19 (100.0%) | 129 (92.1%) |
| 16 and 17 Years | 119 (100.0%) | 19 (100.0%) |
| 18 to 24 Years | 371 (83.9%) | 538 (91.3%) |
| 25 to 34 Years | 544 (91.7%) | 472 (91.5%) |
| 35 to 44 Years | 248 (95.8%) | 399 (95.5%) |
| 45 to 54 Years | 577 (98.0%) | 460 (97.9%) |
| 55 to 64 Years | 567 (95.0%) | 490 (93.5%) |
| 65 to 74 Years | 329 (86.4%) | 634 (95.6%) |
| 75 Years and over | 279 (95.2%) | 114 (80.3%) |
| Total | 3,752 (93.8%) | 4,016 (93.5%) |
Income Below Poverty Among Married-Couple Families in North Madison
The poverty statistics for married-couple families in North Madison show that 1.8% or 24 of the total 1,360 families live below the poverty line. Families with 1 or 2 children have the highest poverty rate of 3.5%, comprising of 10 families. On the other hand, families with 3 or 4 children have the lowest poverty rate of 0.0%, which includes 0 families.
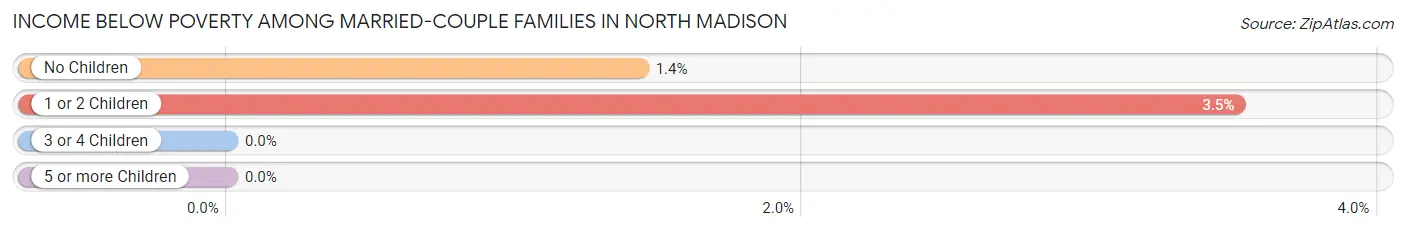
| Children | Above Poverty | Below Poverty |
| No Children | 967 (98.6%) | 14 (1.4%) |
| 1 or 2 Children | 275 (96.5%) | 10 (3.5%) |
| 3 or 4 Children | 94 (100.0%) | 0 (0.0%) |
| 5 or more Children | 0 (0.0%) | 0 (0.0%) |
| Total | 1,336 (98.2%) | 24 (1.8%) |
Income Below Poverty Among Single-Parent Households in North Madison
According to the poverty data in North Madison, 13.4% or 37 single-father households and 4.1% or 20 single-mother households are living below the poverty line. Among single-father households, those with 1 or 2 children have the highest poverty rate, with 37 households (17.8%) experiencing poverty. Likewise, among single-mother households, those with 3 or 4 children have the highest poverty rate, with 12 households (17.4%) falling below the poverty line.
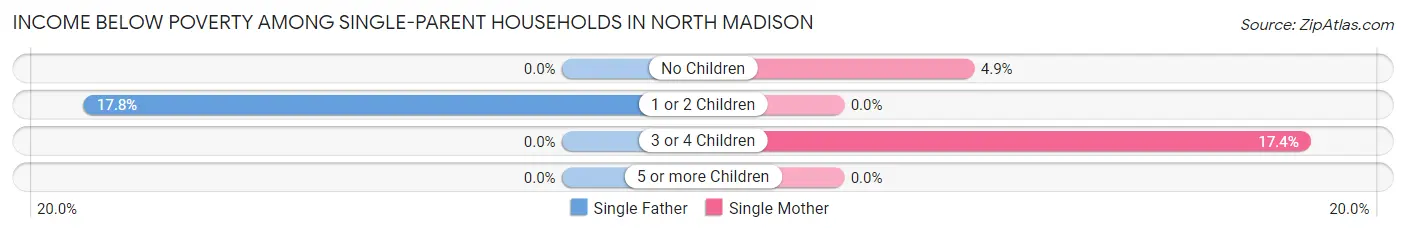
| Children | Single Father | Single Mother |
| No Children | 0 (0.0%) | 8 (4.9%) |
| 1 or 2 Children | 37 (17.8%) | 0 (0.0%) |
| 3 or 4 Children | 0 (0.0%) | 12 (17.4%) |
| 5 or more Children | 0 (0.0%) | 0 (0.0%) |
| Total | 37 (13.4%) | 20 (4.1%) |
Income Below Poverty Among Married-Couple vs Single-Parent Households in North Madison
The poverty data for North Madison shows that 24 of the married-couple family households (1.8%) and 57 of the single-parent households (7.5%) are living below the poverty level. Within the married-couple family households, those with 1 or 2 children have the highest poverty rate, with 10 households (3.5%) falling below the poverty line. Among the single-parent households, those with 3 or 4 children have the highest poverty rate, with 12 household (16.0%) living below poverty.
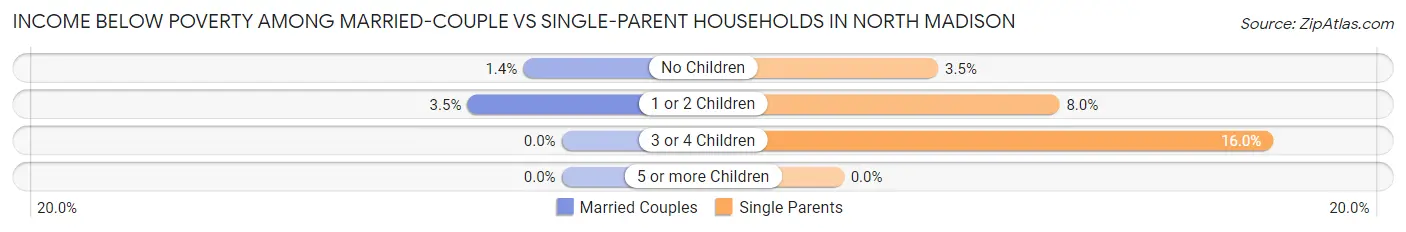
| Children | Married-Couple Families | Single-Parent Households |
| No Children | 14 (1.4%) | 8 (3.5%) |
| 1 or 2 Children | 10 (3.5%) | 37 (8.0%) |
| 3 or 4 Children | 0 (0.0%) | 12 (16.0%) |
| 5 or more Children | 0 (0.0%) | 0 (0.0%) |
| Total | 24 (1.8%) | 57 (7.5%) |
Race in North Madison
The most populous races in North Madison are White / Caucasian (7,919 | 95.3%), Hispanic or Latino (313 | 3.8%), and Two or more Races (292 | 3.5%).
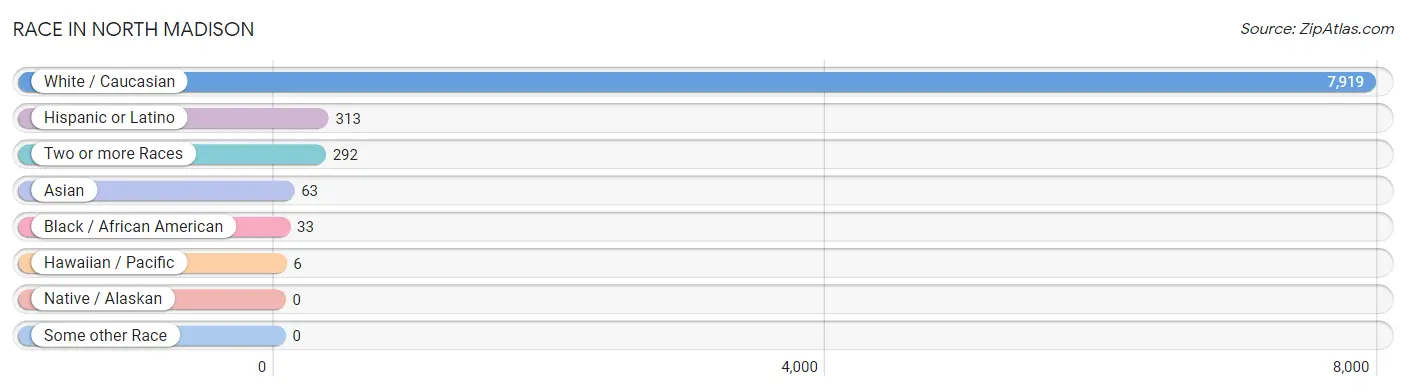
| Race | # Population | % Population |
| Asian | 63 | 0.8% |
| Black / African American | 33 | 0.4% |
| Hawaiian / Pacific | 6 | 0.1% |
| Hispanic or Latino | 313 | 3.8% |
| Native / Alaskan | 0 | 0.0% |
| White / Caucasian | 7,919 | 95.3% |
| Two or more Races | 292 | 3.5% |
| Some other Race | 0 | 0.0% |
| Total | 8,313 | 100.0% |
Ancestry in North Madison
The most populous ancestries reported in North Madison are German (2,487 | 29.9%), Irish (2,038 | 24.5%), English (1,048 | 12.6%), Italian (1,019 | 12.3%), and Slovene (424 | 5.1%), together accounting for 84.4% of all North Madison residents.
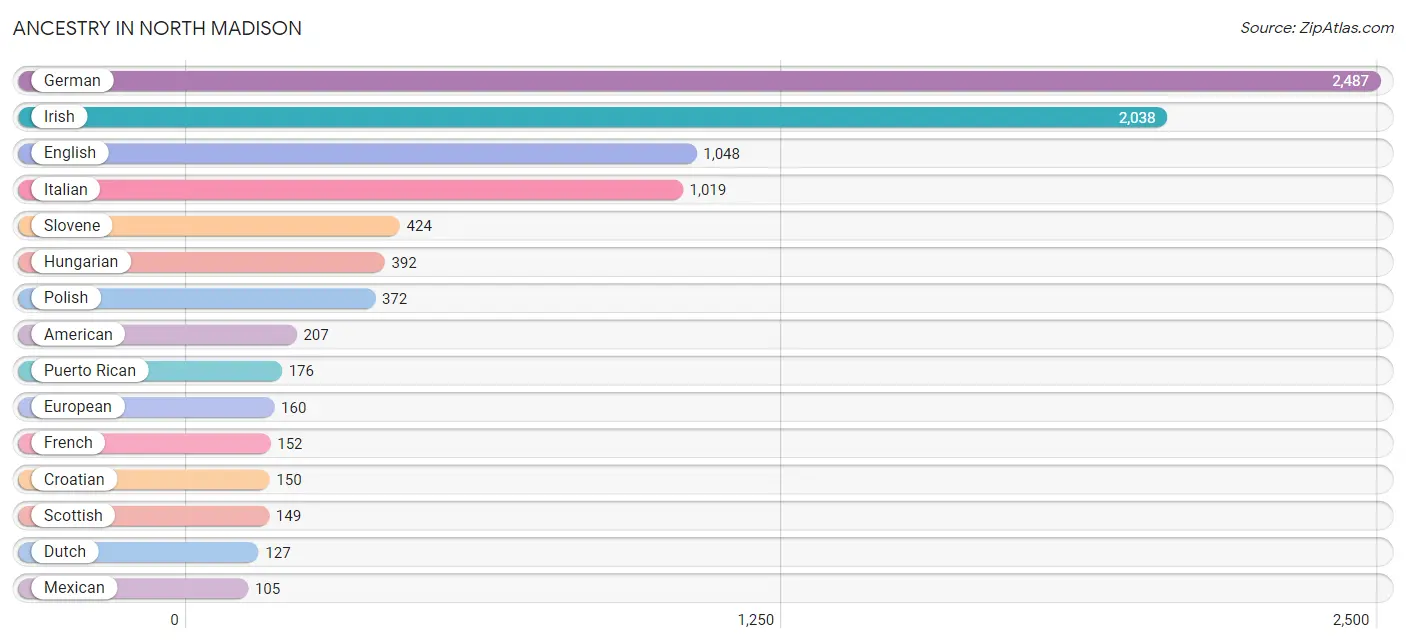
| Ancestry | # Population | % Population |
| American | 207 | 2.5% |
| Arab | 14 | 0.2% |
| Armenian | 18 | 0.2% |
| Austrian | 28 | 0.3% |
| British | 37 | 0.4% |
| Canadian | 15 | 0.2% |
| Central American | 32 | 0.4% |
| Cherokee | 1 | 0.0% |
| Croatian | 150 | 1.8% |
| Czech | 19 | 0.2% |
| Danish | 31 | 0.4% |
| Dutch | 127 | 1.5% |
| Eastern European | 13 | 0.2% |
| English | 1,048 | 12.6% |
| European | 160 | 1.9% |
| Finnish | 79 | 0.9% |
| French | 152 | 1.8% |
| German | 2,487 | 29.9% |
| Greek | 20 | 0.2% |
| Hungarian | 392 | 4.7% |
| Indian (Asian) | 23 | 0.3% |
| Irish | 2,038 | 24.5% |
| Italian | 1,019 | 12.3% |
| Korean | 12 | 0.1% |
| Lebanese | 14 | 0.2% |
| Mexican | 105 | 1.3% |
| Northern European | 11 | 0.1% |
| Polish | 372 | 4.5% |
| Puerto Rican | 176 | 2.1% |
| Romanian | 18 | 0.2% |
| Russian | 94 | 1.1% |
| Salvadoran | 32 | 0.4% |
| Samoan | 6 | 0.1% |
| Scotch-Irish | 13 | 0.2% |
| Scottish | 149 | 1.8% |
| Slovak | 99 | 1.2% |
| Slovene | 424 | 5.1% |
| Swedish | 76 | 0.9% |
| Swiss | 11 | 0.1% |
| Thai | 40 | 0.5% |
| Welsh | 62 | 0.7% | View All 41 Rows |
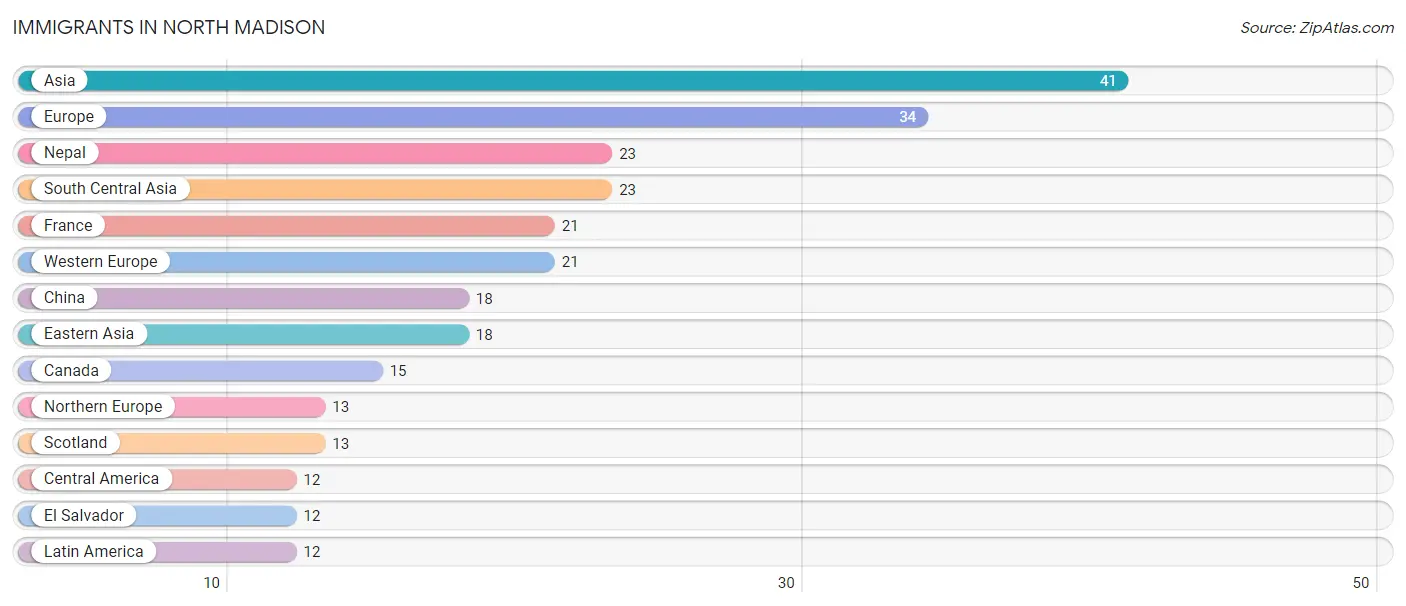
Immigrants in North Madison
The most numerous immigrant groups reported in North Madison came from Asia (41 | 0.5%), Europe (34 | 0.4%), Nepal (23 | 0.3%), South Central Asia (23 | 0.3%), and France (21 | 0.3%), together accounting for 1.7% of all North Madison residents.
| Immigration Origin | # Population | % Population |
| Asia | 41 | 0.5% |
| Canada | 15 | 0.2% |
| Central America | 12 | 0.1% |
| China | 18 | 0.2% |
| Eastern Asia | 18 | 0.2% |
| El Salvador | 12 | 0.1% |
| Europe | 34 | 0.4% |
| France | 21 | 0.3% |
| Latin America | 12 | 0.1% |
| Nepal | 23 | 0.3% |
| Northern Europe | 13 | 0.2% |
| Scotland | 13 | 0.2% |
| South Central Asia | 23 | 0.3% |
| Western Europe | 21 | 0.3% | View All 14 Rows |
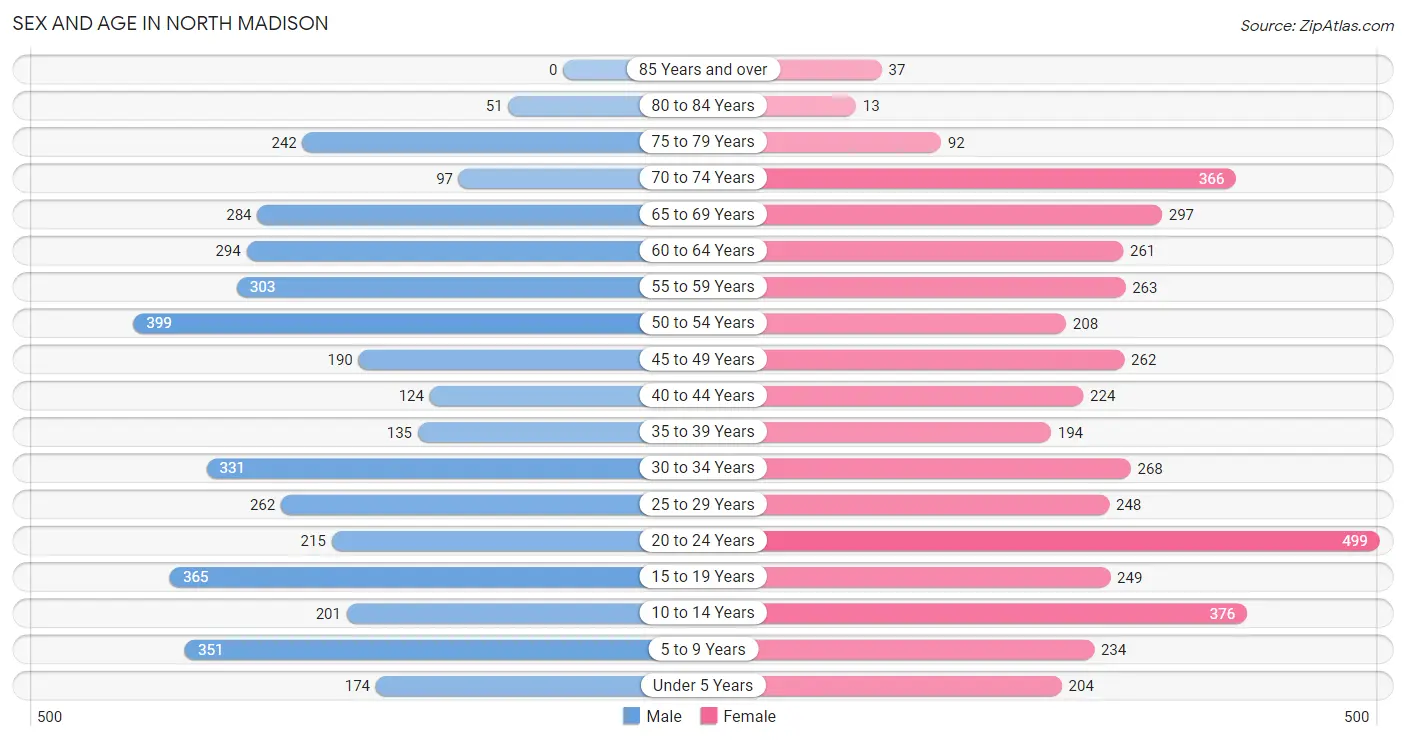
Sex and Age in North Madison
Sex and Age in North Madison
The most populous age groups in North Madison are 50 to 54 Years (399 | 9.9%) for men and 20 to 24 Years (499 | 11.6%) for women.
| Age Bracket | Male | Female |
| Under 5 Years | 174 (4.3%) | 204 (4.8%) |
| 5 to 9 Years | 351 (8.7%) | 234 (5.4%) |
| 10 to 14 Years | 201 (5.0%) | 376 (8.7%) |
| 15 to 19 Years | 365 (9.1%) | 249 (5.8%) |
| 20 to 24 Years | 215 (5.3%) | 499 (11.6%) |
| 25 to 29 Years | 262 (6.5%) | 248 (5.8%) |
| 30 to 34 Years | 331 (8.2%) | 268 (6.2%) |
| 35 to 39 Years | 135 (3.4%) | 194 (4.5%) |
| 40 to 44 Years | 124 (3.1%) | 224 (5.2%) |
| 45 to 49 Years | 190 (4.7%) | 262 (6.1%) |
| 50 to 54 Years | 399 (9.9%) | 208 (4.8%) |
| 55 to 59 Years | 303 (7.5%) | 263 (6.1%) |
| 60 to 64 Years | 294 (7.3%) | 261 (6.1%) |
| 65 to 69 Years | 284 (7.1%) | 297 (6.9%) |
| 70 to 74 Years | 97 (2.4%) | 366 (8.5%) |
| 75 to 79 Years | 242 (6.0%) | 92 (2.1%) |
| 80 to 84 Years | 51 (1.3%) | 13 (0.3%) |
| 85 Years and over | 0 (0.0%) | 37 (0.9%) |
| Total | 4,018 (100.0%) | 4,295 (100.0%) |
Families and Households in North Madison
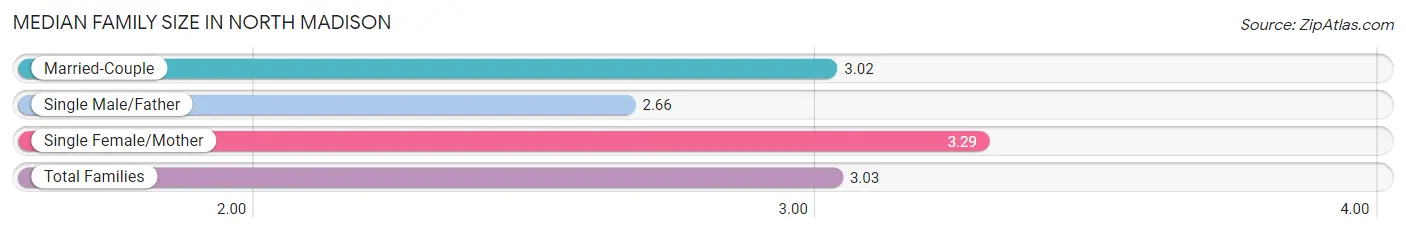
Median Family Size in North Madison
The median family size in North Madison is 3.03 persons per family, with single female/mother families (486 | 22.9%) accounting for the largest median family size of 3.29 persons per family. On the other hand, single male/father families (276 | 13.0%) represent the smallest median family size with 2.66 persons per family.
| Family Type | # Families | Family Size |
| Married-Couple | 1,360 (64.1%) | 3.02 |
| Single Male/Father | 276 (13.0%) | 2.66 |
| Single Female/Mother | 486 (22.9%) | 3.29 |
| Total Families | 2,122 (100.0%) | 3.03 |
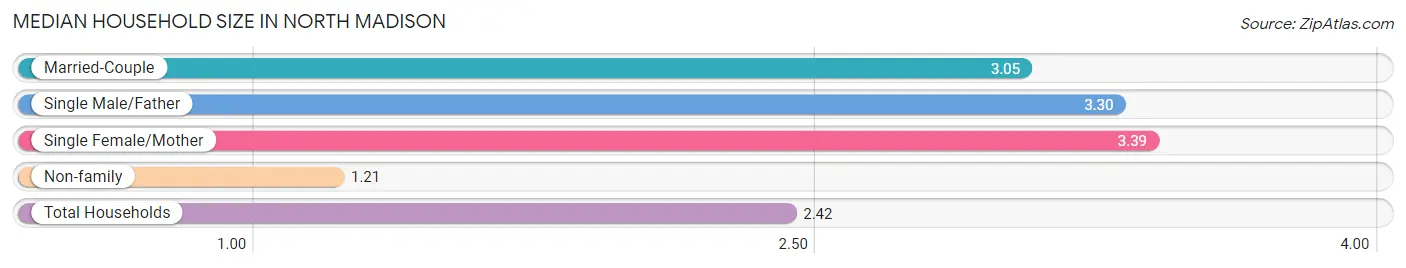
Median Household Size in North Madison
The median household size in North Madison is 2.42 persons per household, with single female/mother households (486 | 14.2%) accounting for the largest median household size of 3.39 persons per household. non-family households (1,307 | 38.1%) represent the smallest median household size with 1.21 persons per household.
| Household Type | # Households | Household Size |
| Married-Couple | 1,360 (39.7%) | 3.05 |
| Single Male/Father | 276 (8.1%) | 3.30 |
| Single Female/Mother | 486 (14.2%) | 3.39 |
| Non-family | 1,307 (38.1%) | 1.21 |
| Total Households | 3,429 (100.0%) | 2.42 |
Household Size by Marriage Status in North Madison
Out of a total of 3,429 households in North Madison, 2,122 (61.9%) are family households, while 1,307 (38.1%) are nonfamily households. The most numerous type of family households are 2-person households, comprising 946, and the most common type of nonfamily households are 1-person households, comprising 1,009.
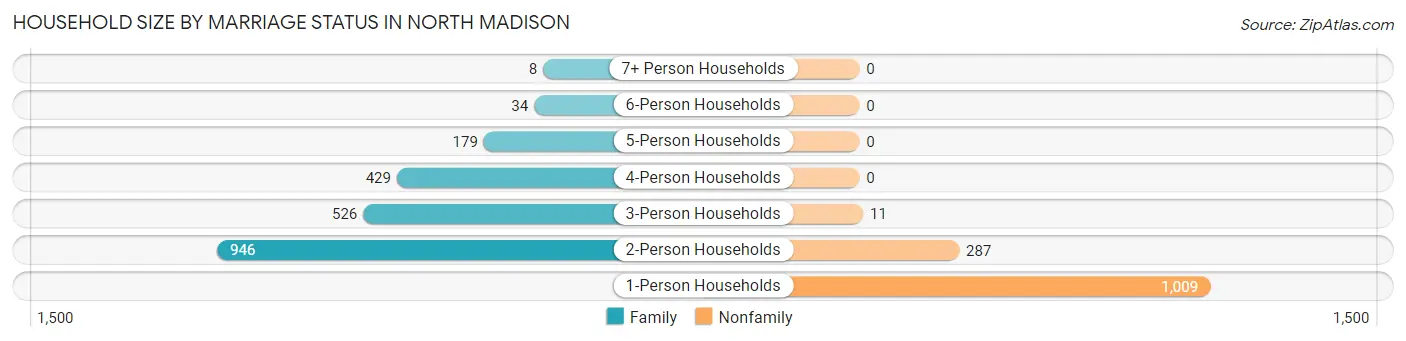
| Household Size | Family Households | Nonfamily Households |
| 1-Person Households | - | 1,009 (29.4%) |
| 2-Person Households | 946 (27.6%) | 287 (8.4%) |
| 3-Person Households | 526 (15.3%) | 11 (0.3%) |
| 4-Person Households | 429 (12.5%) | 0 (0.0%) |
| 5-Person Households | 179 (5.2%) | 0 (0.0%) |
| 6-Person Households | 34 (1.0%) | 0 (0.0%) |
| 7+ Person Households | 8 (0.2%) | 0 (0.0%) |
| Total | 2,122 (61.9%) | 1,307 (38.1%) |
Female Fertility in North Madison
Fertility by Age in North Madison
Average fertility rate in North Madison is 16.0 births per 1,000 women. Women in the age bracket of 20 to 34 years have the highest fertility rate with 21.0 births per 1,000 women. Women in the age bracket of 20 to 34 years acount for 65.6% of all women with births.
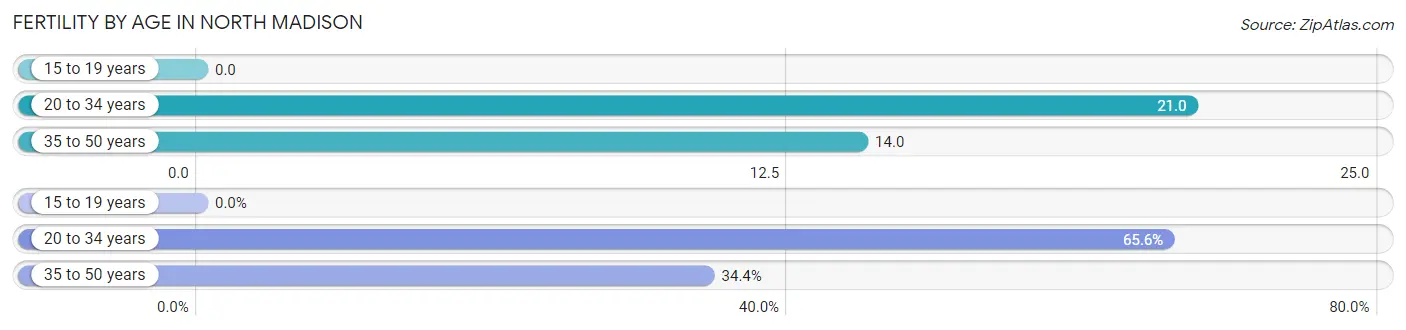
| Age Bracket | Women with Births | Births / 1,000 Women |
| 15 to 19 years | 0 (0.0%) | 0.0 |
| 20 to 34 years | 21 (65.6%) | 21.0 |
| 35 to 50 years | 11 (34.4%) | 14.0 |
| Total | 32 (100.0%) | 16.0 |
Fertility by Age by Marriage Status in North Madison
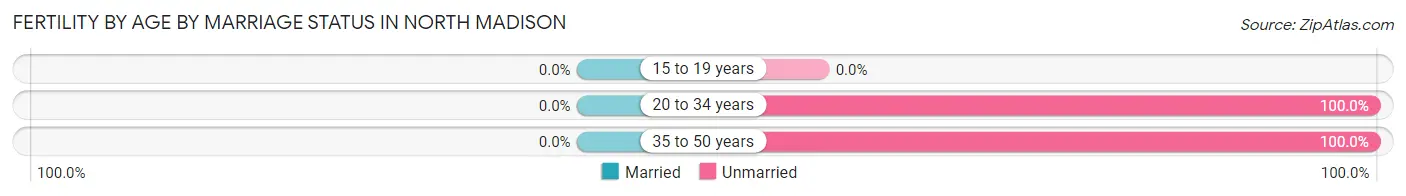
| Age Bracket | Married | Unmarried |
| 15 to 19 years | 0 (0.0%) | 0 (0.0%) |
| 20 to 34 years | 0 (0.0%) | 21 (100.0%) |
| 35 to 50 years | 0 (0.0%) | 11 (100.0%) |
| Total | 0 (0.0%) | 32 (100.0%) |
Fertility by Education in North Madison
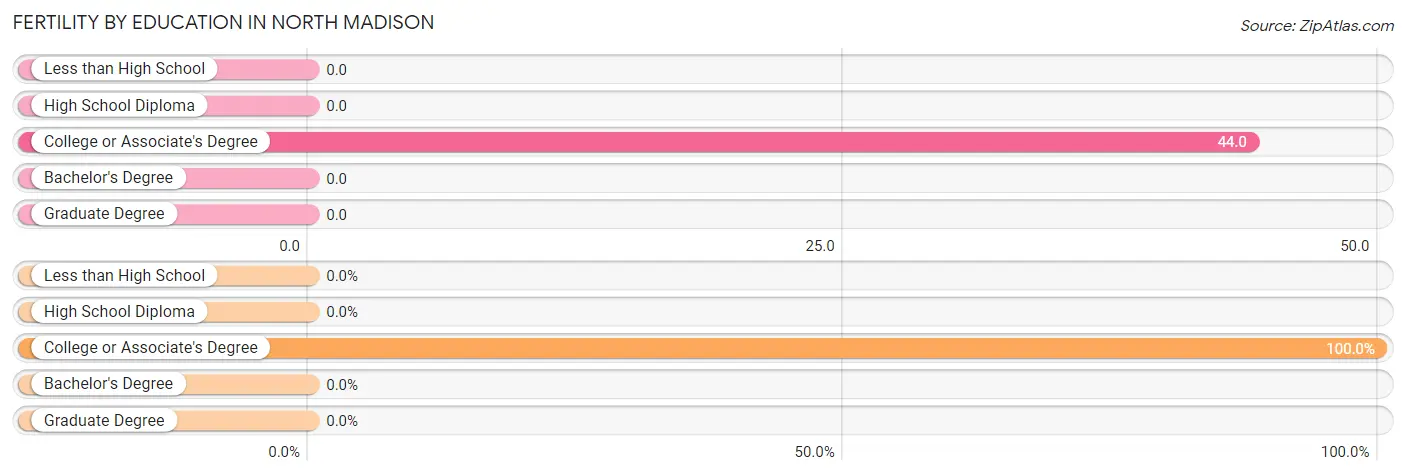
| Educational Attainment | Women with Births | Births / 1,000 Women |
| Less than High School | 0 (0.0%) | 0.0 |
| High School Diploma | 0 (0.0%) | 0.0 |
| College or Associate's Degree | 32 (100.0%) | 44.0 |
| Bachelor's Degree | 0 (0.0%) | 0.0 |
| Graduate Degree | 0 (0.0%) | 0.0 |
| Total | 32 (100.0%) | 16.0 |
Fertility by Education by Marriage Status in North Madison
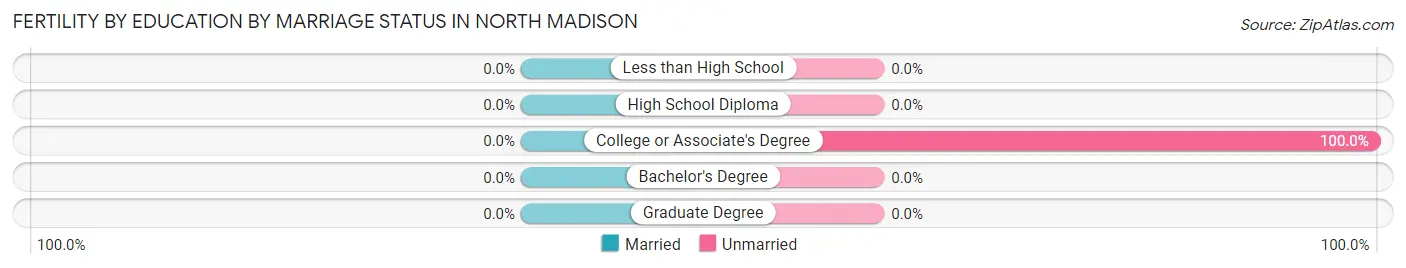
| Educational Attainment | Married | Unmarried |
| Less than High School | 0 (0.0%) | 0 (0.0%) |
| High School Diploma | 0 (0.0%) | 0 (0.0%) |
| College or Associate's Degree | 0 (0.0%) | 32 (100.0%) |
| Bachelor's Degree | 0 (0.0%) | 0 (0.0%) |
| Graduate Degree | 0 (0.0%) | 0 (0.0%) |
| Total | 0 (0.0%) | 32 (100.0%) |
Employment Characteristics in North Madison
Employment by Class of Employer in North Madison
Among the 4,066 employed individuals in North Madison, private company employees (3,438 | 84.6%), not-for-profit organizations (232 | 5.7%), and local government employees (177 | 4.3%) make up the most common classes of employment.
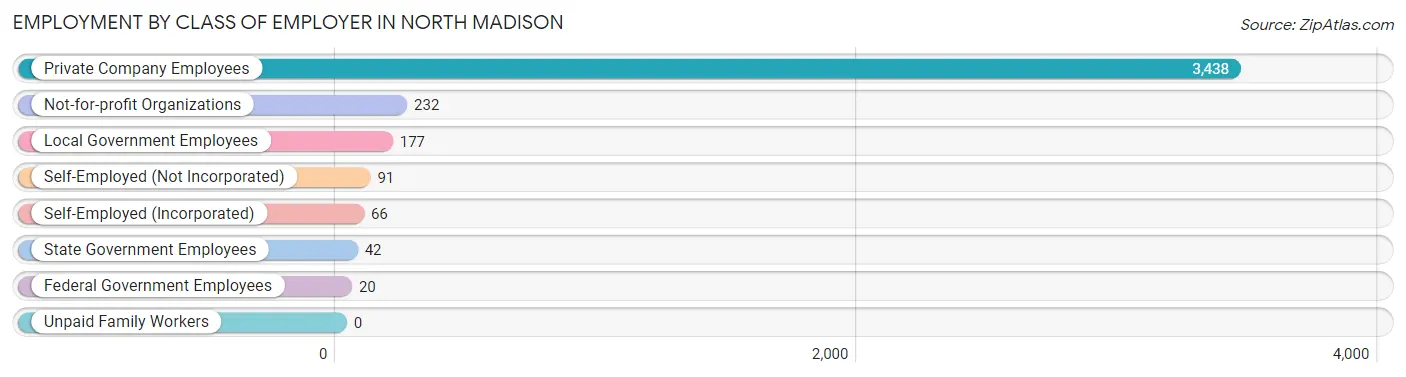
| Employer Class | # Employees | % Employees |
| Private Company Employees | 3,438 | 84.6% |
| Self-Employed (Incorporated) | 66 | 1.6% |
| Self-Employed (Not Incorporated) | 91 | 2.2% |
| Not-for-profit Organizations | 232 | 5.7% |
| Local Government Employees | 177 | 4.3% |
| State Government Employees | 42 | 1.0% |
| Federal Government Employees | 20 | 0.5% |
| Unpaid Family Workers | 0 | 0.0% |
| Total | 4,066 | 100.0% |
Employment Status by Age in North Madison
According to the labor force statistics for North Madison, out of the total population over 16 years of age (6,614), 67.0% or 4,431 individuals are in the labor force, with 7.6% or 337 of them unemployed. The age group with the highest labor force participation rate is 35 to 44 years, with 93.2% or 631 individuals in the labor force. Within the labor force, the 45 to 54 years age range has the highest percentage of unemployed individuals, with 18.9% or 180 of them being unemployed.
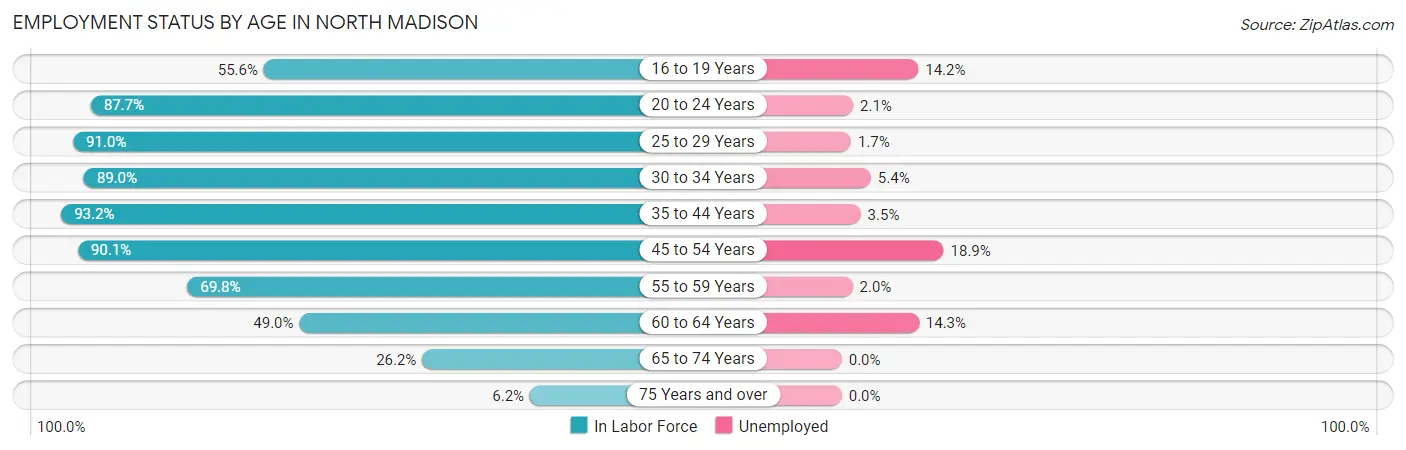
| Age Bracket | In Labor Force | Unemployed |
| 16 to 19 Years | 253 (55.6%) | 36 (14.2%) |
| 20 to 24 Years | 626 (87.7%) | 13 (2.1%) |
| 25 to 29 Years | 464 (91.0%) | 8 (1.7%) |
| 30 to 34 Years | 533 (89.0%) | 29 (5.4%) |
| 35 to 44 Years | 631 (93.2%) | 22 (3.5%) |
| 45 to 54 Years | 954 (90.1%) | 180 (18.9%) |
| 55 to 59 Years | 395 (69.8%) | 8 (2.0%) |
| 60 to 64 Years | 272 (49.0%) | 39 (14.3%) |
| 65 to 74 Years | 274 (26.2%) | 0 (0.0%) |
| 75 Years and over | 27 (6.2%) | 0 (0.0%) |
| Total | 4,431 (67.0%) | 337 (7.6%) |
Employment Status by Educational Attainment in North Madison
According to labor force statistics for North Madison, 81.9% of individuals (3,248) out of the total population between 25 and 64 years of age (3,966) are in the labor force, with 8.8% or 286 of them being unemployed. The group with the highest labor force participation rate are those with the educational attainment of college / associate degree, with 85.6% or 1,117 individuals in the labor force. Within the labor force, individuals with high school diploma education have the highest percentage of unemployment, with 10.4% or 150 of them being unemployed.
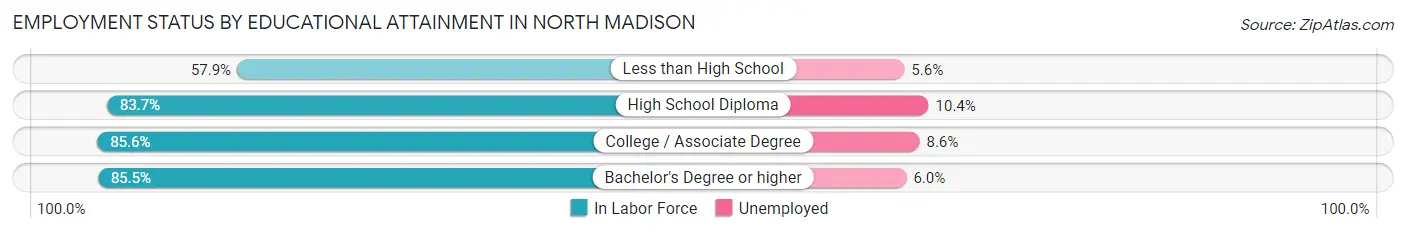
| Educational Attainment | In Labor Force | Unemployed |
| Less than High School | 234 (57.9%) | 23 (5.6%) |
| High School Diploma | 1,445 (83.7%) | 180 (10.4%) |
| College / Associate Degree | 1,117 (85.6%) | 112 (8.6%) |
| Bachelor's Degree or higher | 453 (85.5%) | 32 (6.0%) |
| Total | 3,248 (81.9%) | 349 (8.8%) |
Employment Occupations by Sex in North Madison
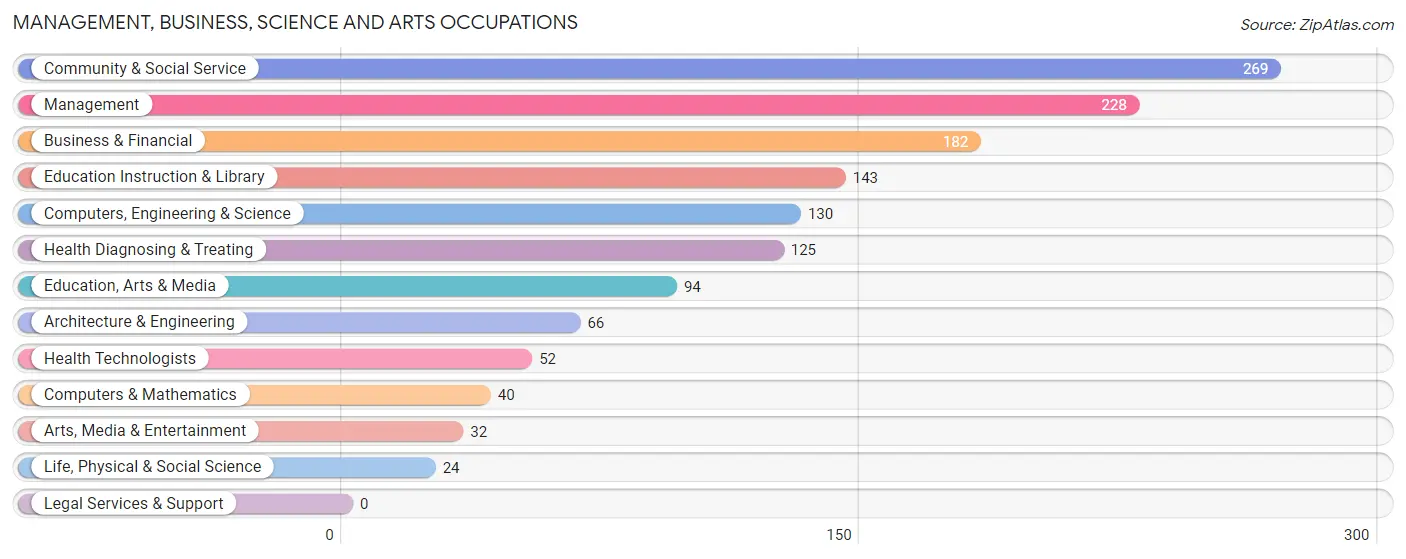
Management, Business, Science and Arts Occupations
The most common Management, Business, Science and Arts occupations in North Madison are Community & Social Service (269 | 6.6%), Management (228 | 5.6%), Business & Financial (182 | 4.4%), Education Instruction & Library (143 | 3.5%), and Computers, Engineering & Science (130 | 3.2%).
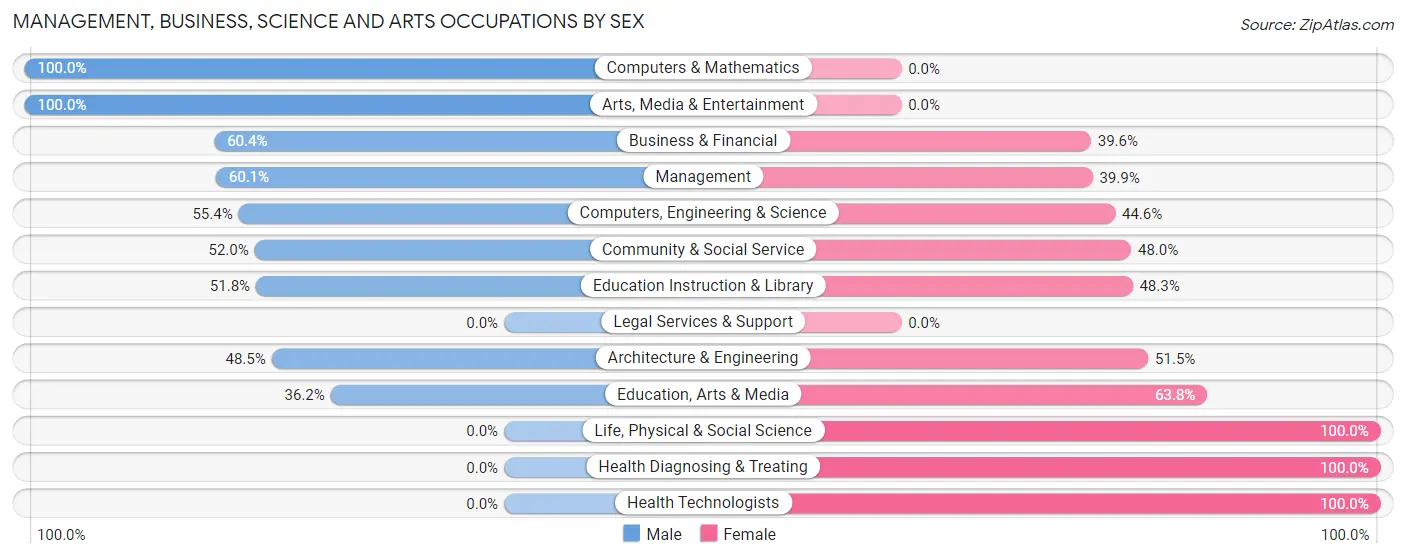
Management, Business, Science and Arts Occupations by Sex
Within the Management, Business, Science and Arts occupations in North Madison, the most male-oriented occupations are Computers & Mathematics (100.0%), Arts, Media & Entertainment (100.0%), and Business & Financial (60.4%), while the most female-oriented occupations are Life, Physical & Social Science (100.0%), Health Diagnosing & Treating (100.0%), and Health Technologists (100.0%).
| Occupation | Male | Female |
| Management | 137 (60.1%) | 91 (39.9%) |
| Business & Financial | 110 (60.4%) | 72 (39.6%) |
| Computers, Engineering & Science | 72 (55.4%) | 58 (44.6%) |
| Computers & Mathematics | 40 (100.0%) | 0 (0.0%) |
| Architecture & Engineering | 32 (48.5%) | 34 (51.5%) |
| Life, Physical & Social Science | 0 (0.0%) | 24 (100.0%) |
| Community & Social Service | 140 (52.0%) | 129 (48.0%) |
| Education, Arts & Media | 34 (36.2%) | 60 (63.8%) |
| Legal Services & Support | 0 (0.0%) | 0 (0.0%) |
| Education Instruction & Library | 74 (51.7%) | 69 (48.2%) |
| Arts, Media & Entertainment | 32 (100.0%) | 0 (0.0%) |
| Health Diagnosing & Treating | 0 (0.0%) | 125 (100.0%) |
| Health Technologists | 0 (0.0%) | 52 (100.0%) |
| Total (Category) | 459 (49.1%) | 475 (50.9%) |
| Total (Overall) | 2,049 (50.0%) | 2,045 (49.9%) |
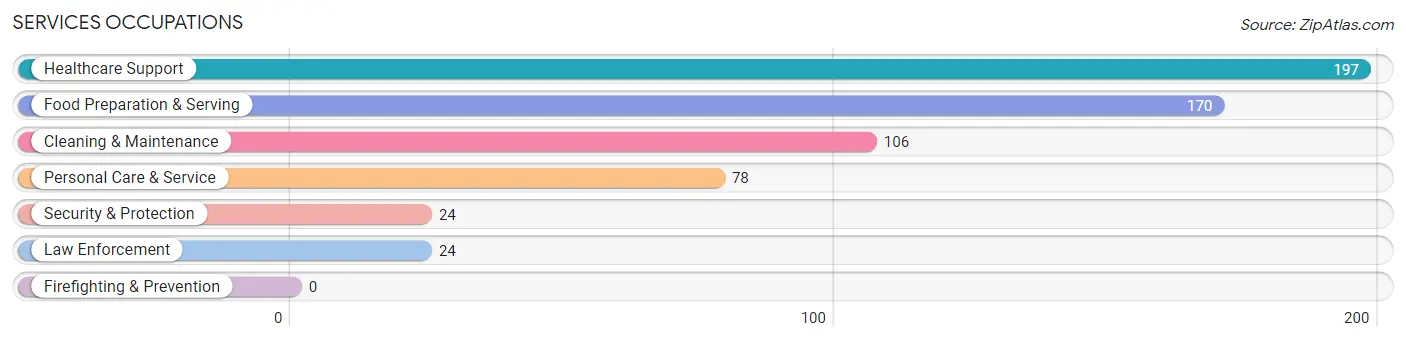
Services Occupations
The most common Services occupations in North Madison are Healthcare Support (197 | 4.8%), Food Preparation & Serving (170 | 4.2%), Cleaning & Maintenance (106 | 2.6%), Personal Care & Service (78 | 1.9%), and Security & Protection (24 | 0.6%).
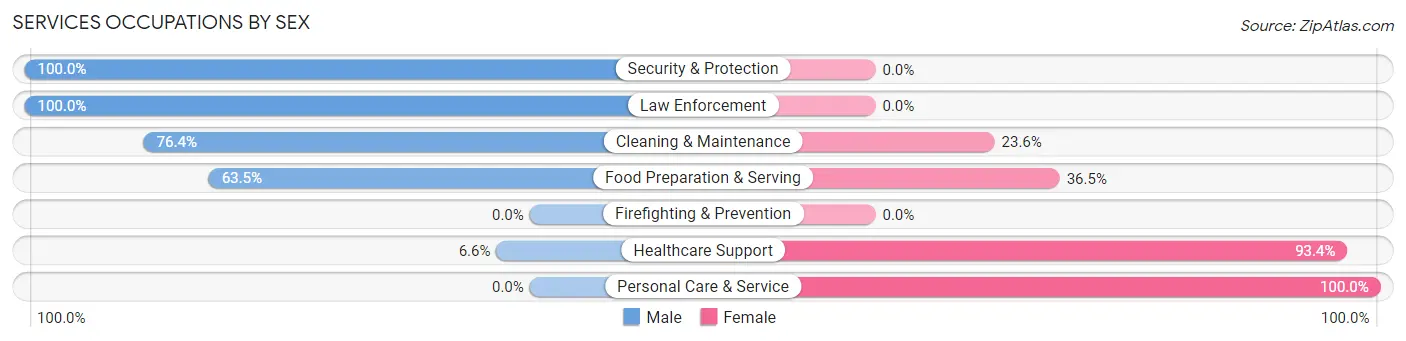
Services Occupations by Sex
Within the Services occupations in North Madison, the most male-oriented occupations are Security & Protection (100.0%), Law Enforcement (100.0%), and Cleaning & Maintenance (76.4%), while the most female-oriented occupations are Personal Care & Service (100.0%), Healthcare Support (93.4%), and Food Preparation & Serving (36.5%).
| Occupation | Male | Female |
| Healthcare Support | 13 (6.6%) | 184 (93.4%) |
| Security & Protection | 24 (100.0%) | 0 (0.0%) |
| Firefighting & Prevention | 0 (0.0%) | 0 (0.0%) |
| Law Enforcement | 24 (100.0%) | 0 (0.0%) |
| Food Preparation & Serving | 108 (63.5%) | 62 (36.5%) |
| Cleaning & Maintenance | 81 (76.4%) | 25 (23.6%) |
| Personal Care & Service | 0 (0.0%) | 78 (100.0%) |
| Total (Category) | 226 (39.3%) | 349 (60.7%) |
| Total (Overall) | 2,049 (50.0%) | 2,045 (49.9%) |
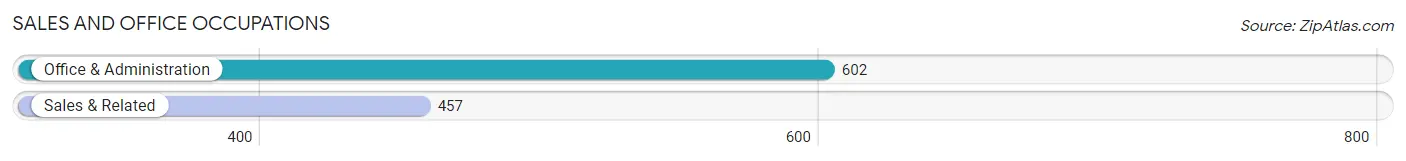
Sales and Office Occupations
The most common Sales and Office occupations in North Madison are Office & Administration (602 | 14.7%), and Sales & Related (457 | 11.2%).
Sales and Office Occupations by Sex
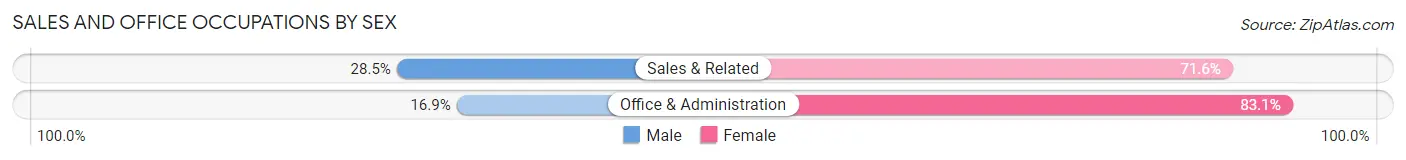
| Occupation | Male | Female |
| Sales & Related | 130 (28.4%) | 327 (71.6%) |
| Office & Administration | 102 (16.9%) | 500 (83.1%) |
| Total (Category) | 232 (21.9%) | 827 (78.1%) |
| Total (Overall) | 2,049 (50.0%) | 2,045 (49.9%) |
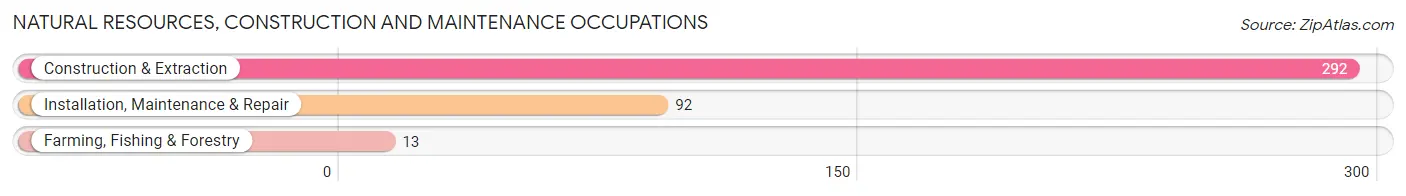
Natural Resources, Construction and Maintenance Occupations
The most common Natural Resources, Construction and Maintenance occupations in North Madison are Construction & Extraction (292 | 7.1%), Installation, Maintenance & Repair (92 | 2.2%), and Farming, Fishing & Forestry (13 | 0.3%).
Natural Resources, Construction and Maintenance Occupations by Sex
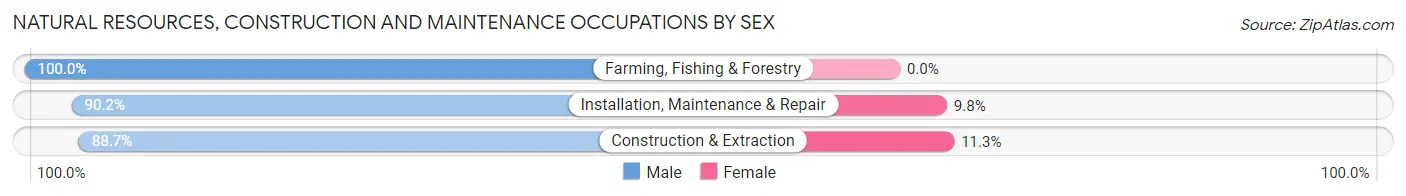
| Occupation | Male | Female |
| Farming, Fishing & Forestry | 13 (100.0%) | 0 (0.0%) |
| Construction & Extraction | 259 (88.7%) | 33 (11.3%) |
| Installation, Maintenance & Repair | 83 (90.2%) | 9 (9.8%) |
| Total (Category) | 355 (89.4%) | 42 (10.6%) |
| Total (Overall) | 2,049 (50.0%) | 2,045 (49.9%) |
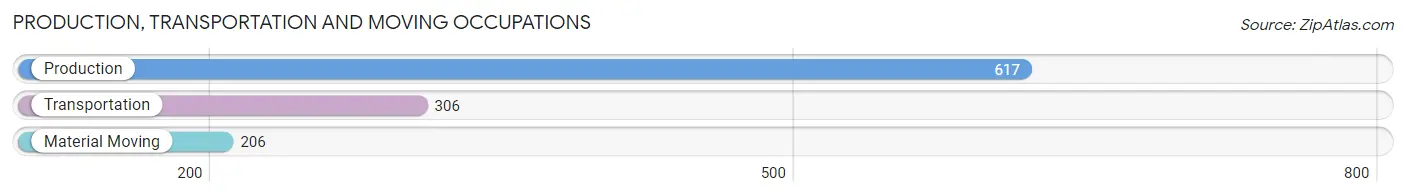
Production, Transportation and Moving Occupations
The most common Production, Transportation and Moving occupations in North Madison are Production (617 | 15.1%), Transportation (306 | 7.5%), and Material Moving (206 | 5.0%).
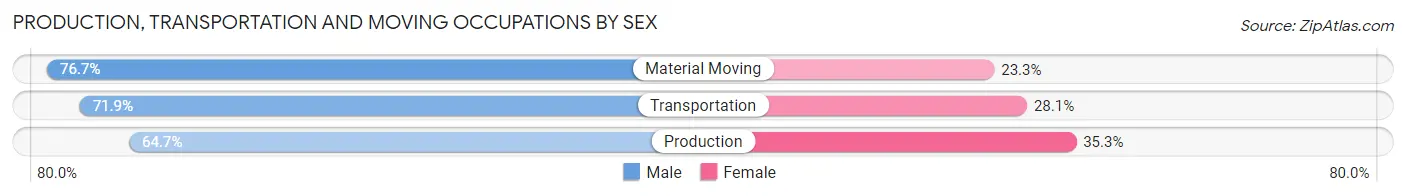
Production, Transportation and Moving Occupations by Sex
| Occupation | Male | Female |
| Production | 399 (64.7%) | 218 (35.3%) |
| Transportation | 220 (71.9%) | 86 (28.1%) |
| Material Moving | 158 (76.7%) | 48 (23.3%) |
| Total (Category) | 777 (68.8%) | 352 (31.2%) |
| Total (Overall) | 2,049 (50.0%) | 2,045 (49.9%) |
Employment Industries by Sex in North Madison
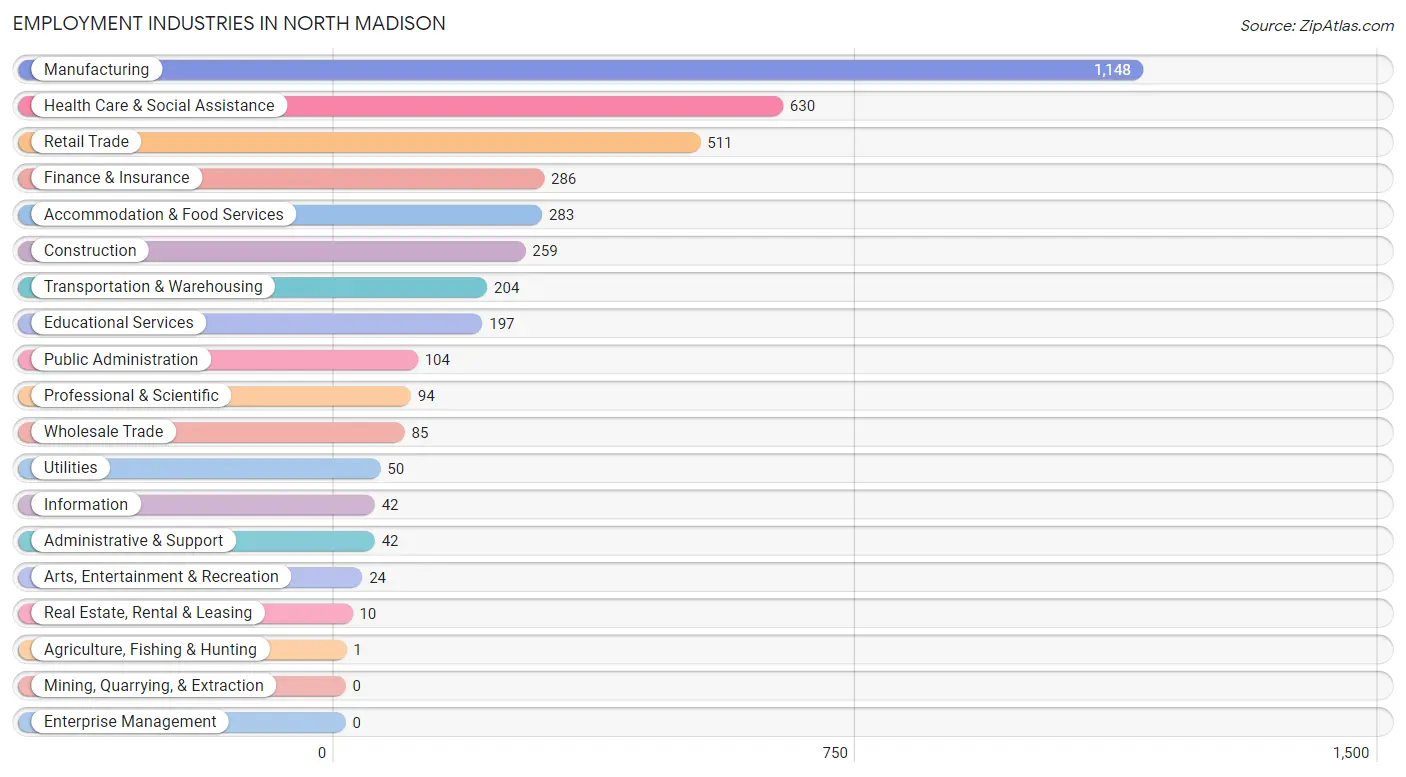
Employment Industries in North Madison
The major employment industries in North Madison include Manufacturing (1,148 | 28.0%), Health Care & Social Assistance (630 | 15.4%), Retail Trade (511 | 12.5%), Finance & Insurance (286 | 7.0%), and Accommodation & Food Services (283 | 6.9%).
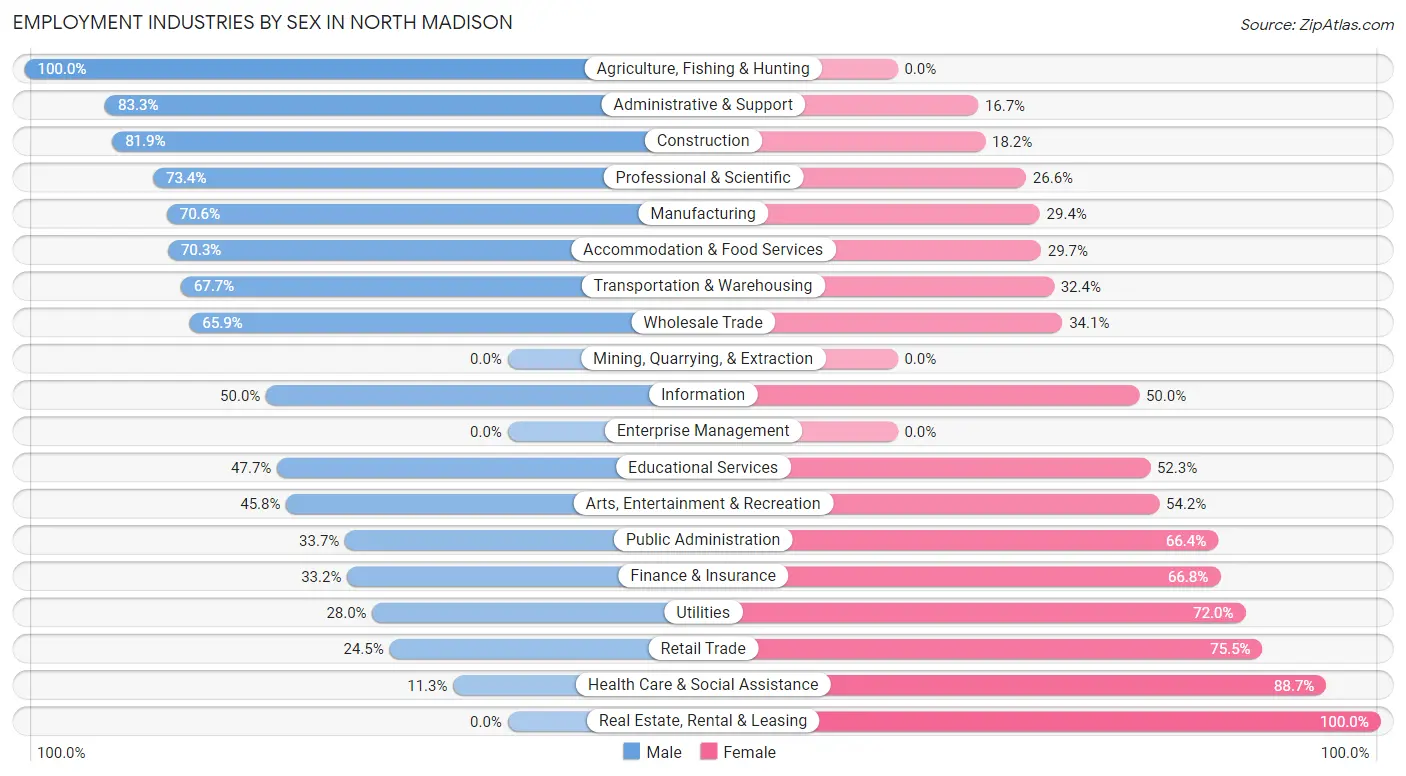
Employment Industries by Sex in North Madison
The North Madison industries that see more men than women are Agriculture, Fishing & Hunting (100.0%), Administrative & Support (83.3%), and Construction (81.9%), whereas the industries that tend to have a higher number of women are Real Estate, Rental & Leasing (100.0%), Health Care & Social Assistance (88.7%), and Retail Trade (75.5%).
| Industry | Male | Female |
| Agriculture, Fishing & Hunting | 1 (100.0%) | 0 (0.0%) |
| Mining, Quarrying, & Extraction | 0 (0.0%) | 0 (0.0%) |
| Construction | 212 (81.9%) | 47 (18.1%) |
| Manufacturing | 810 (70.6%) | 338 (29.4%) |
| Wholesale Trade | 56 (65.9%) | 29 (34.1%) |
| Retail Trade | 125 (24.5%) | 386 (75.5%) |
| Transportation & Warehousing | 138 (67.6%) | 66 (32.4%) |
| Utilities | 14 (28.0%) | 36 (72.0%) |
| Information | 21 (50.0%) | 21 (50.0%) |
| Finance & Insurance | 95 (33.2%) | 191 (66.8%) |
| Real Estate, Rental & Leasing | 0 (0.0%) | 10 (100.0%) |
| Professional & Scientific | 69 (73.4%) | 25 (26.6%) |
| Enterprise Management | 0 (0.0%) | 0 (0.0%) |
| Administrative & Support | 35 (83.3%) | 7 (16.7%) |
| Educational Services | 94 (47.7%) | 103 (52.3%) |
| Health Care & Social Assistance | 71 (11.3%) | 559 (88.7%) |
| Arts, Entertainment & Recreation | 11 (45.8%) | 13 (54.2%) |
| Accommodation & Food Services | 199 (70.3%) | 84 (29.7%) |
| Public Administration | 35 (33.7%) | 69 (66.3%) |
| Total | 2,049 (50.0%) | 2,045 (49.9%) |
Education in North Madison
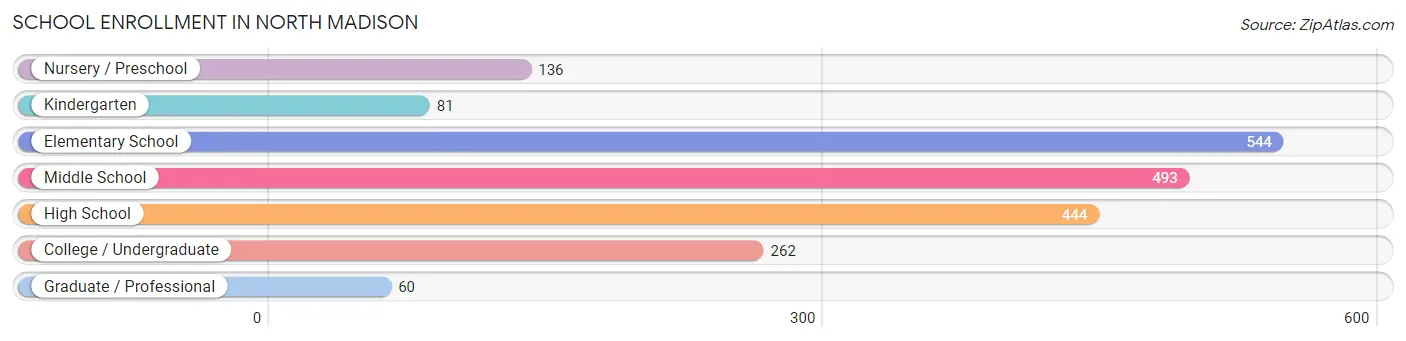
School Enrollment in North Madison
The most common levels of schooling among the 2,020 students in North Madison are elementary school (544 | 26.9%), middle school (493 | 24.4%), and high school (444 | 22.0%).
| School Level | # Students | % Students |
| Nursery / Preschool | 136 | 6.7% |
| Kindergarten | 81 | 4.0% |
| Elementary School | 544 | 26.9% |
| Middle School | 493 | 24.4% |
| High School | 444 | 22.0% |
| College / Undergraduate | 262 | 13.0% |
| Graduate / Professional | 60 | 3.0% |
| Total | 2,020 | 100.0% |
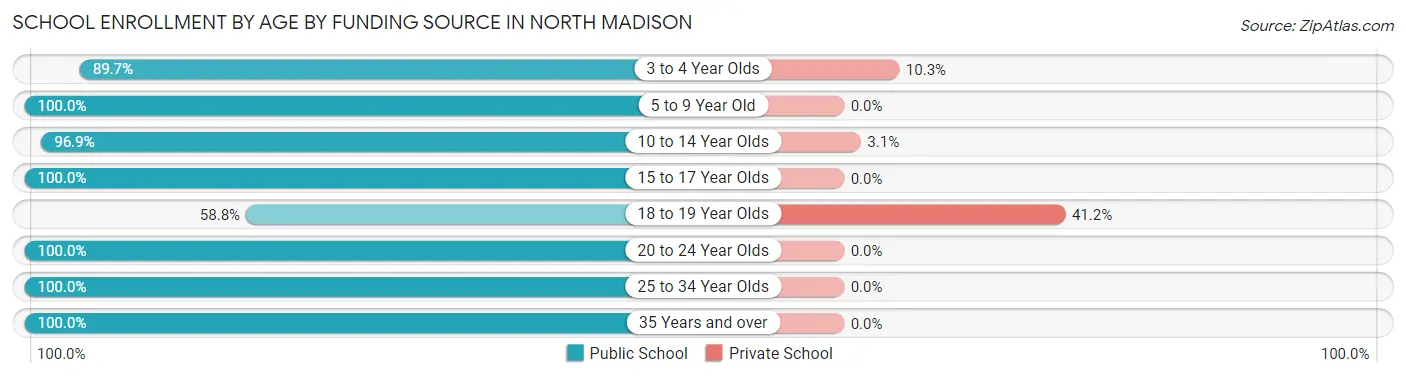
School Enrollment by Age by Funding Source in North Madison
Out of a total of 2,020 students who are enrolled in schools in North Madison, 93 (4.6%) attend a private institution, while the remaining 1,927 (95.4%) are enrolled in public schools. The age group of 18 to 19 year olds has the highest likelihood of being enrolled in private schools, with 61 (41.2% in the age bracket) enrolled. Conversely, the age group of 5 to 9 year old has the lowest likelihood of being enrolled in a private school, with 585 (100.0% in the age bracket) attending a public institution.
| Age Bracket | Public School | Private School |
| 3 to 4 Year Olds | 122 (89.7%) | 14 (10.3%) |
| 5 to 9 Year Old | 585 (100.0%) | 0 (0.0%) |
| 10 to 14 Year Olds | 559 (96.9%) | 18 (3.1%) |
| 15 to 17 Year Olds | 274 (100.0%) | 0 (0.0%) |
| 18 to 19 Year Olds | 87 (58.8%) | 61 (41.2%) |
| 20 to 24 Year Olds | 187 (100.0%) | 0 (0.0%) |
| 25 to 34 Year Olds | 69 (100.0%) | 0 (0.0%) |
| 35 Years and over | 44 (100.0%) | 0 (0.0%) |
| Total | 1,927 (95.4%) | 93 (4.6%) |
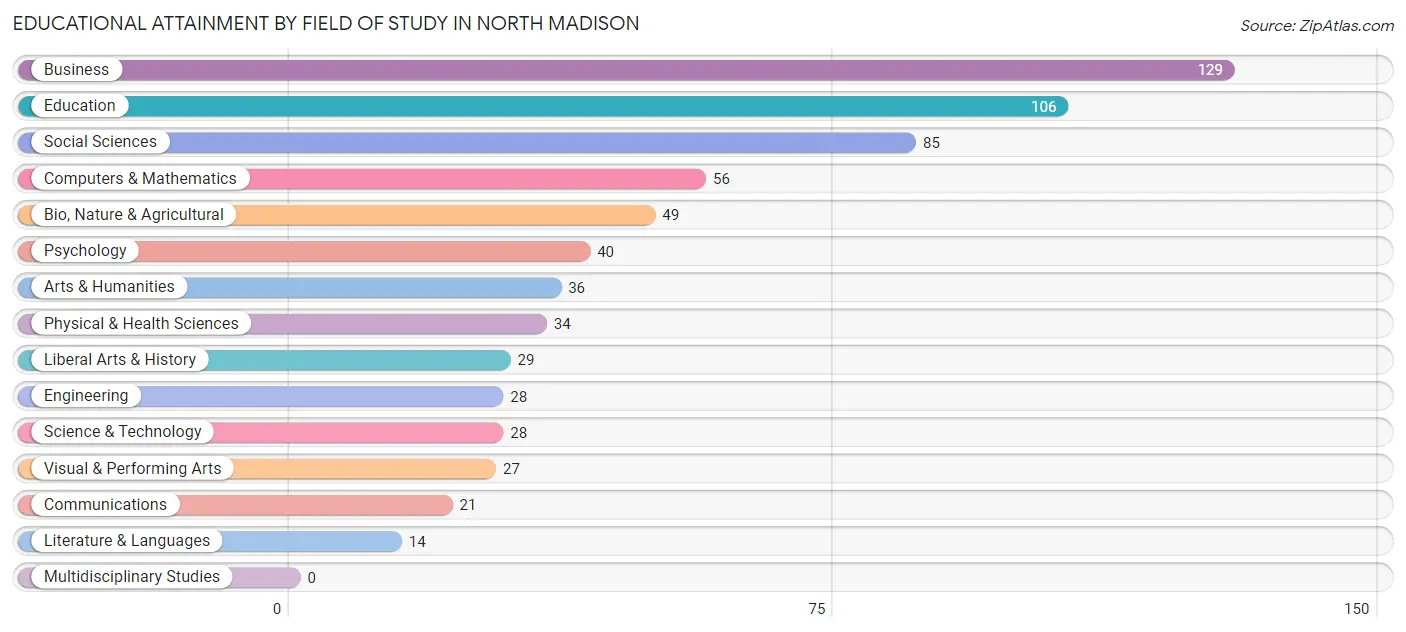
Educational Attainment by Field of Study in North Madison
Business (129 | 18.9%), education (106 | 15.5%), social sciences (85 | 12.5%), computers & mathematics (56 | 8.2%), and bio, nature & agricultural (49 | 7.2%) are the most common fields of study among 682 individuals in North Madison who have obtained a bachelor's degree or higher.
| Field of Study | # Graduates | % Graduates |
| Computers & Mathematics | 56 | 8.2% |
| Bio, Nature & Agricultural | 49 | 7.2% |
| Physical & Health Sciences | 34 | 5.0% |
| Psychology | 40 | 5.9% |
| Social Sciences | 85 | 12.5% |
| Engineering | 28 | 4.1% |
| Multidisciplinary Studies | 0 | 0.0% |
| Science & Technology | 28 | 4.1% |
| Business | 129 | 18.9% |
| Education | 106 | 15.5% |
| Literature & Languages | 14 | 2.1% |
| Liberal Arts & History | 29 | 4.3% |
| Visual & Performing Arts | 27 | 4.0% |
| Communications | 21 | 3.1% |
| Arts & Humanities | 36 | 5.3% |
| Total | 682 | 100.0% |
Transportation & Commute in North Madison
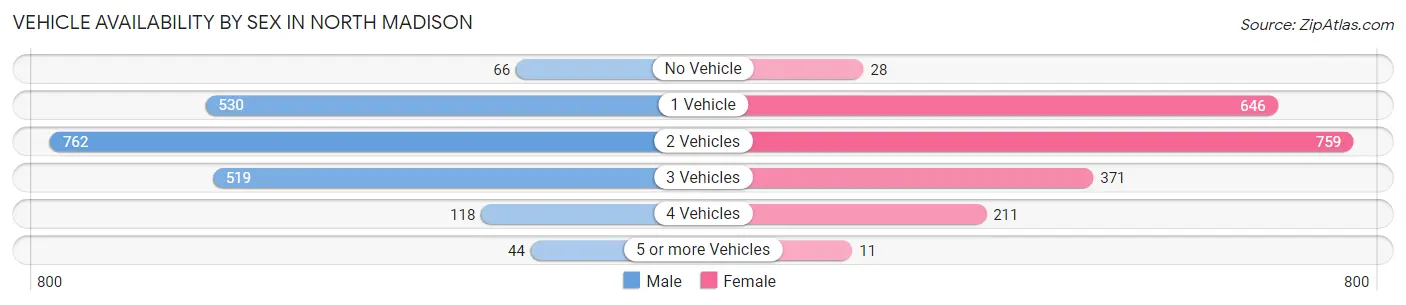
Vehicle Availability by Sex in North Madison
The most prevalent vehicle ownership categories in North Madison are males with 2 vehicles (762, accounting for 37.4%) and females with 2 vehicles (759, making up 37.6%).
| Vehicles Available | Male | Female |
| No Vehicle | 66 (3.2%) | 28 (1.4%) |
| 1 Vehicle | 530 (26.0%) | 646 (31.9%) |
| 2 Vehicles | 762 (37.4%) | 759 (37.5%) |
| 3 Vehicles | 519 (25.5%) | 371 (18.3%) |
| 4 Vehicles | 118 (5.8%) | 211 (10.4%) |
| 5 or more Vehicles | 44 (2.2%) | 11 (0.5%) |
| Total | 2,039 (100.0%) | 2,026 (100.0%) |
Commute Time in North Madison
The most frequently occuring commute durations in North Madison are 30 to 34 minutes (1,004 commuters, 26.6%), 15 to 19 minutes (403 commuters, 10.7%), and 10 to 14 minutes (371 commuters, 9.8%).
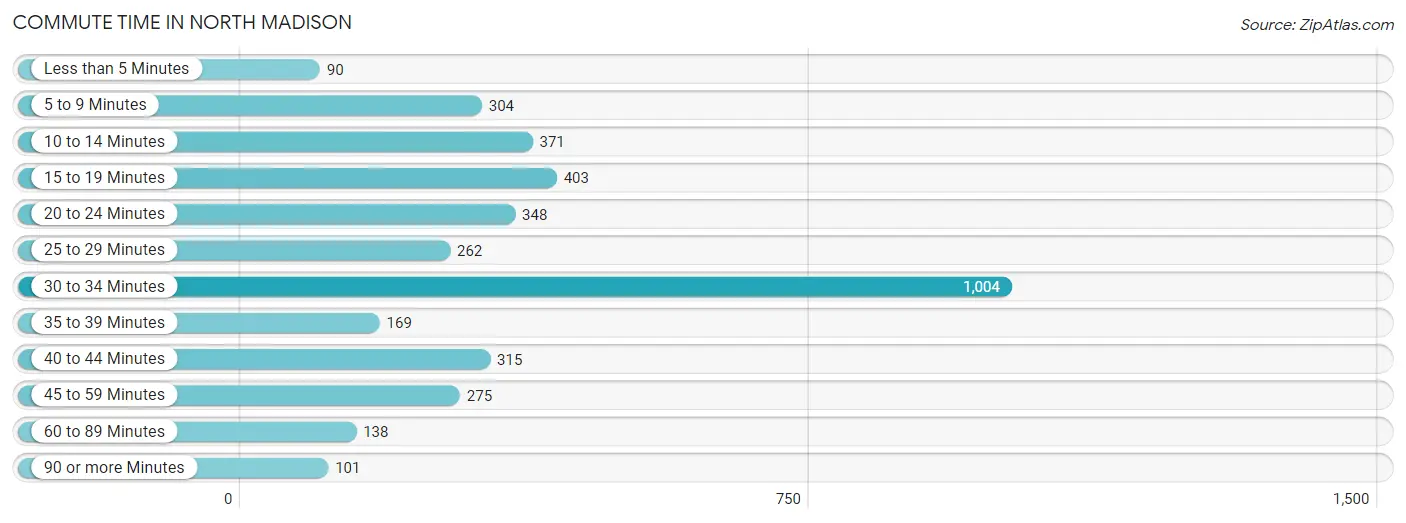
| Commute Time | # Commuters | % Commuters |
| Less than 5 Minutes | 90 | 2.4% |
| 5 to 9 Minutes | 304 | 8.0% |
| 10 to 14 Minutes | 371 | 9.8% |
| 15 to 19 Minutes | 403 | 10.7% |
| 20 to 24 Minutes | 348 | 9.2% |
| 25 to 29 Minutes | 262 | 6.9% |
| 30 to 34 Minutes | 1,004 | 26.6% |
| 35 to 39 Minutes | 169 | 4.5% |
| 40 to 44 Minutes | 315 | 8.3% |
| 45 to 59 Minutes | 275 | 7.3% |
| 60 to 89 Minutes | 138 | 3.6% |
| 90 or more Minutes | 101 | 2.7% |
Commute Time by Sex in North Madison
The most common commute times in North Madison are 30 to 34 minutes (512 commuters, 26.5%) for males and 30 to 34 minutes (492 commuters, 26.7%) for females.
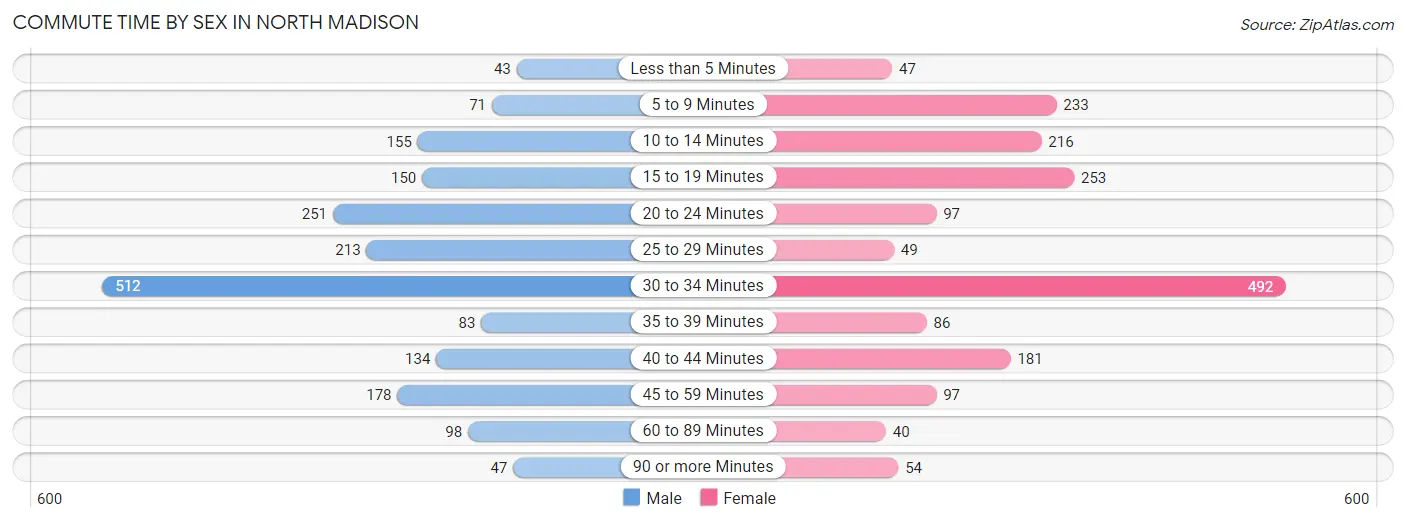
| Commute Time | Male | Female |
| Less than 5 Minutes | 43 (2.2%) | 47 (2.5%) |
| 5 to 9 Minutes | 71 (3.7%) | 233 (12.6%) |
| 10 to 14 Minutes | 155 (8.0%) | 216 (11.7%) |
| 15 to 19 Minutes | 150 (7.7%) | 253 (13.7%) |
| 20 to 24 Minutes | 251 (13.0%) | 97 (5.3%) |
| 25 to 29 Minutes | 213 (11.0%) | 49 (2.7%) |
| 30 to 34 Minutes | 512 (26.5%) | 492 (26.7%) |
| 35 to 39 Minutes | 83 (4.3%) | 86 (4.7%) |
| 40 to 44 Minutes | 134 (6.9%) | 181 (9.8%) |
| 45 to 59 Minutes | 178 (9.2%) | 97 (5.3%) |
| 60 to 89 Minutes | 98 (5.1%) | 40 (2.2%) |
| 90 or more Minutes | 47 (2.4%) | 54 (2.9%) |
Time of Departure to Work by Sex in North Madison
The most frequent times of departure to work in North Madison are 7:30 AM to 7:59 AM (256, 13.2%) for males and 8:00 AM to 8:29 AM (315, 17.1%) for females.
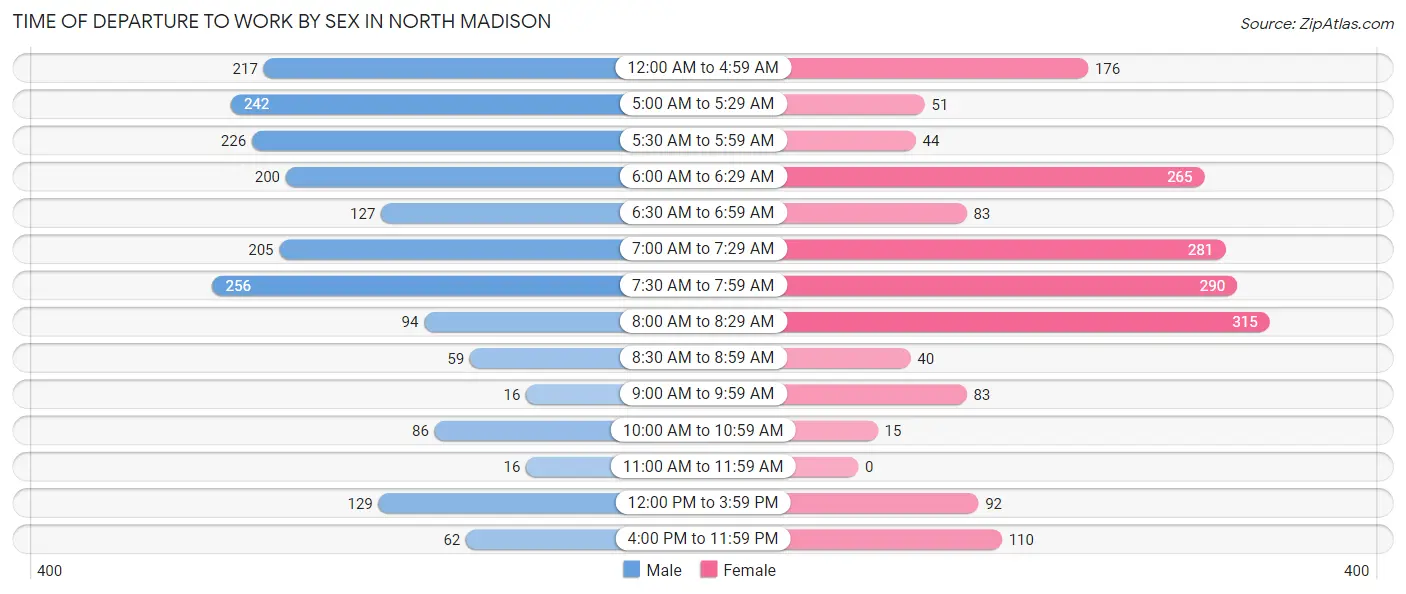
| Time of Departure | Male | Female |
| 12:00 AM to 4:59 AM | 217 (11.2%) | 176 (9.5%) |
| 5:00 AM to 5:29 AM | 242 (12.5%) | 51 (2.8%) |
| 5:30 AM to 5:59 AM | 226 (11.7%) | 44 (2.4%) |
| 6:00 AM to 6:29 AM | 200 (10.3%) | 265 (14.4%) |
| 6:30 AM to 6:59 AM | 127 (6.6%) | 83 (4.5%) |
| 7:00 AM to 7:29 AM | 205 (10.6%) | 281 (15.2%) |
| 7:30 AM to 7:59 AM | 256 (13.2%) | 290 (15.7%) |
| 8:00 AM to 8:29 AM | 94 (4.9%) | 315 (17.1%) |
| 8:30 AM to 8:59 AM | 59 (3.0%) | 40 (2.2%) |
| 9:00 AM to 9:59 AM | 16 (0.8%) | 83 (4.5%) |
| 10:00 AM to 10:59 AM | 86 (4.4%) | 15 (0.8%) |
| 11:00 AM to 11:59 AM | 16 (0.8%) | 0 (0.0%) |
| 12:00 PM to 3:59 PM | 129 (6.7%) | 92 (5.0%) |
| 4:00 PM to 11:59 PM | 62 (3.2%) | 110 (6.0%) |
| Total | 1,935 (100.0%) | 1,845 (100.0%) |
Housing Occupancy in North Madison
Occupancy by Ownership in North Madison
Of the total 3,429 dwellings in North Madison, owner-occupied units account for 2,657 (77.5%), while renter-occupied units make up 772 (22.5%).
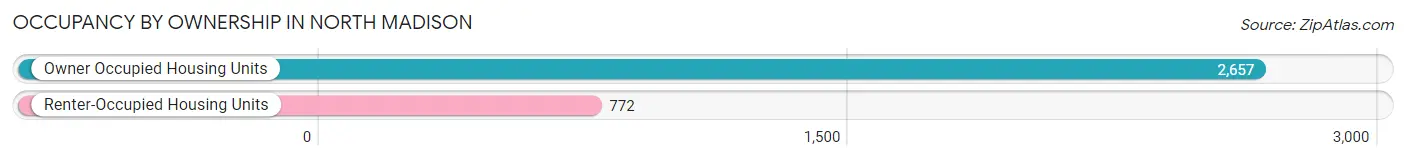
| Occupancy | # Housing Units | % Housing Units |
| Owner Occupied Housing Units | 2,657 | 77.5% |
| Renter-Occupied Housing Units | 772 | 22.5% |
| Total Occupied Housing Units | 3,429 | 100.0% |
Occupancy by Household Size in North Madison
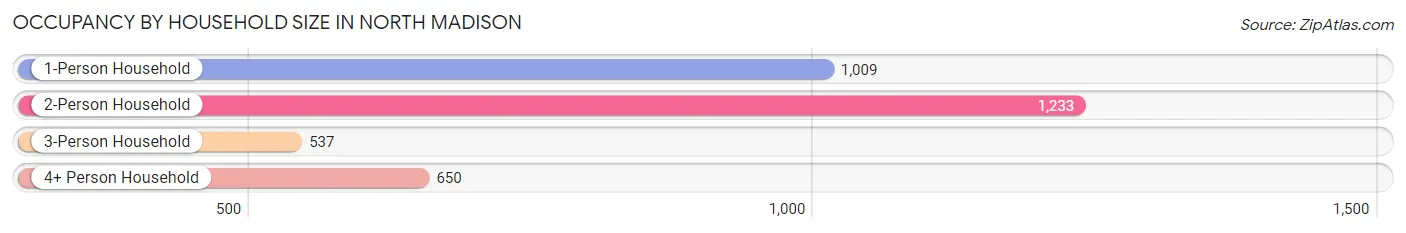
| Household Size | # Housing Units | % Housing Units |
| 1-Person Household | 1,009 | 29.4% |
| 2-Person Household | 1,233 | 36.0% |
| 3-Person Household | 537 | 15.7% |
| 4+ Person Household | 650 | 19.0% |
| Total Housing Units | 3,429 | 100.0% |
Occupancy by Ownership by Household Size in North Madison
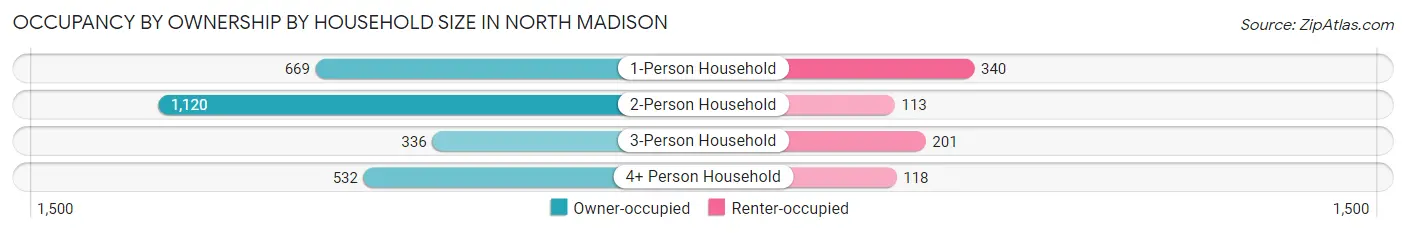
| Household Size | Owner-occupied | Renter-occupied |
| 1-Person Household | 669 (66.3%) | 340 (33.7%) |
| 2-Person Household | 1,120 (90.8%) | 113 (9.2%) |
| 3-Person Household | 336 (62.6%) | 201 (37.4%) |
| 4+ Person Household | 532 (81.9%) | 118 (18.1%) |
| Total Housing Units | 2,657 (77.5%) | 772 (22.5%) |
Occupancy by Educational Attainment in North Madison
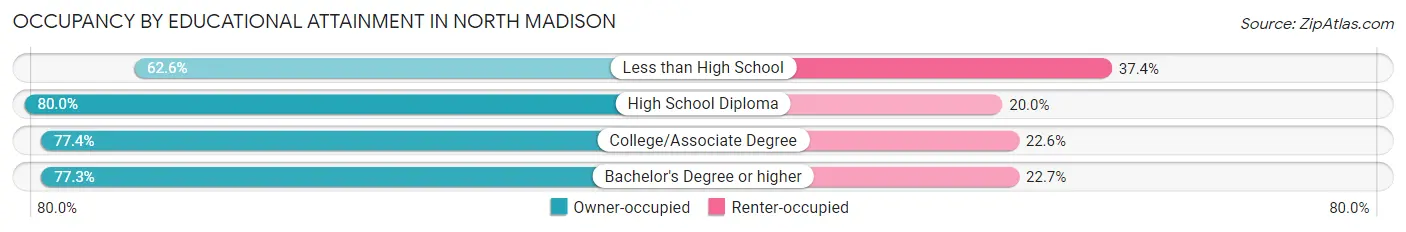
| Household Size | Owner-occupied | Renter-occupied |
| Less than High School | 129 (62.6%) | 77 (37.4%) |
| High School Diploma | 1,048 (80.0%) | 262 (20.0%) |
| College/Associate Degree | 1,115 (77.4%) | 326 (22.6%) |
| Bachelor's Degree or higher | 365 (77.3%) | 107 (22.7%) |
Occupancy by Age of Householder in North Madison
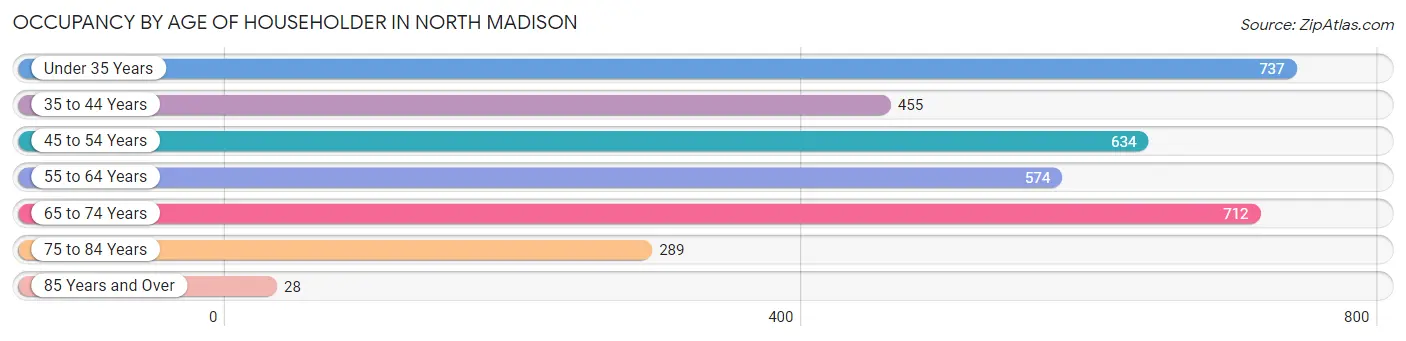
| Age Bracket | # Households | % Households |
| Under 35 Years | 737 | 21.5% |
| 35 to 44 Years | 455 | 13.3% |
| 45 to 54 Years | 634 | 18.5% |
| 55 to 64 Years | 574 | 16.7% |
| 65 to 74 Years | 712 | 20.8% |
| 75 to 84 Years | 289 | 8.4% |
| 85 Years and Over | 28 | 0.8% |
| Total | 3,429 | 100.0% |
Housing Finances in North Madison
Median Income by Occupancy in North Madison
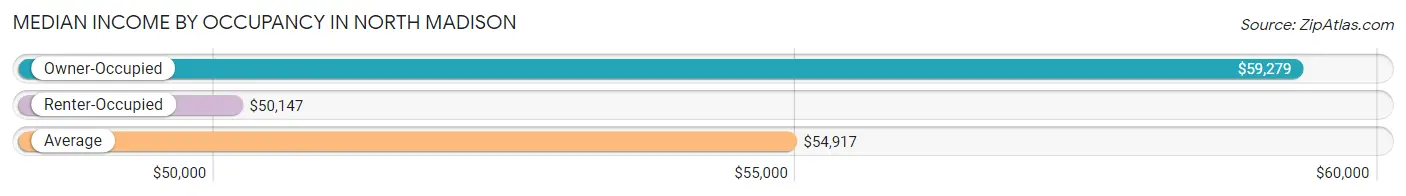
| Occupancy Type | # Households | Median Income |
| Owner-Occupied | 2,657 (77.5%) | $59,279 |
| Renter-Occupied | 772 (22.5%) | $50,147 |
| Average | 3,429 (100.0%) | $54,917 |
Occupancy by Householder Income Bracket in North Madison
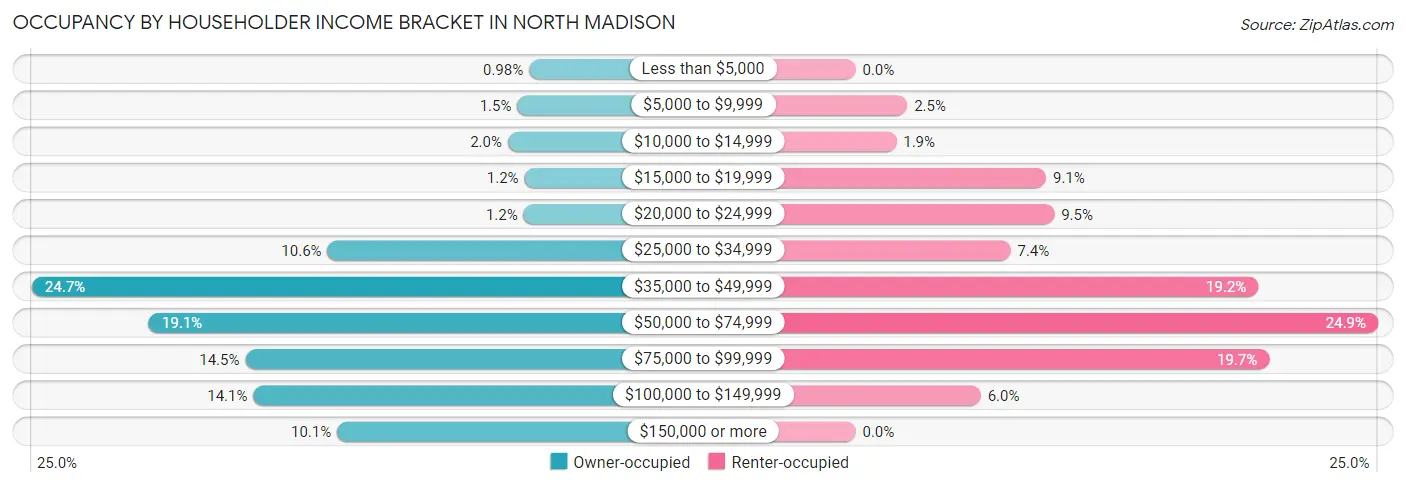
| Income Bracket | Owner-occupied | Renter-occupied |
| Less than $5,000 | 26 (1.0%) | 0 (0.0%) |
| $5,000 to $9,999 | 41 (1.5%) | 19 (2.5%) |
| $10,000 to $14,999 | 53 (2.0%) | 15 (1.9%) |
| $15,000 to $19,999 | 32 (1.2%) | 70 (9.1%) |
| $20,000 to $24,999 | 33 (1.2%) | 73 (9.5%) |
| $25,000 to $34,999 | 281 (10.6%) | 57 (7.4%) |
| $35,000 to $49,999 | 655 (24.6%) | 148 (19.2%) |
| $50,000 to $74,999 | 507 (19.1%) | 192 (24.9%) |
| $75,000 to $99,999 | 385 (14.5%) | 152 (19.7%) |
| $100,000 to $149,999 | 375 (14.1%) | 46 (6.0%) |
| $150,000 or more | 269 (10.1%) | 0 (0.0%) |
| Total | 2,657 (100.0%) | 772 (100.0%) |
Monthly Housing Cost Tiers in North Madison
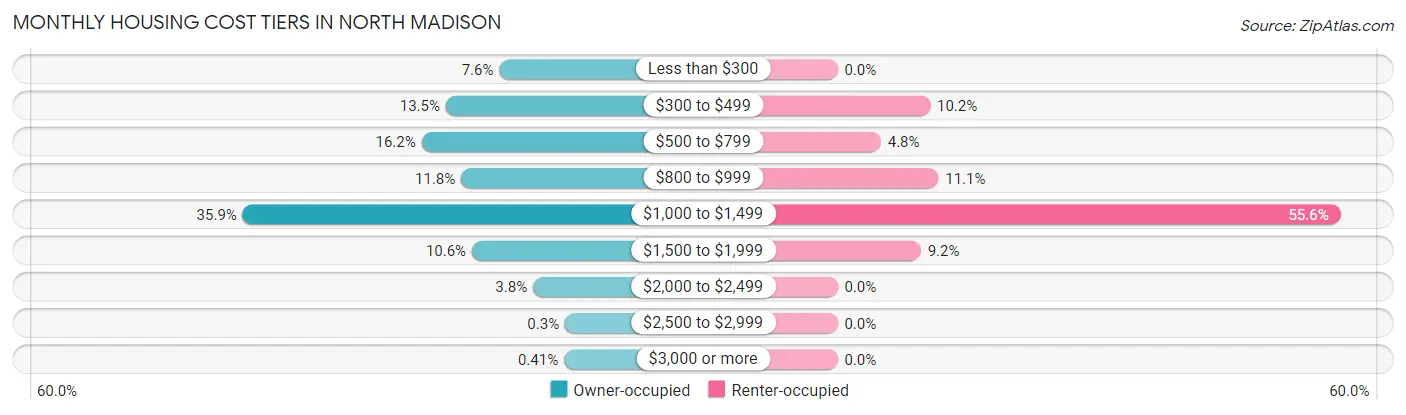
| Monthly Cost | Owner-occupied | Renter-occupied |
| Less than $300 | 201 (7.6%) | 0 (0.0%) |
| $300 to $499 | 358 (13.5%) | 79 (10.2%) |
| $500 to $799 | 429 (16.2%) | 37 (4.8%) |
| $800 to $999 | 313 (11.8%) | 86 (11.1%) |
| $1,000 to $1,499 | 954 (35.9%) | 429 (55.6%) |
| $1,500 to $1,999 | 281 (10.6%) | 71 (9.2%) |
| $2,000 to $2,499 | 102 (3.8%) | 0 (0.0%) |
| $2,500 to $2,999 | 8 (0.3%) | 0 (0.0%) |
| $3,000 or more | 11 (0.4%) | 0 (0.0%) |
| Total | 2,657 (100.0%) | 772 (100.0%) |
Physical Housing Characteristics in North Madison
Housing Structures in North Madison
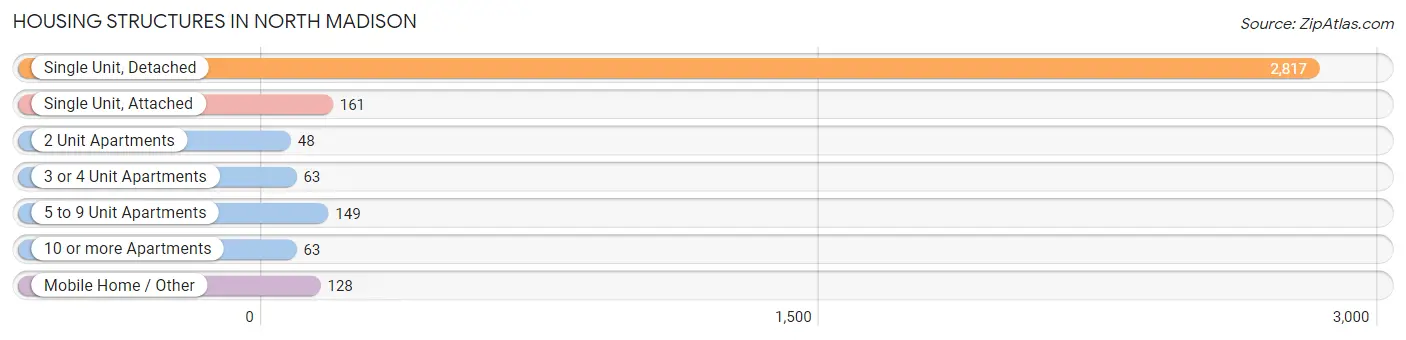
| Structure Type | # Housing Units | % Housing Units |
| Single Unit, Detached | 2,817 | 82.2% |
| Single Unit, Attached | 161 | 4.7% |
| 2 Unit Apartments | 48 | 1.4% |
| 3 or 4 Unit Apartments | 63 | 1.8% |
| 5 to 9 Unit Apartments | 149 | 4.3% |
| 10 or more Apartments | 63 | 1.8% |
| Mobile Home / Other | 128 | 3.7% |
| Total | 3,429 | 100.0% |
Housing Structures by Occupancy in North Madison
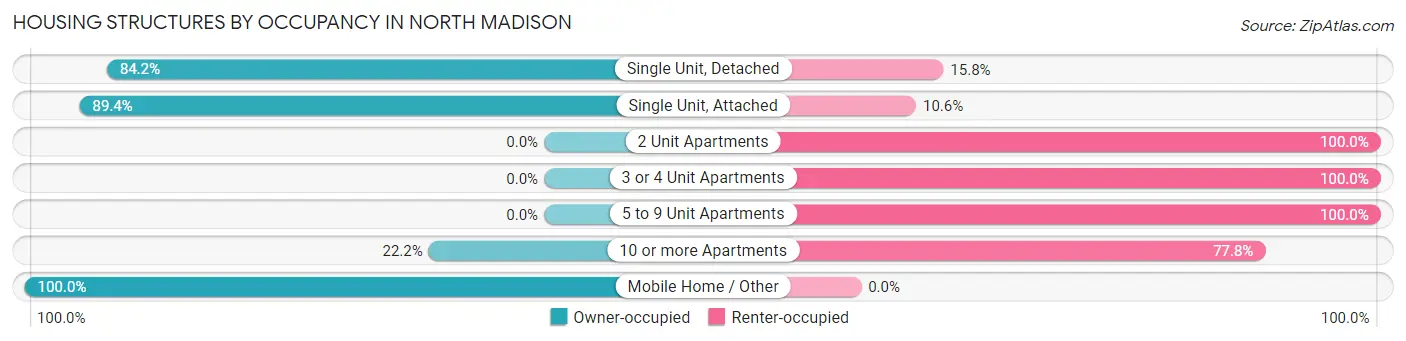
| Structure Type | Owner-occupied | Renter-occupied |
| Single Unit, Detached | 2,371 (84.2%) | 446 (15.8%) |
| Single Unit, Attached | 144 (89.4%) | 17 (10.6%) |
| 2 Unit Apartments | 0 (0.0%) | 48 (100.0%) |
| 3 or 4 Unit Apartments | 0 (0.0%) | 63 (100.0%) |
| 5 to 9 Unit Apartments | 0 (0.0%) | 149 (100.0%) |
| 10 or more Apartments | 14 (22.2%) | 49 (77.8%) |
| Mobile Home / Other | 128 (100.0%) | 0 (0.0%) |
| Total | 2,657 (77.5%) | 772 (22.5%) |
Housing Structures by Number of Rooms in North Madison
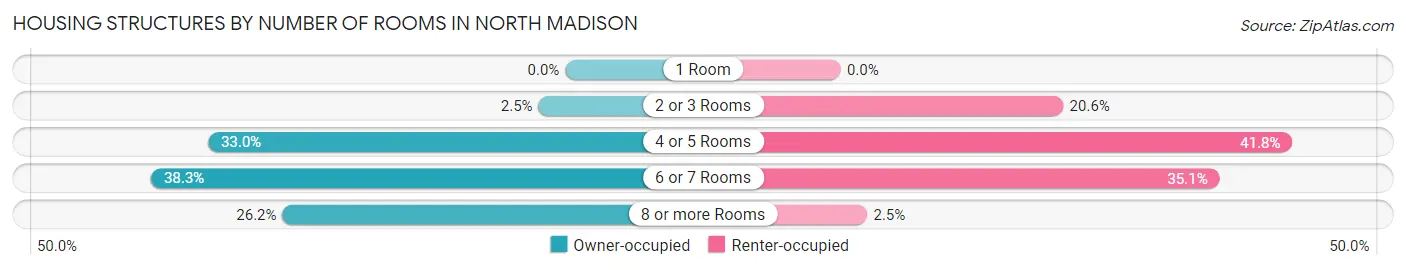
| Number of Rooms | Owner-occupied | Renter-occupied |
| 1 Room | 0 (0.0%) | 0 (0.0%) |
| 2 or 3 Rooms | 66 (2.5%) | 159 (20.6%) |
| 4 or 5 Rooms | 878 (33.0%) | 323 (41.8%) |
| 6 or 7 Rooms | 1,018 (38.3%) | 271 (35.1%) |
| 8 or more Rooms | 695 (26.2%) | 19 (2.5%) |
| Total | 2,657 (100.0%) | 772 (100.0%) |
Housing Structure by Heating Type in North Madison
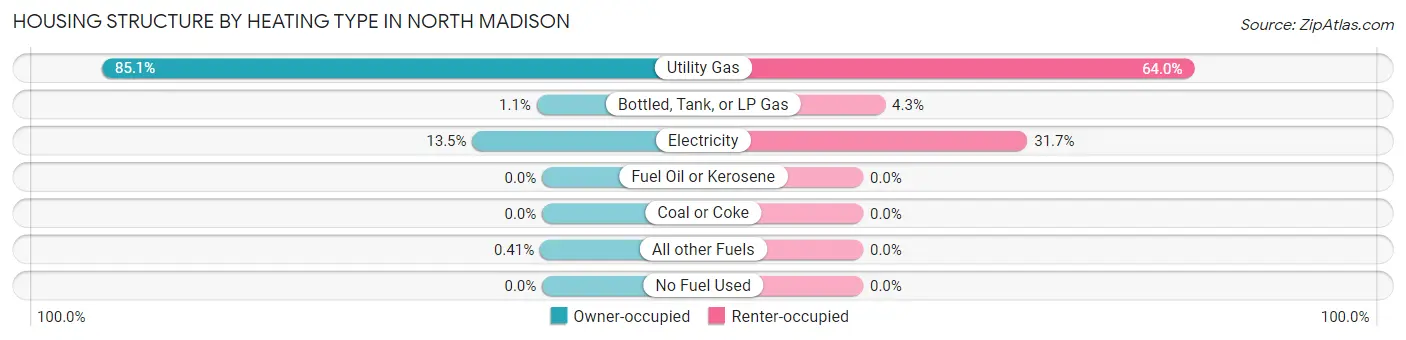
| Heating Type | Owner-occupied | Renter-occupied |
| Utility Gas | 2,260 (85.1%) | 494 (64.0%) |
| Bottled, Tank, or LP Gas | 28 (1.1%) | 33 (4.3%) |
| Electricity | 358 (13.5%) | 245 (31.7%) |
| Fuel Oil or Kerosene | 0 (0.0%) | 0 (0.0%) |
| Coal or Coke | 0 (0.0%) | 0 (0.0%) |
| All other Fuels | 11 (0.4%) | 0 (0.0%) |
| No Fuel Used | 0 (0.0%) | 0 (0.0%) |
| Total | 2,657 (100.0%) | 772 (100.0%) |
Household Vehicle Usage in North Madison
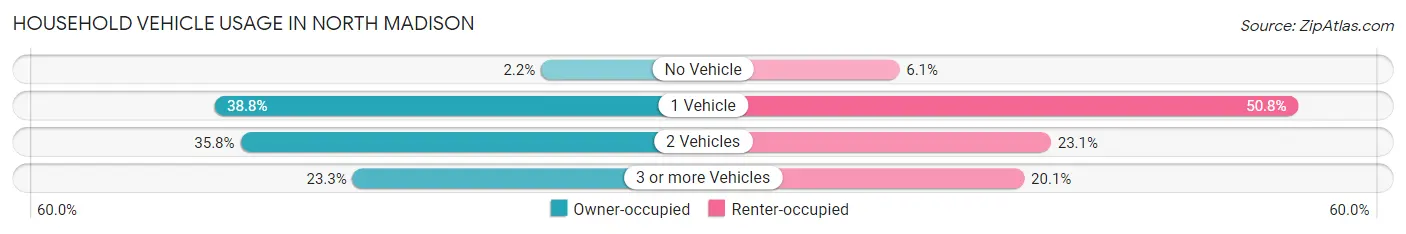
| Vehicles per Household | Owner-occupied | Renter-occupied |
| No Vehicle | 57 (2.1%) | 47 (6.1%) |
| 1 Vehicle | 1,030 (38.8%) | 392 (50.8%) |
| 2 Vehicles | 952 (35.8%) | 178 (23.1%) |
| 3 or more Vehicles | 618 (23.3%) | 155 (20.1%) |
| Total | 2,657 (100.0%) | 772 (100.0%) |
Real Estate & Mortgages in North Madison
Real Estate and Mortgage Overview in North Madison
| Characteristic | Without Mortgage | With Mortgage |
| Housing Units | 968 | 1,689 |
| Median Property Value | $127,400 | $152,600 |
| Median Household Income | $47,180 | $226 |
| Monthly Housing Costs | $472 | $0 |
| Real Estate Taxes | $2,303 | $0 |
Property Value by Mortgage Status in North Madison
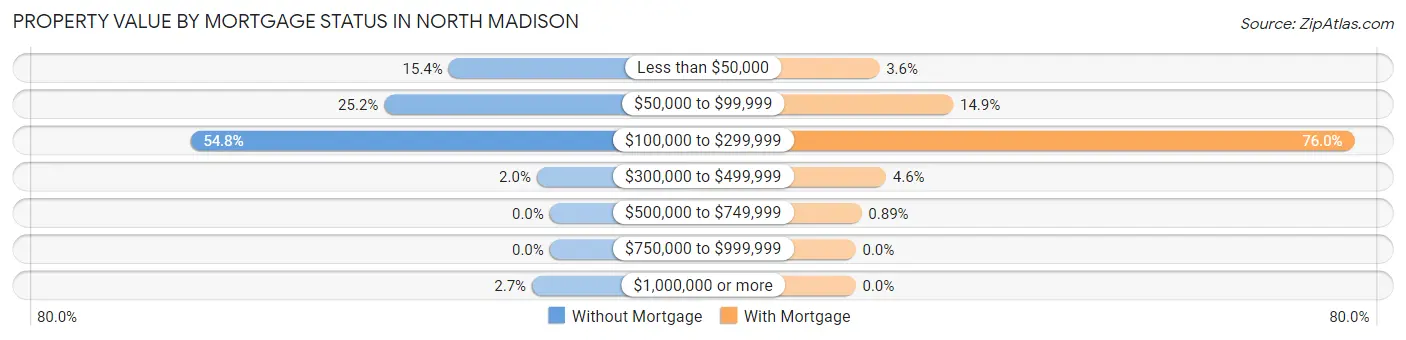
| Property Value | Without Mortgage | With Mortgage |
| Less than $50,000 | 149 (15.4%) | 61 (3.6%) |
| $50,000 to $99,999 | 244 (25.2%) | 251 (14.9%) |
| $100,000 to $299,999 | 530 (54.7%) | 1,284 (76.0%) |
| $300,000 to $499,999 | 19 (2.0%) | 78 (4.6%) |
| $500,000 to $749,999 | 0 (0.0%) | 15 (0.9%) |
| $750,000 to $999,999 | 0 (0.0%) | 0 (0.0%) |
| $1,000,000 or more | 26 (2.7%) | 0 (0.0%) |
| Total | 968 (100.0%) | 1,689 (100.0%) |
Household Income by Mortgage Status in North Madison
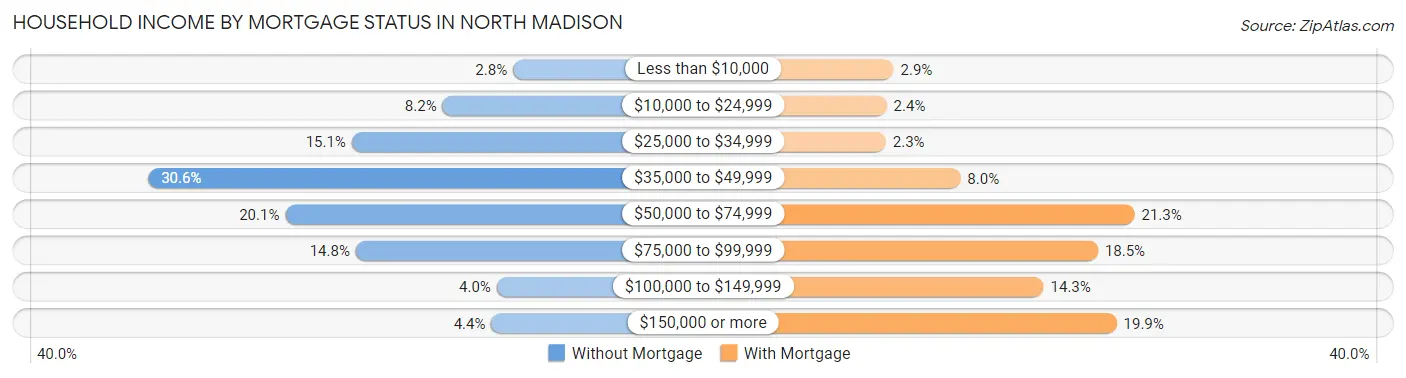
| Household Income | Without Mortgage | With Mortgage |
| Less than $10,000 | 27 (2.8%) | 49 (2.9%) |
| $10,000 to $24,999 | 79 (8.2%) | 40 (2.4%) |
| $25,000 to $34,999 | 146 (15.1%) | 39 (2.3%) |
| $35,000 to $49,999 | 296 (30.6%) | 135 (8.0%) |
| $50,000 to $74,999 | 195 (20.1%) | 359 (21.3%) |
| $75,000 to $99,999 | 143 (14.8%) | 312 (18.5%) |
| $100,000 to $149,999 | 39 (4.0%) | 242 (14.3%) |
| $150,000 or more | 43 (4.4%) | 336 (19.9%) |
| Total | 968 (100.0%) | 1,689 (100.0%) |
Property Value to Household Income Ratio in North Madison
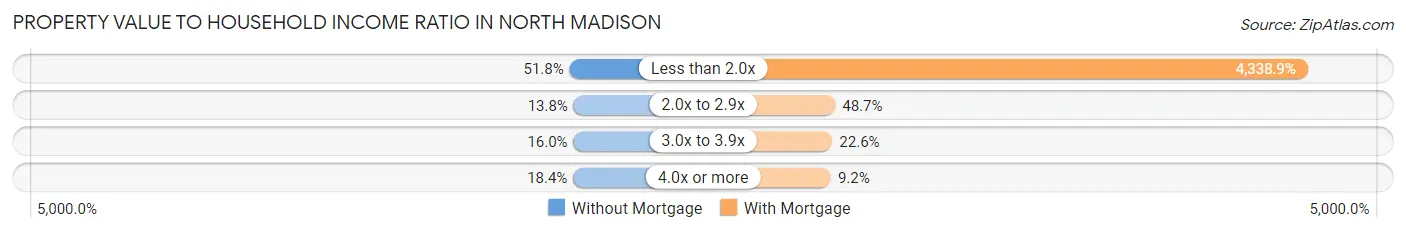
| Value-to-Income Ratio | Without Mortgage | With Mortgage |
| Less than 2.0x | 501 (51.8%) | 73,284 (4,338.9%) |
| 2.0x to 2.9x | 134 (13.8%) | 823 (48.7%) |
| 3.0x to 3.9x | 155 (16.0%) | 382 (22.6%) |
| 4.0x or more | 178 (18.4%) | 156 (9.2%) |
| Total | 968 (100.0%) | 1,689 (100.0%) |
Real Estate Taxes by Mortgage Status in North Madison
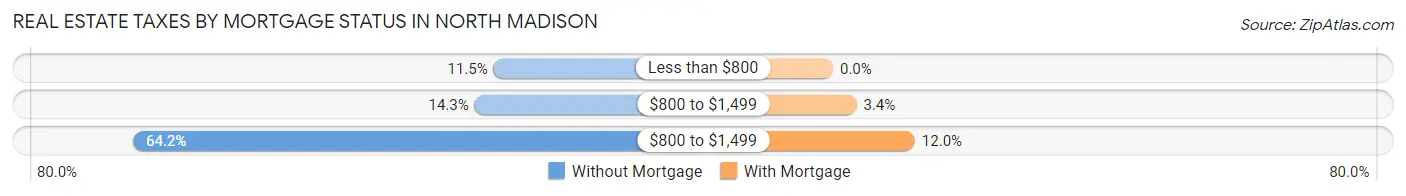
| Property Taxes | Without Mortgage | With Mortgage |
| Less than $800 | 111 (11.5%) | 0 (0.0%) |
| $800 to $1,499 | 138 (14.3%) | 58 (3.4%) |
| $800 to $1,499 | 621 (64.1%) | 202 (12.0%) |
| Total | 968 (100.0%) | 1,689 (100.0%) |
Health & Disability in North Madison
Health Insurance Coverage by Age in North Madison
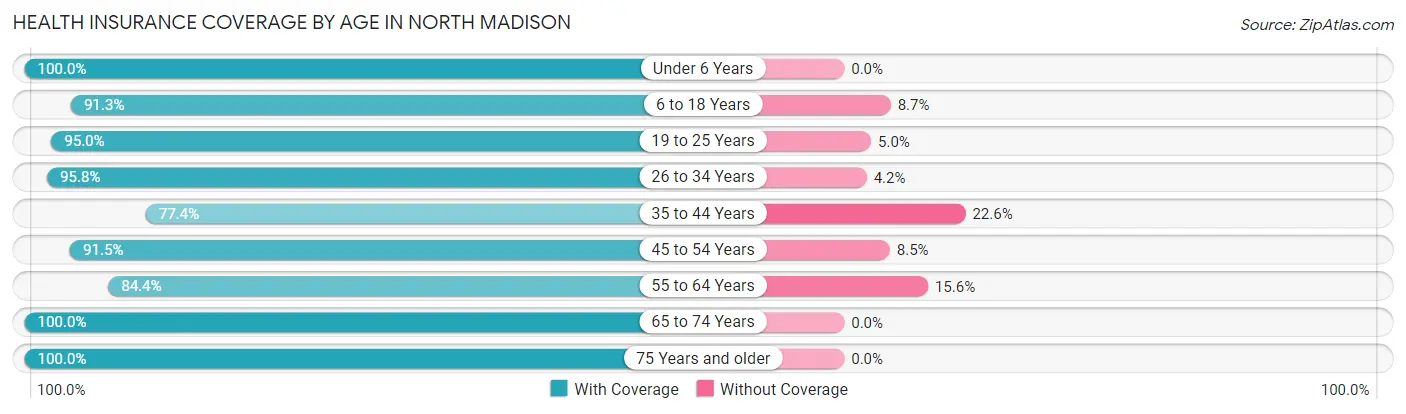
| Age Bracket | With Coverage | Without Coverage |
| Under 6 Years | 434 (100.0%) | 0 (0.0%) |
| 6 to 18 Years | 1,414 (91.3%) | 134 (8.7%) |
| 19 to 25 Years | 987 (95.0%) | 52 (5.0%) |
| 26 to 34 Years | 916 (95.8%) | 40 (4.2%) |
| 35 to 44 Years | 524 (77.4%) | 153 (22.6%) |
| 45 to 54 Years | 969 (91.5%) | 90 (8.5%) |
| 55 to 64 Years | 946 (84.4%) | 175 (15.6%) |
| 65 to 74 Years | 1,044 (100.0%) | 0 (0.0%) |
| 75 Years and older | 435 (100.0%) | 0 (0.0%) |
| Total | 7,669 (92.2%) | 644 (7.7%) |
Health Insurance Coverage by Citizenship Status in North Madison
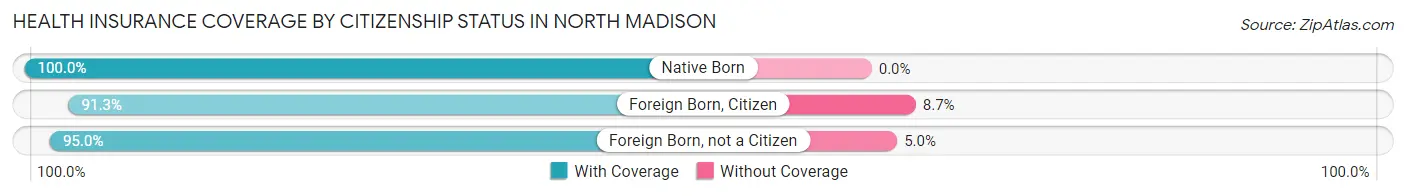
| Citizenship Status | With Coverage | Without Coverage |
| Native Born | 434 (100.0%) | 0 (0.0%) |
| Foreign Born, Citizen | 1,414 (91.3%) | 134 (8.7%) |
| Foreign Born, not a Citizen | 987 (95.0%) | 52 (5.0%) |
Health Insurance Coverage by Household Income in North Madison
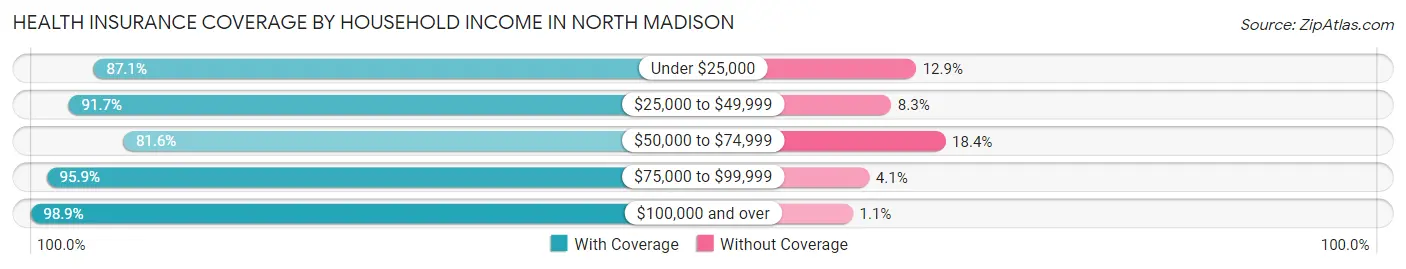
| Household Income | With Coverage | Without Coverage |
| Under $25,000 | 472 (87.1%) | 70 (12.9%) |
| $25,000 to $49,999 | 2,156 (91.7%) | 194 (8.3%) |
| $50,000 to $74,999 | 1,306 (81.6%) | 295 (18.4%) |
| $75,000 to $99,999 | 1,344 (95.9%) | 58 (4.1%) |
| $100,000 and over | 2,371 (98.9%) | 26 (1.1%) |
Public vs Private Health Insurance Coverage by Age in North Madison
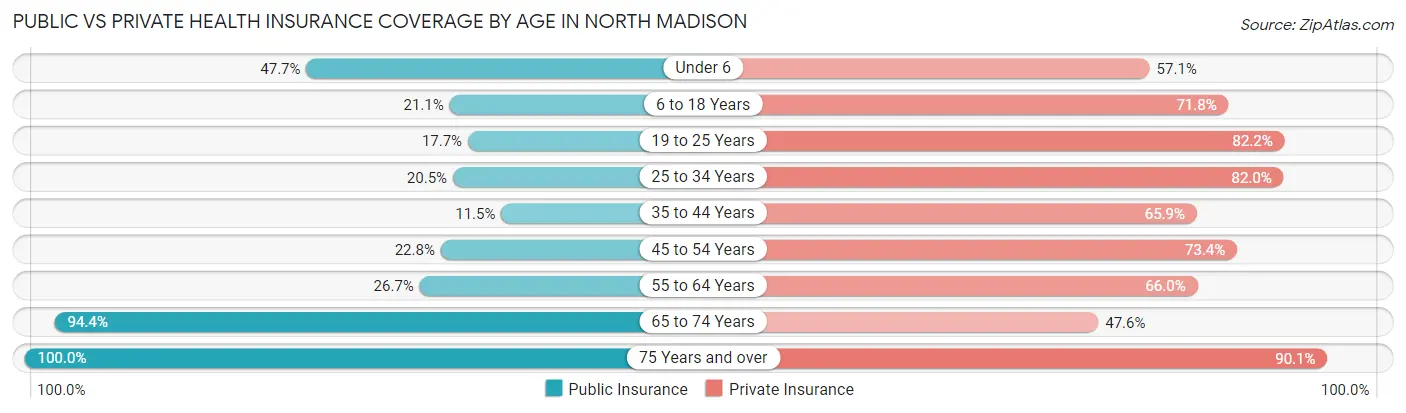
| Age Bracket | Public Insurance | Private Insurance |
| Under 6 | 207 (47.7%) | 248 (57.1%) |
| 6 to 18 Years | 327 (21.1%) | 1,111 (71.8%) |
| 19 to 25 Years | 184 (17.7%) | 854 (82.2%) |
| 25 to 34 Years | 196 (20.5%) | 784 (82.0%) |
| 35 to 44 Years | 78 (11.5%) | 446 (65.9%) |
| 45 to 54 Years | 241 (22.8%) | 777 (73.4%) |
| 55 to 64 Years | 299 (26.7%) | 740 (66.0%) |
| 65 to 74 Years | 986 (94.4%) | 497 (47.6%) |
| 75 Years and over | 435 (100.0%) | 392 (90.1%) |
| Total | 2,953 (35.5%) | 5,849 (70.4%) |
Disability Status by Sex by Age in North Madison
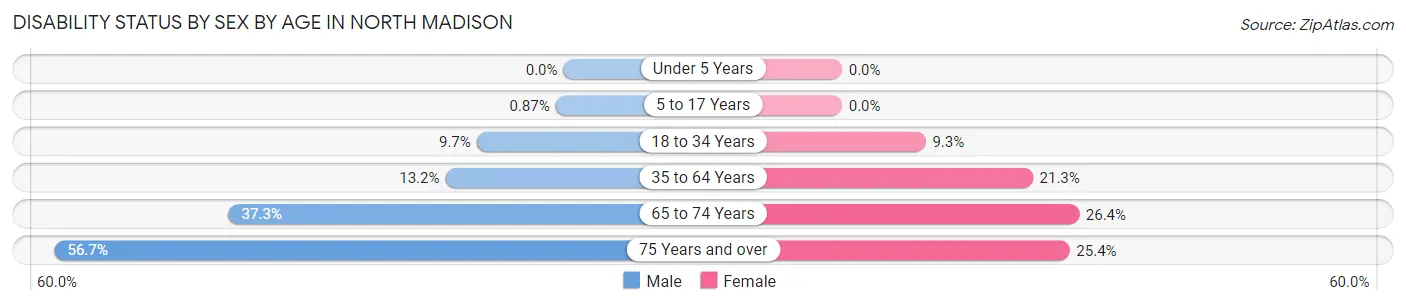
| Age Bracket | Male | Female |
| Under 5 Years | 0 (0.0%) | 0 (0.0%) |
| 5 to 17 Years | 6 (0.9%) | 0 (0.0%) |
| 18 to 34 Years | 100 (9.7%) | 103 (9.3%) |
| 35 to 64 Years | 190 (13.2%) | 300 (21.2%) |
| 65 to 74 Years | 142 (37.3%) | 175 (26.4%) |
| 75 Years and over | 166 (56.7%) | 36 (25.4%) |
Disability Class by Sex by Age in North Madison
Disability Class: Hearing Difficulty
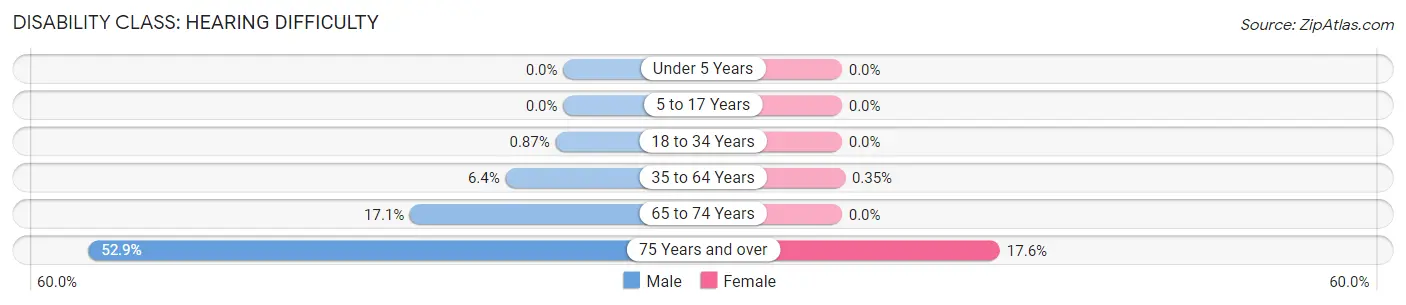
| Age Bracket | Male | Female |
| Under 5 Years | 0 (0.0%) | 0 (0.0%) |
| 5 to 17 Years | 0 (0.0%) | 0 (0.0%) |
| 18 to 34 Years | 9 (0.9%) | 0 (0.0%) |
| 35 to 64 Years | 93 (6.4%) | 5 (0.4%) |
| 65 to 74 Years | 65 (17.1%) | 0 (0.0%) |
| 75 Years and over | 155 (52.9%) | 25 (17.6%) |
Disability Class: Vision Difficulty
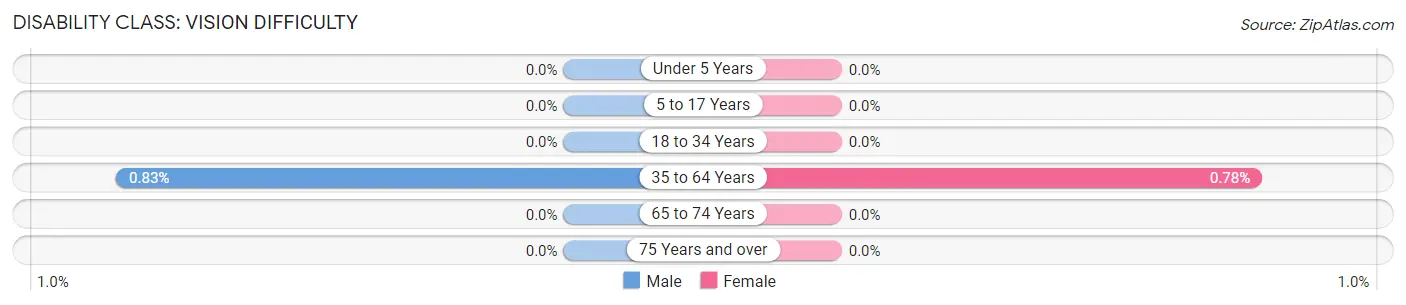
| Age Bracket | Male | Female |
| Under 5 Years | 0 (0.0%) | 0 (0.0%) |
| 5 to 17 Years | 0 (0.0%) | 0 (0.0%) |
| 18 to 34 Years | 0 (0.0%) | 0 (0.0%) |
| 35 to 64 Years | 12 (0.8%) | 11 (0.8%) |
| 65 to 74 Years | 0 (0.0%) | 0 (0.0%) |
| 75 Years and over | 0 (0.0%) | 0 (0.0%) |
Disability Class: Cognitive Difficulty
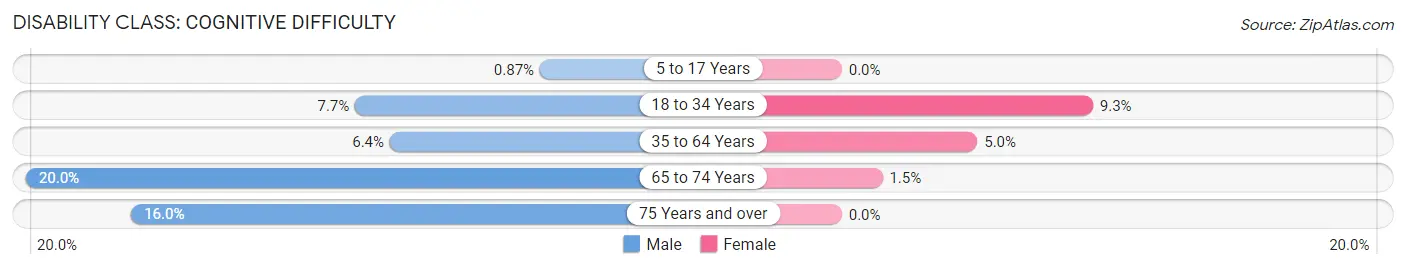
| Age Bracket | Male | Female |
| 5 to 17 Years | 6 (0.9%) | 0 (0.0%) |
| 18 to 34 Years | 80 (7.7%) | 103 (9.3%) |
| 35 to 64 Years | 93 (6.4%) | 71 (5.0%) |
| 65 to 74 Years | 76 (20.0%) | 10 (1.5%) |
| 75 Years and over | 47 (16.0%) | 0 (0.0%) |
Disability Class: Ambulatory Difficulty
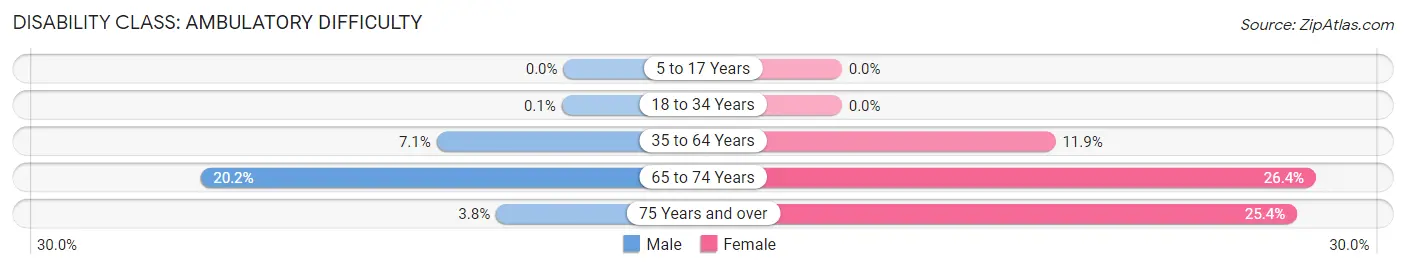
| Age Bracket | Male | Female |
| 5 to 17 Years | 0 (0.0%) | 0 (0.0%) |
| 18 to 34 Years | 1 (0.1%) | 0 (0.0%) |
| 35 to 64 Years | 102 (7.1%) | 168 (11.9%) |
| 65 to 74 Years | 77 (20.2%) | 175 (26.4%) |
| 75 Years and over | 11 (3.7%) | 36 (25.4%) |
Disability Class: Self-Care Difficulty
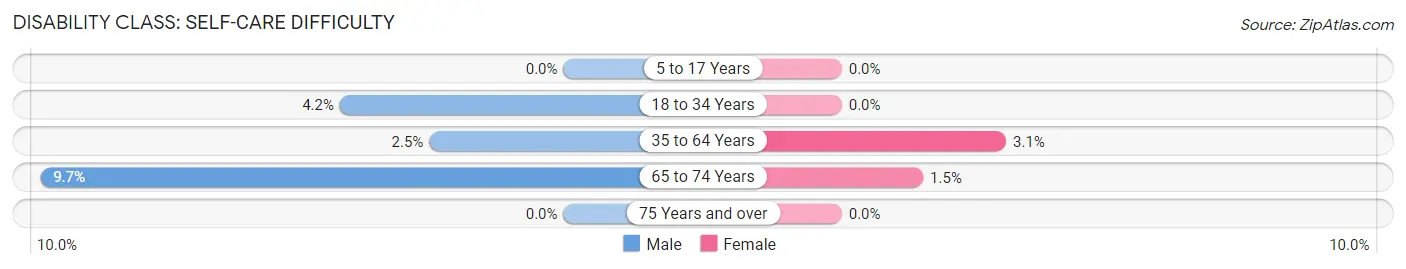
| Age Bracket | Male | Female |
| 5 to 17 Years | 0 (0.0%) | 0 (0.0%) |
| 18 to 34 Years | 43 (4.2%) | 0 (0.0%) |
| 35 to 64 Years | 36 (2.5%) | 43 (3.0%) |
| 65 to 74 Years | 37 (9.7%) | 10 (1.5%) |
| 75 Years and over | 0 (0.0%) | 0 (0.0%) |
Technology Access in North Madison
Computing Device Access in North Madison
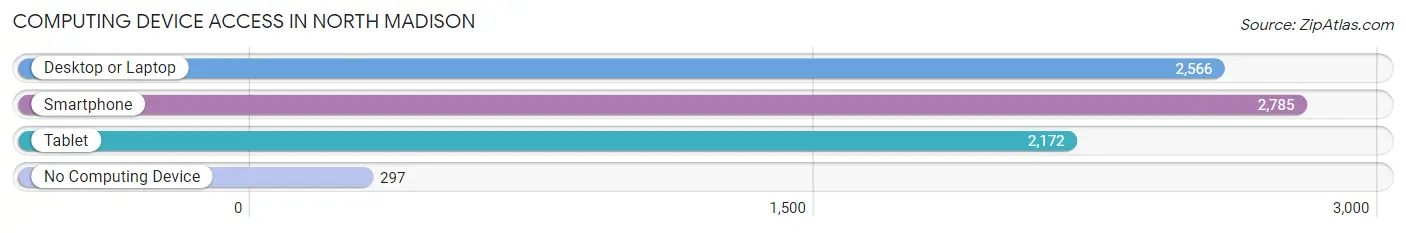
| Device Type | # Households | % Households |
| Desktop or Laptop | 2,566 | 74.8% |
| Smartphone | 2,785 | 81.2% |
| Tablet | 2,172 | 63.3% |
| No Computing Device | 297 | 8.7% |
| Total | 3,429 | 100.0% |
Internet Access in North Madison
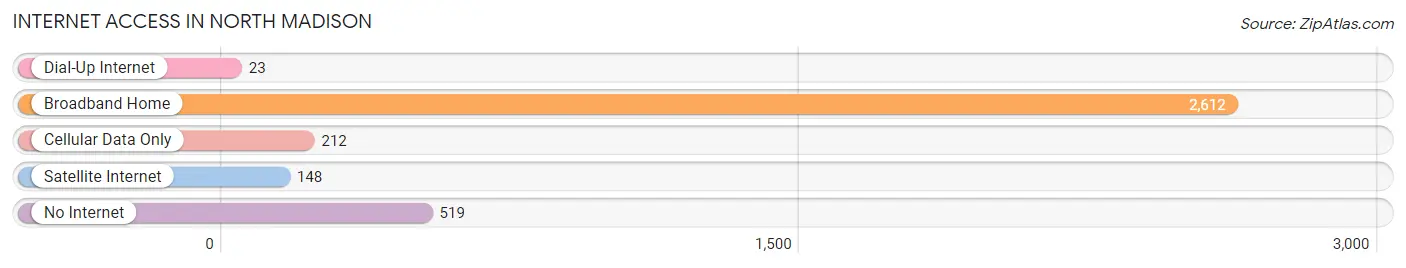
| Internet Type | # Households | % Households |
| Dial-Up Internet | 23 | 0.7% |
| Broadband Home | 2,612 | 76.2% |
| Cellular Data Only | 212 | 6.2% |
| Satellite Internet | 148 | 4.3% |
| No Internet | 519 | 15.1% |
| Total | 3,429 | 100.0% |
North Madison Summary
Madison is a small village located in the northeastern corner of Ohio, in Lake County. It is situated on the shores of Lake Erie, and is part of the Greater Cleveland metropolitan area. The village has a population of approximately 1,500 people, and is known for its small-town charm and rural atmosphere.
History
Madison was founded in 1818 by a group of settlers from Connecticut. The village was named after James Madison, the fourth President of the United States. The settlers were attracted to the area due to its proximity to Lake Erie, which provided them with access to the Great Lakes and the Ohio River.
The village grew slowly over the years, and by the mid-19th century, it had become a popular summer resort destination. The village was also home to a number of industries, including a brickyard, a sawmill, and a gristmill.
In the late 19th century, Madison began to experience a period of growth and development. The village was connected to the outside world by the Lake Shore and Michigan Southern Railway, and the village's population increased from 1,000 in 1880 to 1,500 in 1900.
Geography
Madison is located in the northeastern corner of Ohio, in Lake County. It is situated on the shores of Lake Erie, and is part of the Greater Cleveland metropolitan area. The village is located approximately 25 miles east of Cleveland, and is bordered by the cities of Mentor and Painesville.
The village is situated on a flat plain, and is surrounded by rolling hills and wooded areas. The village is located in a humid continental climate zone, and experiences hot summers and cold winters.
Economy
The economy of Madison is largely based on tourism and retail. The village is home to a number of small businesses, including restaurants, shops, and galleries. The village is also home to a number of small manufacturing companies, including a plastics manufacturer and a metal fabrication company.
The village is also home to a number of recreational activities, including fishing, boating, and swimming. The village is also home to a number of parks and trails, including the Madison Lake State Park.
Demographics
As of the 2010 census, the population of Madison was 1,500. The racial makeup of the village was 97.3% White, 0.7% African American, 0.3% Native American, 0.3% Asian, and 1.3% from other races. The median household income was $45,000, and the median family income was $50,000.
The village is home to a number of churches, including the First Congregational Church, the Madison United Methodist Church, and the Madison Presbyterian Church. The village is also home to a number of schools, including the Madison Local School District, the Madison High School, and the Madison Middle School.
Common Questions
What is Per Capita Income in North Madison?
Per Capita income in North Madison is $31,456.
What is the Median Family Income in North Madison?
Median Family Income in North Madison is $71,397.
What is the Median Household income in North Madison?
Median Household Income in North Madison is $54,917.
What is Income or Wage Gap in North Madison?
Income or Wage Gap in North Madison is 27.1%.
Women in North Madison earn 72.9 cents for every dollar earned by a man.
What is Inequality or Gini Index in North Madison?
Inequality or Gini Index in North Madison is 0.39.
What is the Total Population of North Madison?
Total Population of North Madison is 8,313.
What is the Total Male Population of North Madison?
Total Male Population of North Madison is 4,018.
What is the Total Female Population of North Madison?
Total Female Population of North Madison is 4,295.
What is the Ratio of Males per 100 Females in North Madison?
There are 93.55 Males per 100 Females in North Madison.
What is the Ratio of Females per 100 Males in North Madison?
There are 106.89 Females per 100 Males in North Madison.
What is the Median Population Age in North Madison?
Median Population Age in North Madison is 38.0 Years.
What is the Average Family Size in North Madison
Average Family Size in North Madison is 3.0 People.
What is the Average Household Size in North Madison
Average Household Size in North Madison is 2.4 People.
How Large is the Labor Force in North Madison?
There are 4,431 People in the Labor Forcein in North Madison.
What is the Percentage of People in the Labor Force in North Madison?
67.0% of People are in the Labor Force in North Madison.
What is the Unemployment Rate in North Madison?
Unemployment Rate in North Madison is 7.6%.