Middleport, NY Map & Demographics
Middleport Map
Middleport Overview
$27,377
PER CAPITA INCOME
$68,462
AVG FAMILY INCOME
$59,773
AVG HOUSEHOLD INCOME
21.3%
WAGE / INCOME GAP [ % ]
78.7¢/ $1
WAGE / INCOME GAP [ $ ]
0.38
INEQUALITY / GINI INDEX
1,972
TOTAL POPULATION
965
MALE POPULATION
1,007
FEMALE POPULATION
95.83
MALES / 100 FEMALES
104.35
FEMALES / 100 MALES
34.9
MEDIAN AGE
3.1
AVG FAMILY SIZE
2.6
AVG HOUSEHOLD SIZE
970
LABOR FORCE [ PEOPLE ]
63.8%
PERCENT IN LABOR FORCE
6.1%
UNEMPLOYMENT RATE
Middleport Zip Codes
Income in Middleport
Income Overview in Middleport
Per Capita Income in Middleport is $27,377, while median incomes of families and households are $68,462 and $59,773 respectively.
| Characteristic | Number | Measure |
| Per Capita Income | 1,972 | $27,377 |
| Median Family Income | 502 | $68,462 |
| Mean Family Income | 502 | $76,308 |
| Median Household Income | 754 | $59,773 |
| Mean Household Income | 754 | $71,079 |
| Income Deficit | 502 | $0 |
| Wage / Income Gap (%) | 1,972 | 21.27% |
| Wage / Income Gap ($) | 1,972 | 78.73¢ per $1 |
| Gini / Inequality Index | 1,972 | 0.38 |
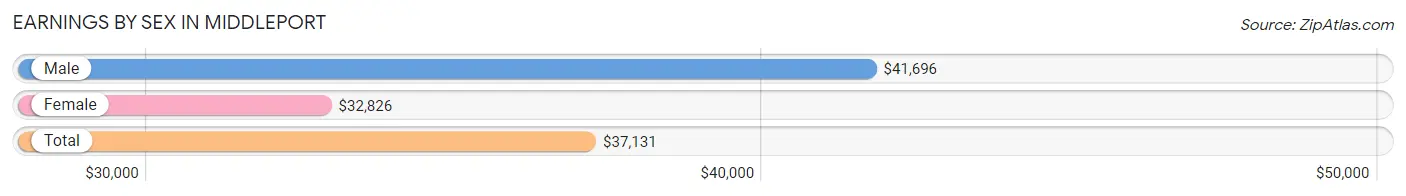
Earnings by Sex in Middleport
Average Earnings in Middleport are $37,131, $41,696 for men and $32,826 for women, a difference of 21.3%.
| Sex | Number | Average Earnings |
| Male | 487 (49.0%) | $41,696 |
| Female | 506 (51.0%) | $32,826 |
| Total | 993 (100.0%) | $37,131 |
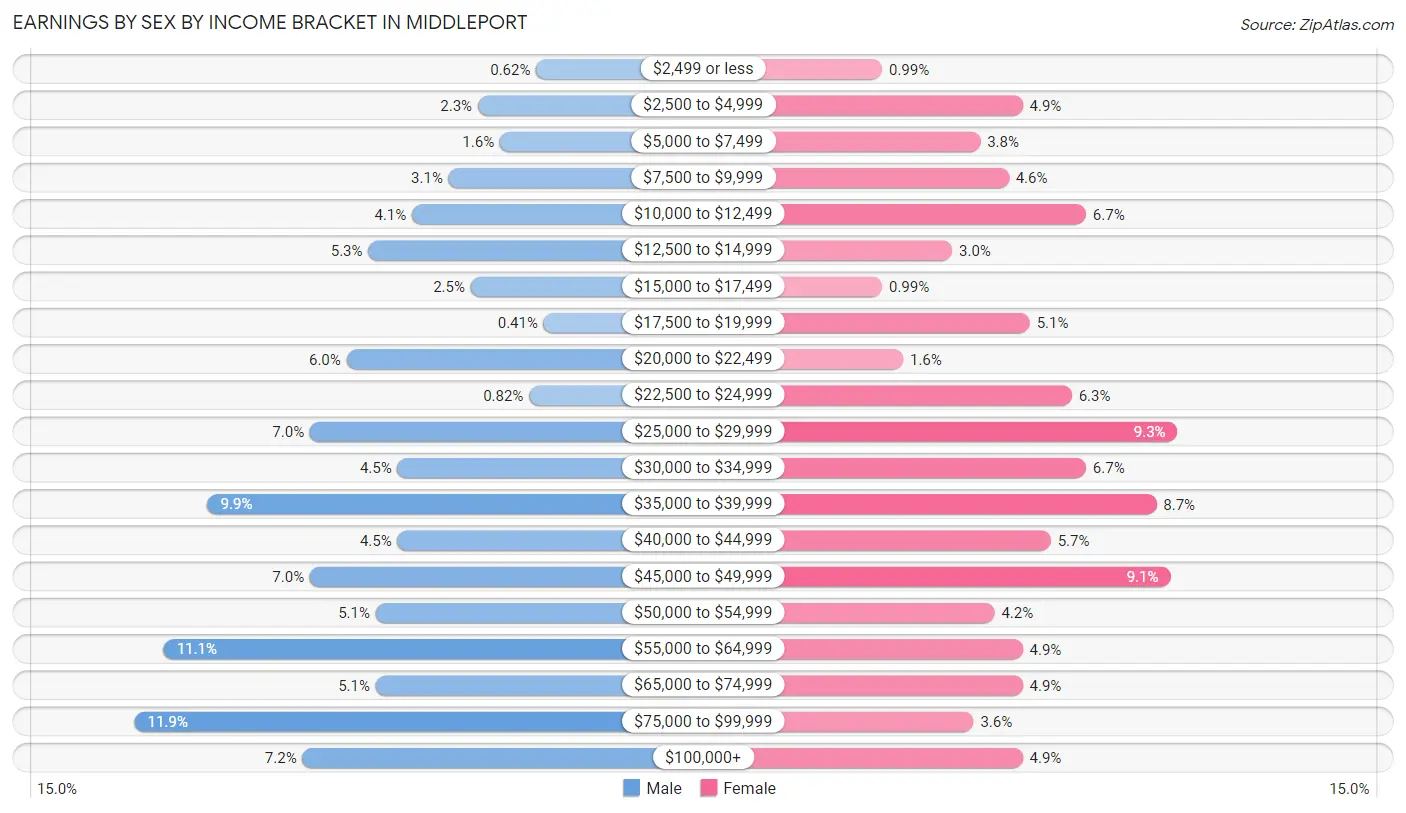
Earnings by Sex by Income Bracket in Middleport
The most common earnings brackets in Middleport are $75,000 to $99,999 for men (58 | 11.9%) and $25,000 to $29,999 for women (47 | 9.3%).
| Income | Male | Female |
| $2,499 or less | 3 (0.6%) | 5 (1.0%) |
| $2,500 to $4,999 | 11 (2.3%) | 25 (4.9%) |
| $5,000 to $7,499 | 8 (1.6%) | 19 (3.7%) |
| $7,500 to $9,999 | 15 (3.1%) | 23 (4.5%) |
| $10,000 to $12,499 | 20 (4.1%) | 34 (6.7%) |
| $12,500 to $14,999 | 26 (5.3%) | 15 (3.0%) |
| $15,000 to $17,499 | 12 (2.5%) | 5 (1.0%) |
| $17,500 to $19,999 | 2 (0.4%) | 26 (5.1%) |
| $20,000 to $22,499 | 29 (5.9%) | 8 (1.6%) |
| $22,500 to $24,999 | 4 (0.8%) | 32 (6.3%) |
| $25,000 to $29,999 | 34 (7.0%) | 47 (9.3%) |
| $30,000 to $34,999 | 22 (4.5%) | 34 (6.7%) |
| $35,000 to $39,999 | 48 (9.9%) | 44 (8.7%) |
| $40,000 to $44,999 | 22 (4.5%) | 29 (5.7%) |
| $45,000 to $49,999 | 34 (7.0%) | 46 (9.1%) |
| $50,000 to $54,999 | 25 (5.1%) | 21 (4.2%) |
| $55,000 to $64,999 | 54 (11.1%) | 25 (4.9%) |
| $65,000 to $74,999 | 25 (5.1%) | 25 (4.9%) |
| $75,000 to $99,999 | 58 (11.9%) | 18 (3.6%) |
| $100,000+ | 35 (7.2%) | 25 (4.9%) |
| Total | 487 (100.0%) | 506 (100.0%) |
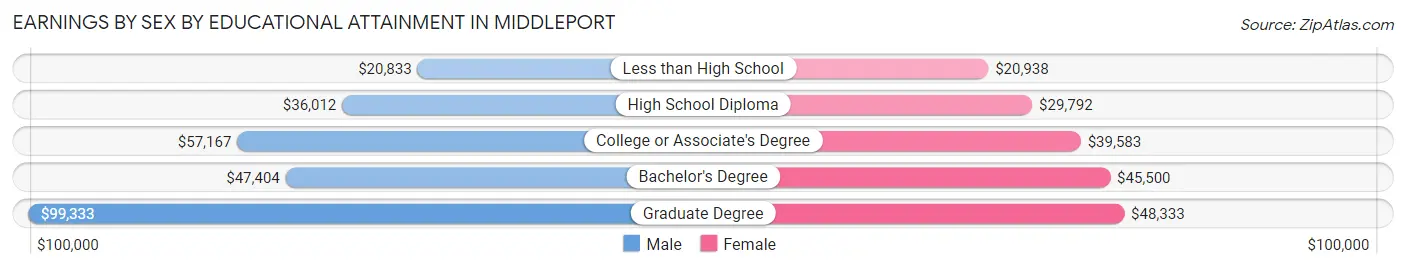
Earnings by Sex by Educational Attainment in Middleport
Average earnings in Middleport are $47,500 for men and $37,759 for women, a difference of 20.5%. Men with an educational attainment of graduate degree enjoy the highest average annual earnings of $99,333, while those with less than high school education earn the least with $20,833. Women with an educational attainment of graduate degree earn the most with the average annual earnings of $48,333, while those with less than high school education have the smallest earnings of $20,938.
| Educational Attainment | Male Income | Female Income |
| Less than High School | $20,833 | $20,938 |
| High School Diploma | $36,012 | $29,792 |
| College or Associate's Degree | $57,167 | $39,583 |
| Bachelor's Degree | $47,404 | $45,500 |
| Graduate Degree | $99,333 | $48,333 |
| Total | $47,500 | $37,759 |
Family Income in Middleport
Family Income Brackets in Middleport
According to the Middleport family income data, there are 105 families falling into the $100,000 to $149,999 income range, which is the most common income bracket and makes up 20.9% of all families. Conversely, the less than $10,000 income bracket is the least frequent group with only 7 families (1.4%) belonging to this category.
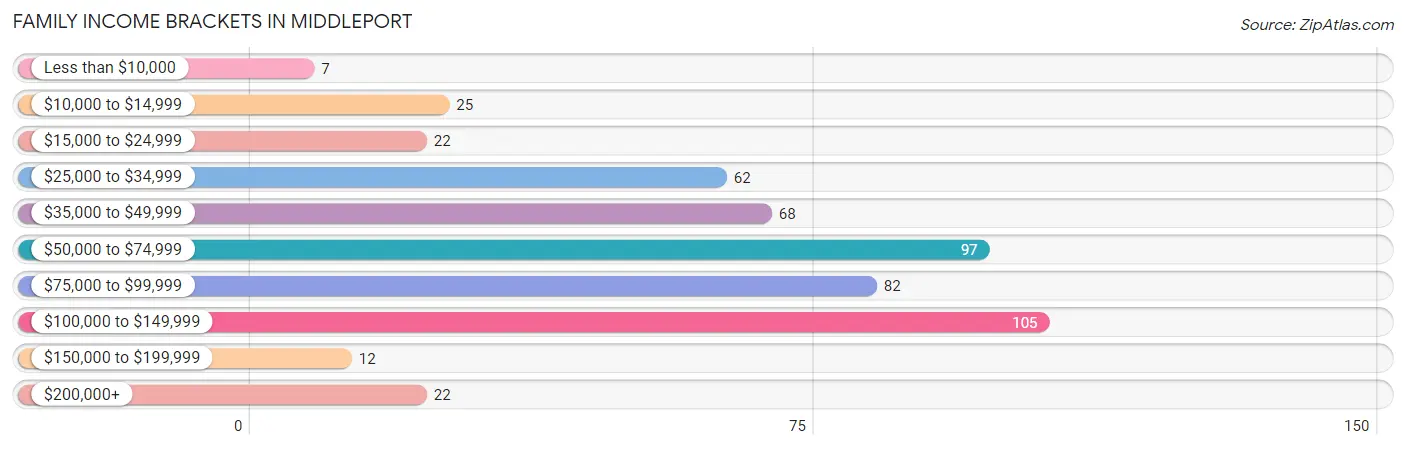
| Income Bracket | # Families | % Families |
| Less than $10,000 | 7 | 1.4% |
| $10,000 to $14,999 | 25 | 5.0% |
| $15,000 to $24,999 | 22 | 4.4% |
| $25,000 to $34,999 | 62 | 12.4% |
| $35,000 to $49,999 | 68 | 13.5% |
| $50,000 to $74,999 | 97 | 19.3% |
| $75,000 to $99,999 | 82 | 16.3% |
| $100,000 to $149,999 | 105 | 20.9% |
| $150,000 to $199,999 | 12 | 2.4% |
| $200,000+ | 22 | 4.4% |
Family Income by Famaliy Size in Middleport
3-person families (108 | 21.5%) account for the highest median family income in Middleport with $95,625 per family, while 3-person families (108 | 21.5%) have the highest median income of $31,875 per family member.
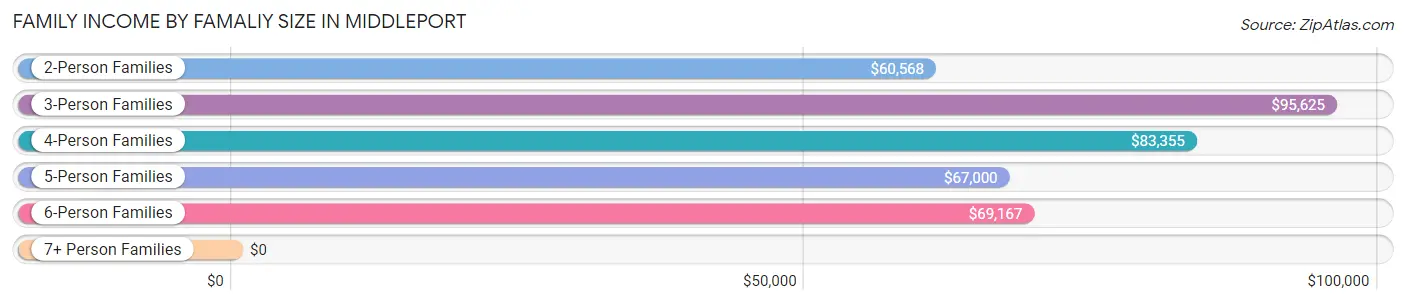
| Income Bracket | # Families | Median Income |
| 2-Person Families | 229 (45.6%) | $60,568 |
| 3-Person Families | 108 (21.5%) | $95,625 |
| 4-Person Families | 83 (16.5%) | $83,355 |
| 5-Person Families | 58 (11.6%) | $67,000 |
| 6-Person Families | 24 (4.8%) | $69,167 |
| 7+ Person Families | 0 (0.0%) | $0 |
| Total | 502 (100.0%) | $68,462 |
Family Income by Number of Earners in Middleport
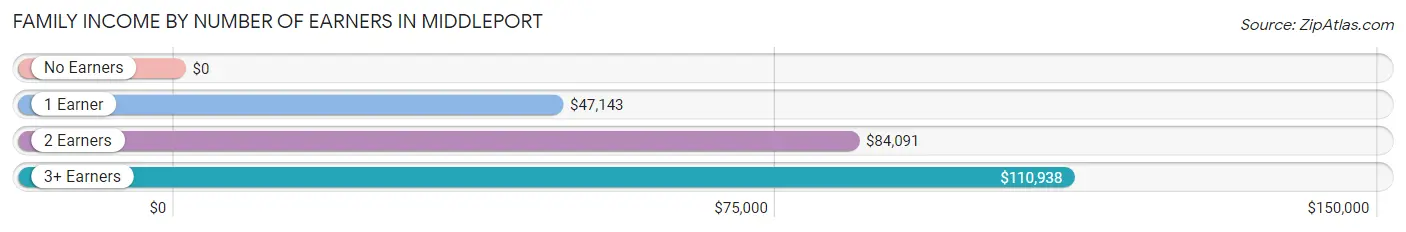
| Number of Earners | # Families | Median Income |
| No Earners | 81 (16.1%) | $0 |
| 1 Earner | 166 (33.1%) | $47,143 |
| 2 Earners | 194 (38.7%) | $84,091 |
| 3+ Earners | 61 (12.1%) | $110,938 |
| Total | 502 (100.0%) | $68,462 |
Household Income in Middleport
Household Income Brackets in Middleport
With 141 households falling in the category, the $50,000 to $74,999 income range is the most frequent in Middleport, accounting for 18.7% of all households. In contrast, only 7 households (0.9%) fall into the less than $10,000 income bracket, making it the least populous group.
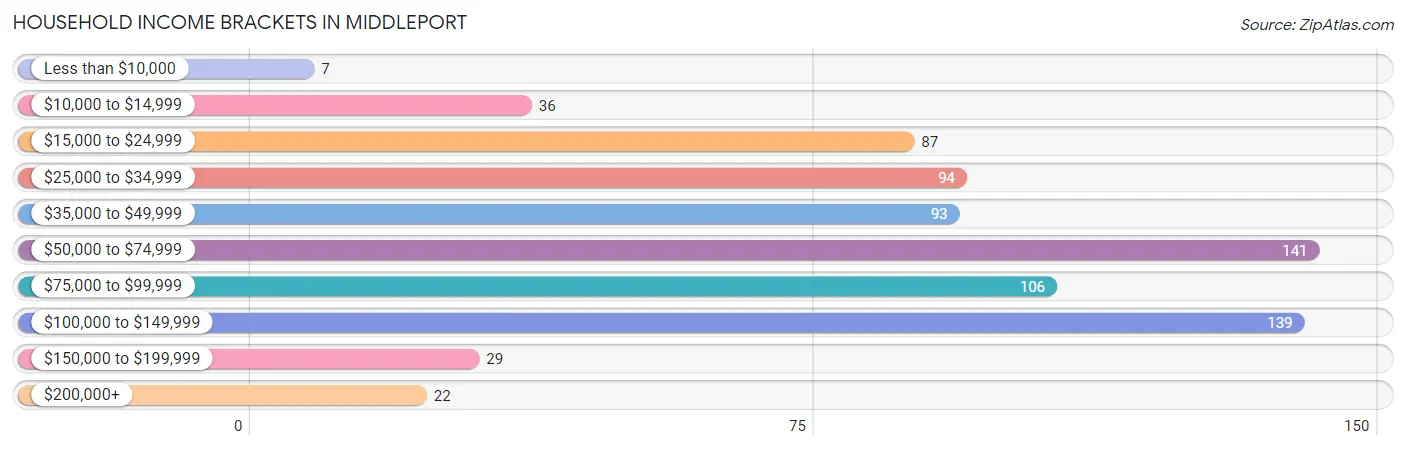
| Income Bracket | # Households | % Households |
| Less than $10,000 | 7 | 0.9% |
| $10,000 to $14,999 | 36 | 4.8% |
| $15,000 to $24,999 | 87 | 11.5% |
| $25,000 to $34,999 | 94 | 12.5% |
| $35,000 to $49,999 | 93 | 12.3% |
| $50,000 to $74,999 | 141 | 18.7% |
| $75,000 to $99,999 | 106 | 14.1% |
| $100,000 to $149,999 | 139 | 18.4% |
| $150,000 to $199,999 | 29 | 3.8% |
| $200,000+ | 22 | 2.9% |
Household Income by Householder Age in Middleport
The median household income in Middleport is $59,773, with the highest median household income of $84,063 found in the 45 to 64 years age bracket for the primary householder. A total of 343 households (45.5%) fall into this category. Meanwhile, the 15 to 24 years age bracket for the primary householder has the lowest median household income of $0, with 29 households (3.8%) in this group.
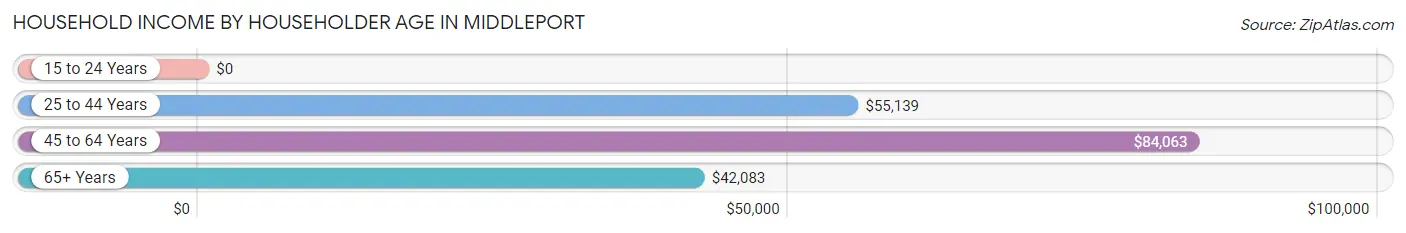
| Income Bracket | # Households | Median Income |
| 15 to 24 Years | 29 (3.8%) | $0 |
| 25 to 44 Years | 221 (29.3%) | $55,139 |
| 45 to 64 Years | 343 (45.5%) | $84,063 |
| 65+ Years | 161 (21.3%) | $42,083 |
| Total | 754 (100.0%) | $59,773 |
Poverty in Middleport
Income Below Poverty by Sex and Age in Middleport
With 13.1% poverty level for males and 13.0% for females among the residents of Middleport, 16 and 17 year old males and 15 year old females are the most vulnerable to poverty, with 15 males (68.2%) and 5 females (45.5%) in their respective age groups living below the poverty level.
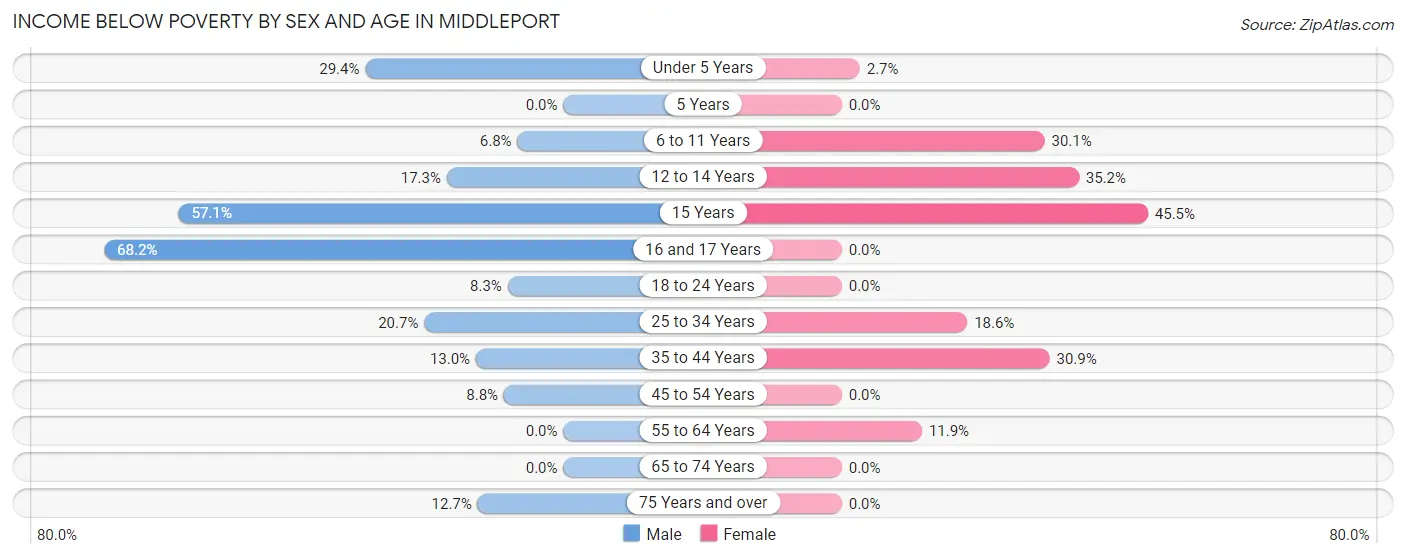
| Age Bracket | Male | Female |
| Under 5 Years | 20 (29.4%) | 2 (2.7%) |
| 5 Years | 0 (0.0%) | 0 (0.0%) |
| 6 to 11 Years | 3 (6.8%) | 28 (30.1%) |
| 12 to 14 Years | 9 (17.3%) | 19 (35.2%) |
| 15 Years | 12 (57.1%) | 5 (45.5%) |
| 16 and 17 Years | 15 (68.2%) | 0 (0.0%) |
| 18 to 24 Years | 9 (8.3%) | 0 (0.0%) |
| 25 to 34 Years | 25 (20.7%) | 27 (18.6%) |
| 35 to 44 Years | 17 (13.0%) | 29 (30.8%) |
| 45 to 54 Years | 9 (8.8%) | 0 (0.0%) |
| 55 to 64 Years | 0 (0.0%) | 20 (11.9%) |
| 65 to 74 Years | 0 (0.0%) | 0 (0.0%) |
| 75 Years and over | 7 (12.7%) | 0 (0.0%) |
| Total | 126 (13.1%) | 130 (13.0%) |
Income Above Poverty by Sex and Age in Middleport
According to the poverty statistics in Middleport, males aged 5 years and females aged 5 years are the age groups that are most secure financially, with 100.0% of males and 100.0% of females in these age groups living above the poverty line.
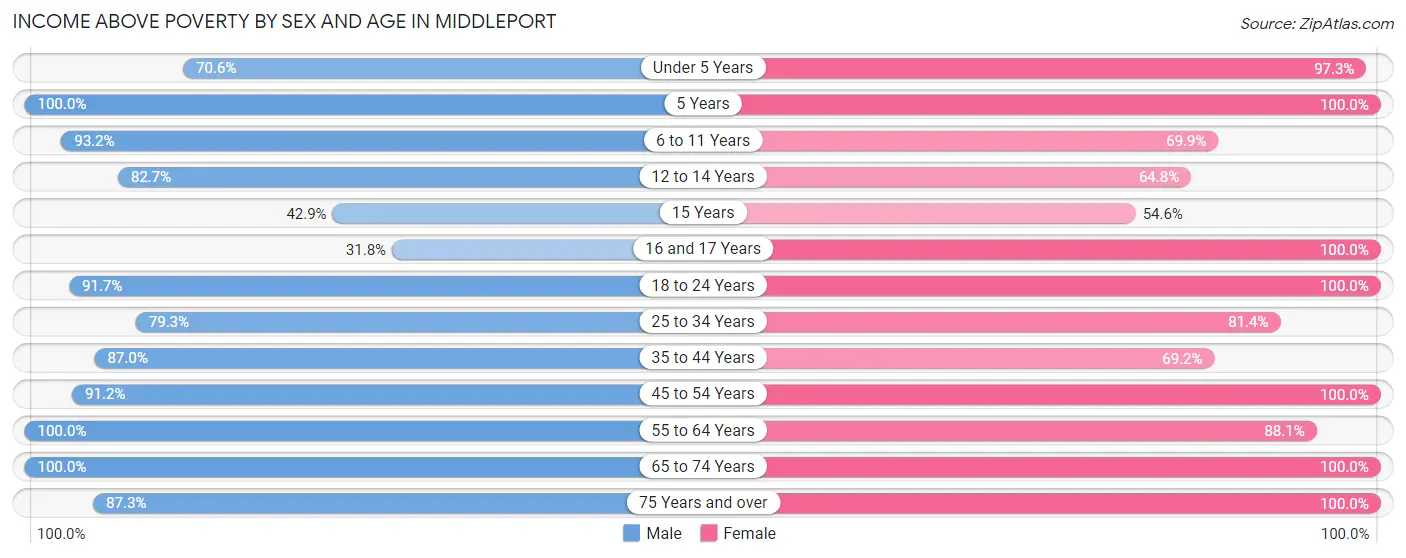
| Age Bracket | Male | Female |
| Under 5 Years | 48 (70.6%) | 73 (97.3%) |
| 5 Years | 25 (100.0%) | 1 (100.0%) |
| 6 to 11 Years | 41 (93.2%) | 65 (69.9%) |
| 12 to 14 Years | 43 (82.7%) | 35 (64.8%) |
| 15 Years | 9 (42.9%) | 6 (54.5%) |
| 16 and 17 Years | 7 (31.8%) | 29 (100.0%) |
| 18 to 24 Years | 100 (91.7%) | 109 (100.0%) |
| 25 to 34 Years | 96 (79.3%) | 118 (81.4%) |
| 35 to 44 Years | 114 (87.0%) | 65 (69.2%) |
| 45 to 54 Years | 93 (91.2%) | 97 (100.0%) |
| 55 to 64 Years | 154 (100.0%) | 148 (88.1%) |
| 65 to 74 Years | 56 (100.0%) | 74 (100.0%) |
| 75 Years and over | 48 (87.3%) | 54 (100.0%) |
| Total | 834 (86.9%) | 874 (87.1%) |
Income Below Poverty Among Married-Couple Families in Middleport
The poverty statistics for married-couple families in Middleport show that 9.1% or 29 of the total 317 families live below the poverty line. Families with 3 or 4 children have the highest poverty rate of 22.6%, comprising of 12 families. On the other hand, families with no children have the lowest poverty rate of 0.0%, which includes 0 families.
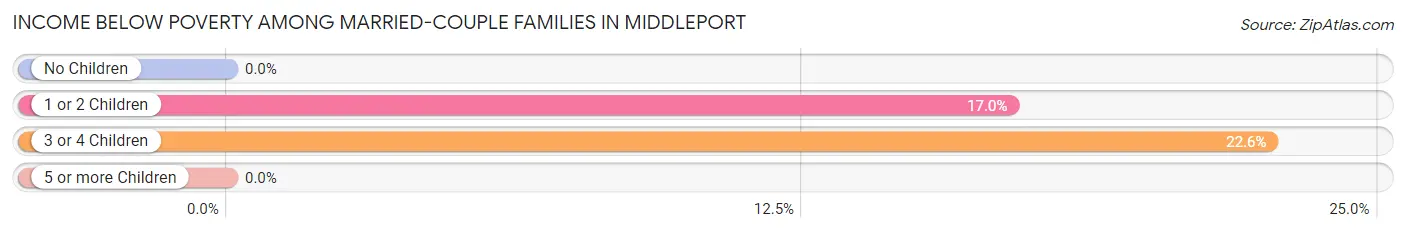
| Children | Above Poverty | Below Poverty |
| No Children | 164 (100.0%) | 0 (0.0%) |
| 1 or 2 Children | 83 (83.0%) | 17 (17.0%) |
| 3 or 4 Children | 41 (77.4%) | 12 (22.6%) |
| 5 or more Children | 0 (0.0%) | 0 (0.0%) |
| Total | 288 (90.8%) | 29 (9.1%) |
Income Below Poverty Among Single-Parent Households in Middleport
According to the poverty data in Middleport, 7.1% or 3 single-father households and 17.5% or 25 single-mother households are living below the poverty line. Among single-father households, those with 1 or 2 children have the highest poverty rate, with 3 households (25.0%) experiencing poverty. Likewise, among single-mother households, those with 1 or 2 children have the highest poverty rate, with 17 households (25.8%) falling below the poverty line.
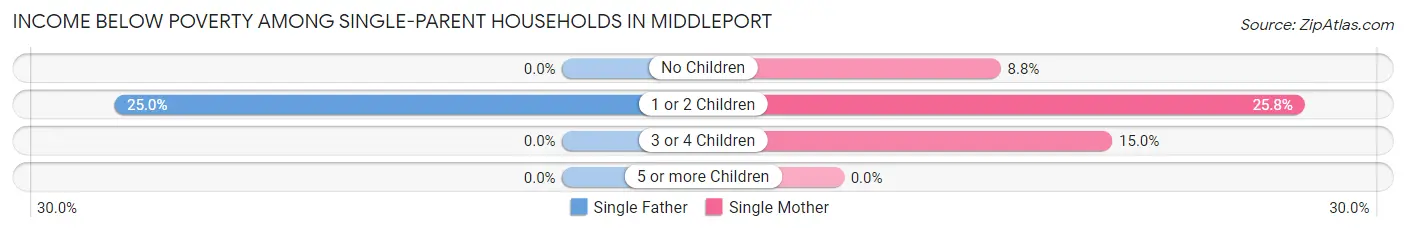
| Children | Single Father | Single Mother |
| No Children | 0 (0.0%) | 5 (8.8%) |
| 1 or 2 Children | 3 (25.0%) | 17 (25.8%) |
| 3 or 4 Children | 0 (0.0%) | 3 (15.0%) |
| 5 or more Children | 0 (0.0%) | 0 (0.0%) |
| Total | 3 (7.1%) | 25 (17.5%) |
Income Below Poverty Among Married-Couple vs Single-Parent Households in Middleport
The poverty data for Middleport shows that 29 of the married-couple family households (9.1%) and 28 of the single-parent households (15.1%) are living below the poverty level. Within the married-couple family households, those with 3 or 4 children have the highest poverty rate, with 12 households (22.6%) falling below the poverty line. Among the single-parent households, those with 1 or 2 children have the highest poverty rate, with 20 household (25.6%) living below poverty.
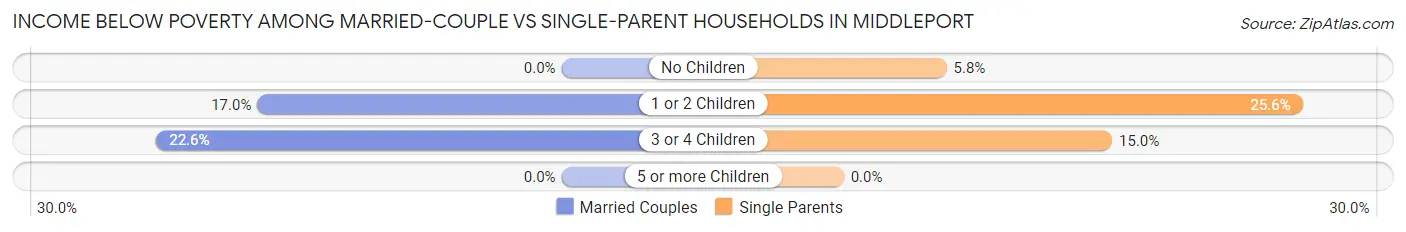
| Children | Married-Couple Families | Single-Parent Households |
| No Children | 0 (0.0%) | 5 (5.8%) |
| 1 or 2 Children | 17 (17.0%) | 20 (25.6%) |
| 3 or 4 Children | 12 (22.6%) | 3 (15.0%) |
| 5 or more Children | 0 (0.0%) | 0 (0.0%) |
| Total | 29 (9.1%) | 28 (15.1%) |
Race in Middleport
The most populous races in Middleport are White / Caucasian (1,837 | 93.1%), Two or more Races (94 | 4.8%), and Hispanic or Latino (31 | 1.6%).
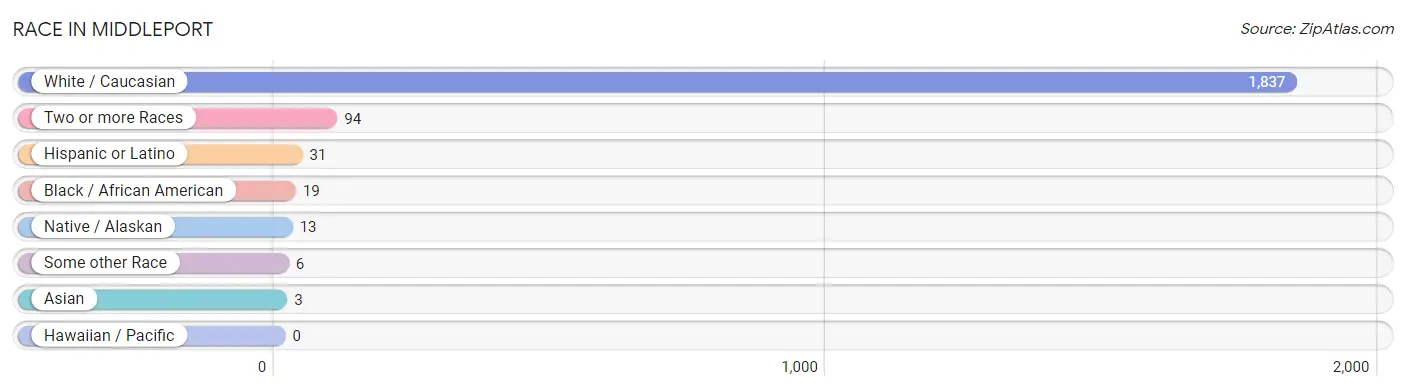
| Race | # Population | % Population |
| Asian | 3 | 0.2% |
| Black / African American | 19 | 1.0% |
| Hawaiian / Pacific | 0 | 0.0% |
| Hispanic or Latino | 31 | 1.6% |
| Native / Alaskan | 13 | 0.7% |
| White / Caucasian | 1,837 | 93.1% |
| Two or more Races | 94 | 4.8% |
| Some other Race | 6 | 0.3% |
| Total | 1,972 | 100.0% |
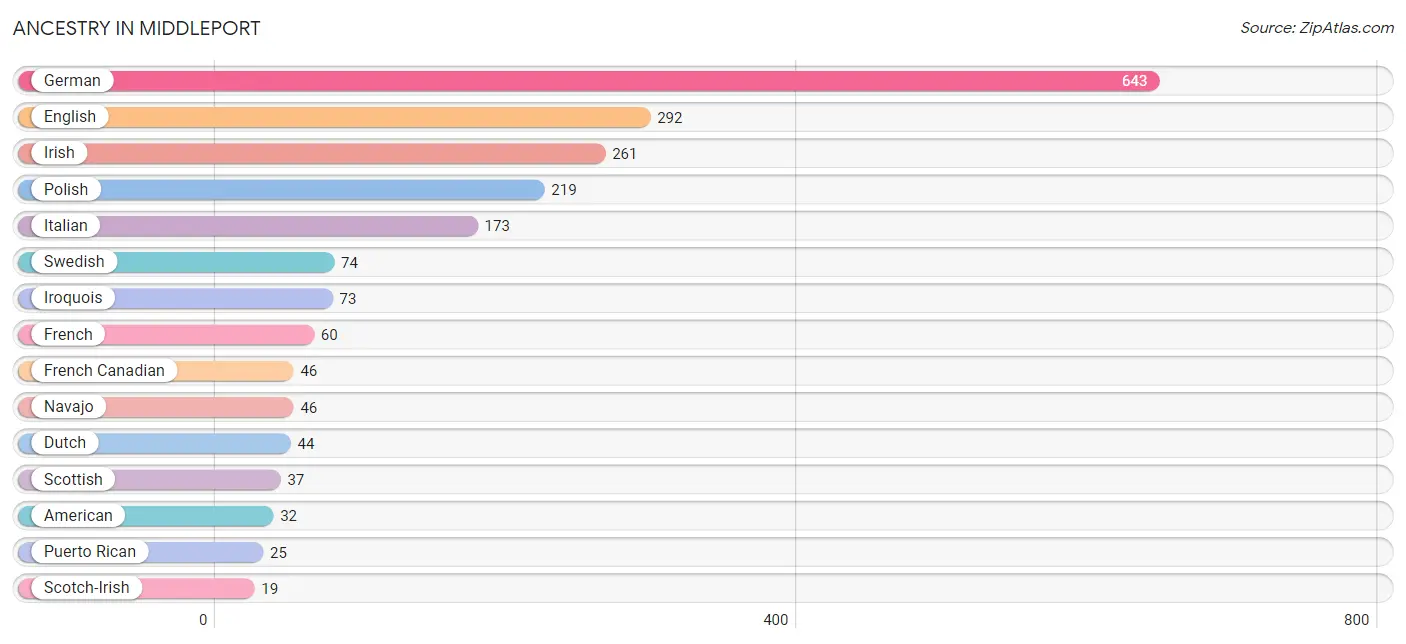
Ancestry in Middleport
The most populous ancestries reported in Middleport are German (643 | 32.6%), English (292 | 14.8%), Irish (261 | 13.2%), Polish (219 | 11.1%), and Italian (173 | 8.8%), together accounting for 80.5% of all Middleport residents.
| Ancestry | # Population | % Population |
| African | 10 | 0.5% |
| American | 32 | 1.6% |
| Austrian | 3 | 0.2% |
| Belgian | 2 | 0.1% |
| British | 6 | 0.3% |
| Canadian | 3 | 0.2% |
| Celtic | 4 | 0.2% |
| Central American | 6 | 0.3% |
| Cherokee | 5 | 0.3% |
| Czechoslovakian | 3 | 0.2% |
| Danish | 2 | 0.1% |
| Dutch | 44 | 2.2% |
| English | 292 | 14.8% |
| European | 7 | 0.4% |
| Finnish | 3 | 0.2% |
| French | 60 | 3.0% |
| French Canadian | 46 | 2.3% |
| German | 643 | 32.6% |
| Guatemalan | 6 | 0.3% |
| Hungarian | 4 | 0.2% |
| Irish | 261 | 13.2% |
| Iroquois | 73 | 3.7% |
| Italian | 173 | 8.8% |
| Korean | 3 | 0.2% |
| Navajo | 46 | 2.3% |
| Northern European | 4 | 0.2% |
| Norwegian | 8 | 0.4% |
| Pennsylvania German | 2 | 0.1% |
| Polish | 219 | 11.1% |
| Portuguese | 3 | 0.2% |
| Puerto Rican | 25 | 1.3% |
| Scotch-Irish | 19 | 1.0% |
| Scottish | 37 | 1.9% |
| Slavic | 4 | 0.2% |
| Subsaharan African | 10 | 0.5% |
| Swedish | 74 | 3.7% |
| Swiss | 4 | 0.2% |
| Welsh | 11 | 0.6% |
| Yugoslavian | 3 | 0.2% | View All 39 Rows |
Immigrants in Middleport
The most numerous immigrant groups reported in Middleport came from Central America (6 | 0.3%), Guatemala (6 | 0.3%), Latin America (6 | 0.3%), Europe (5 | 0.3%), and Germany (5 | 0.3%), together accounting for 1.4% of all Middleport residents.
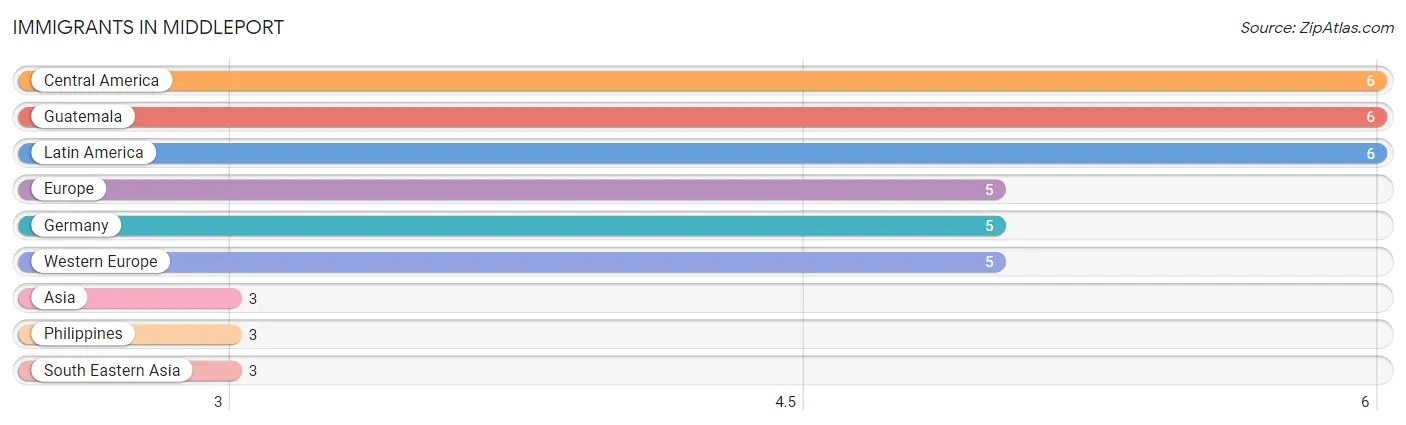
| Immigration Origin | # Population | % Population |
| Asia | 3 | 0.2% |
| Central America | 6 | 0.3% |
| Europe | 5 | 0.3% |
| Germany | 5 | 0.3% |
| Guatemala | 6 | 0.3% |
| Latin America | 6 | 0.3% |
| Philippines | 3 | 0.2% |
| South Eastern Asia | 3 | 0.2% |
| Western Europe | 5 | 0.3% | View All 9 Rows |
Sex and Age in Middleport
Sex and Age in Middleport
The most populous age groups in Middleport are 35 to 39 Years (91 | 9.4%) for men and 20 to 24 Years (103 | 10.2%) for women.
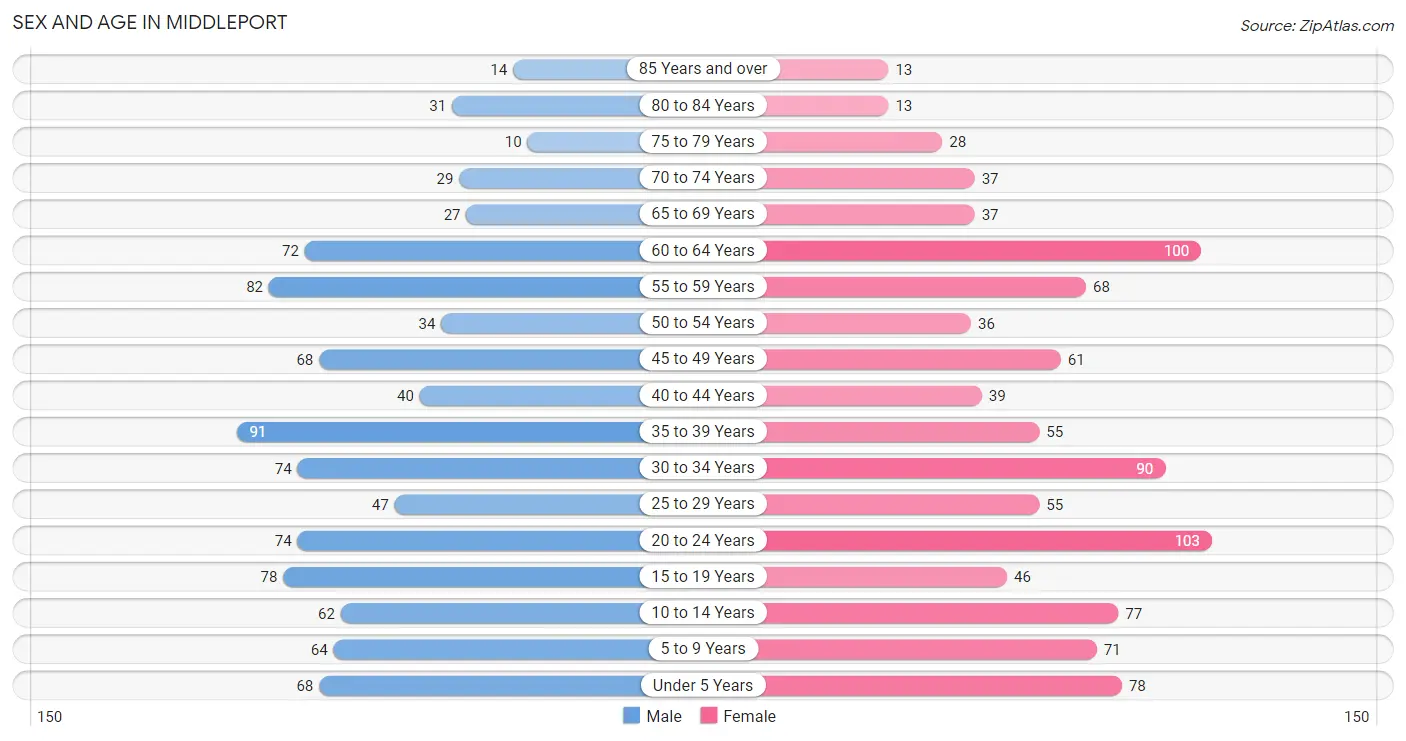
| Age Bracket | Male | Female |
| Under 5 Years | 68 (7.0%) | 78 (7.7%) |
| 5 to 9 Years | 64 (6.6%) | 71 (7.0%) |
| 10 to 14 Years | 62 (6.4%) | 77 (7.6%) |
| 15 to 19 Years | 78 (8.1%) | 46 (4.6%) |
| 20 to 24 Years | 74 (7.7%) | 103 (10.2%) |
| 25 to 29 Years | 47 (4.9%) | 55 (5.5%) |
| 30 to 34 Years | 74 (7.7%) | 90 (8.9%) |
| 35 to 39 Years | 91 (9.4%) | 55 (5.5%) |
| 40 to 44 Years | 40 (4.2%) | 39 (3.9%) |
| 45 to 49 Years | 68 (7.0%) | 61 (6.1%) |
| 50 to 54 Years | 34 (3.5%) | 36 (3.6%) |
| 55 to 59 Years | 82 (8.5%) | 68 (6.8%) |
| 60 to 64 Years | 72 (7.5%) | 100 (9.9%) |
| 65 to 69 Years | 27 (2.8%) | 37 (3.7%) |
| 70 to 74 Years | 29 (3.0%) | 37 (3.7%) |
| 75 to 79 Years | 10 (1.0%) | 28 (2.8%) |
| 80 to 84 Years | 31 (3.2%) | 13 (1.3%) |
| 85 Years and over | 14 (1.5%) | 13 (1.3%) |
| Total | 965 (100.0%) | 1,007 (100.0%) |
Families and Households in Middleport
Median Family Size in Middleport
The median family size in Middleport is 3.11 persons per family, with married-couple families (317 | 63.1%) accounting for the largest median family size of 3.33 persons per family. On the other hand, single male/father families (42 | 8.4%) represent the smallest median family size with 2.19 persons per family.
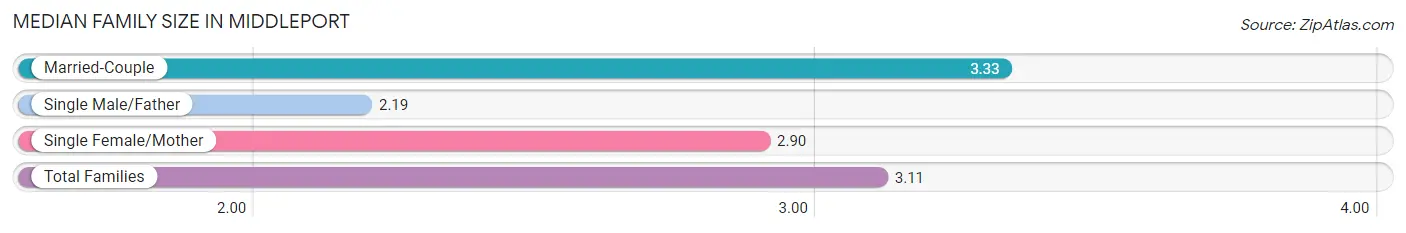
| Family Type | # Families | Family Size |
| Married-Couple | 317 (63.1%) | 3.33 |
| Single Male/Father | 42 (8.4%) | 2.19 |
| Single Female/Mother | 143 (28.5%) | 2.90 |
| Total Families | 502 (100.0%) | 3.11 |
Median Household Size in Middleport
The median household size in Middleport is 2.62 persons per household, with single female/mother households (143 | 19.0%) accounting for the largest median household size of 3.47 persons per household. non-family households (252 | 33.4%) represent the smallest median household size with 1.21 persons per household.
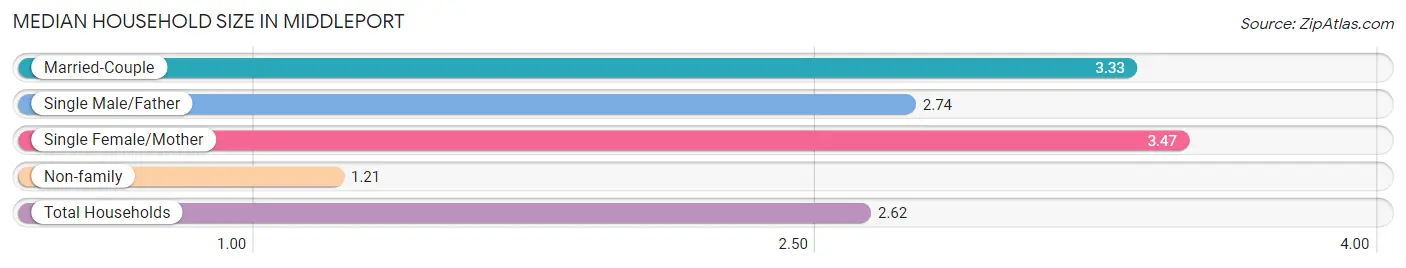
| Household Type | # Households | Household Size |
| Married-Couple | 317 (42.0%) | 3.33 |
| Single Male/Father | 42 (5.6%) | 2.74 |
| Single Female/Mother | 143 (19.0%) | 3.47 |
| Non-family | 252 (33.4%) | 1.21 |
| Total Households | 754 (100.0%) | 2.62 |
Household Size by Marriage Status in Middleport
Out of a total of 754 households in Middleport, 502 (66.6%) are family households, while 252 (33.4%) are nonfamily households. The most numerous type of family households are 2-person households, comprising 190, and the most common type of nonfamily households are 1-person households, comprising 205.
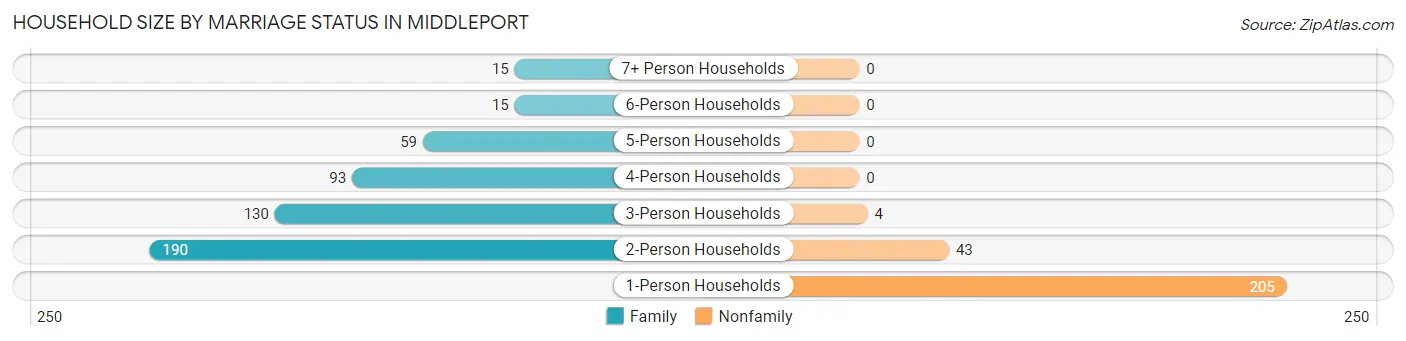
| Household Size | Family Households | Nonfamily Households |
| 1-Person Households | - | 205 (27.2%) |
| 2-Person Households | 190 (25.2%) | 43 (5.7%) |
| 3-Person Households | 130 (17.2%) | 4 (0.5%) |
| 4-Person Households | 93 (12.3%) | 0 (0.0%) |
| 5-Person Households | 59 (7.8%) | 0 (0.0%) |
| 6-Person Households | 15 (2.0%) | 0 (0.0%) |
| 7+ Person Households | 15 (2.0%) | 0 (0.0%) |
| Total | 502 (66.6%) | 252 (33.4%) |
Female Fertility in Middleport
Fertility by Age in Middleport
Average fertility rate in Middleport is 43.0 births per 1,000 women. Women in the age bracket of 20 to 34 years have the highest fertility rate with 65.0 births per 1,000 women. Women in the age bracket of 20 to 34 years acount for 80.0% of all women with births.
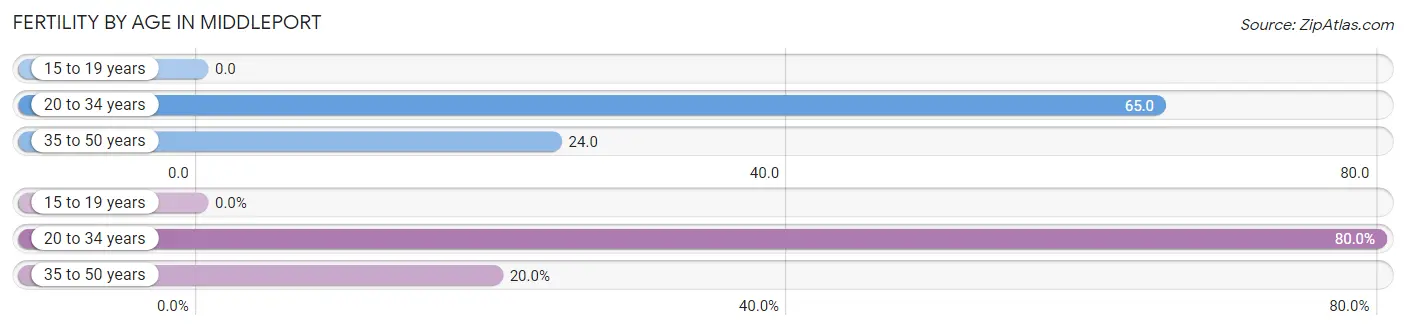
| Age Bracket | Women with Births | Births / 1,000 Women |
| 15 to 19 years | 0 (0.0%) | 0.0 |
| 20 to 34 years | 16 (80.0%) | 65.0 |
| 35 to 50 years | 4 (20.0%) | 24.0 |
| Total | 20 (100.0%) | 43.0 |
Fertility by Age by Marriage Status in Middleport
60.0% of women with births (20) in Middleport are married. The highest percentage of unmarried women with births falls into 20 to 34 years age bracket with 50.0% of them unmarried at the time of birth, while the lowest percentage of unmarried women with births belong to 35 to 50 years age bracket with 0.0% of them unmarried.
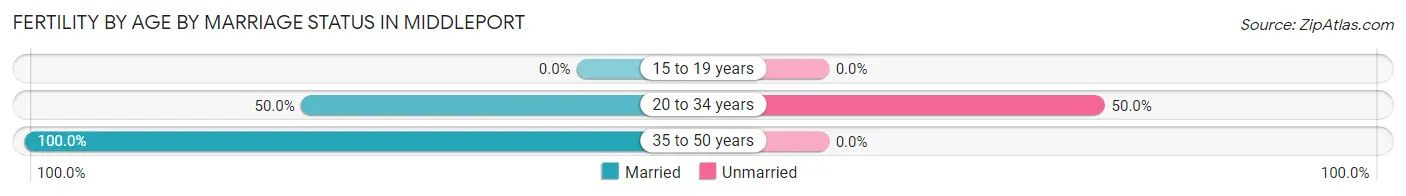
| Age Bracket | Married | Unmarried |
| 15 to 19 years | 0 (0.0%) | 0 (0.0%) |
| 20 to 34 years | 8 (50.0%) | 8 (50.0%) |
| 35 to 50 years | 4 (100.0%) | 0 (0.0%) |
| Total | 12 (60.0%) | 8 (40.0%) |
Fertility by Education in Middleport
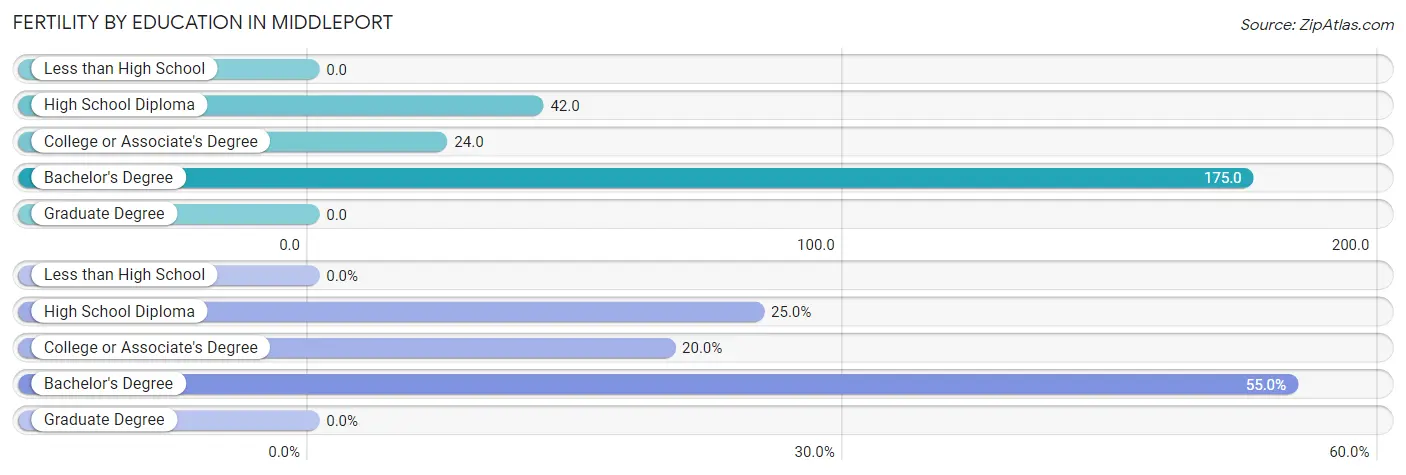
| Educational Attainment | Women with Births | Births / 1,000 Women |
| Less than High School | 0 (0.0%) | 0.0 |
| High School Diploma | 5 (25.0%) | 42.0 |
| College or Associate's Degree | 4 (20.0%) | 24.0 |
| Bachelor's Degree | 11 (55.0%) | 175.0 |
| Graduate Degree | 0 (0.0%) | 0.0 |
| Total | 20 (100.0%) | 43.0 |
Fertility by Education by Marriage Status in Middleport
40.0% of women with births in Middleport are unmarried. Women with the educational attainment of college or associate's degree are most likely to be married with 100.0% of them married at childbirth, while women with the educational attainment of high school diploma are least likely to be married with 100.0% of them unmarried at childbirth.
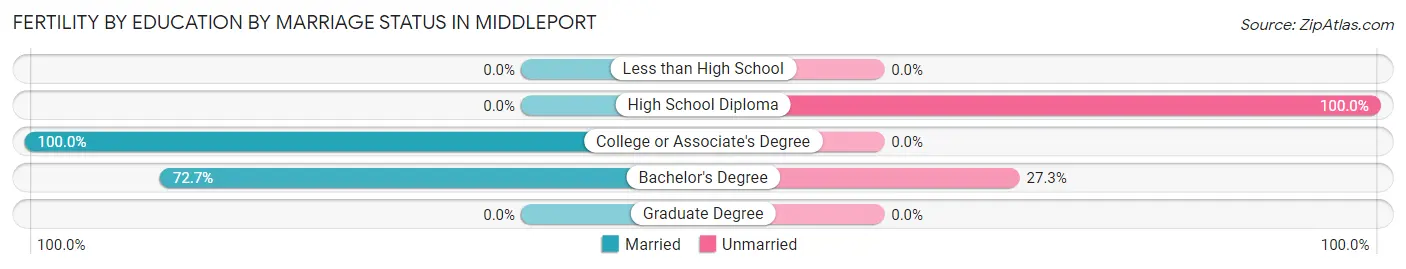
| Educational Attainment | Married | Unmarried |
| Less than High School | 0 (0.0%) | 0 (0.0%) |
| High School Diploma | 0 (0.0%) | 5 (100.0%) |
| College or Associate's Degree | 4 (100.0%) | 0 (0.0%) |
| Bachelor's Degree | 8 (72.7%) | 3 (27.3%) |
| Graduate Degree | 0 (0.0%) | 0 (0.0%) |
| Total | 12 (60.0%) | 8 (40.0%) |
Employment Characteristics in Middleport
Employment by Class of Employer in Middleport
Among the 882 employed individuals in Middleport, private company employees (647 | 73.4%), not-for-profit organizations (79 | 9.0%), and local government employees (52 | 5.9%) make up the most common classes of employment.
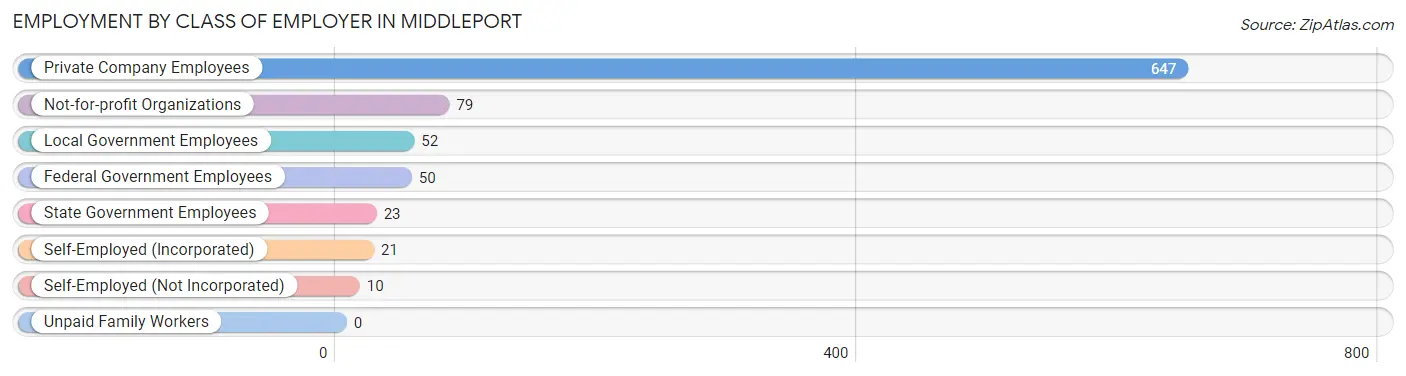
| Employer Class | # Employees | % Employees |
| Private Company Employees | 647 | 73.4% |
| Self-Employed (Incorporated) | 21 | 2.4% |
| Self-Employed (Not Incorporated) | 10 | 1.1% |
| Not-for-profit Organizations | 79 | 9.0% |
| Local Government Employees | 52 | 5.9% |
| State Government Employees | 23 | 2.6% |
| Federal Government Employees | 50 | 5.7% |
| Unpaid Family Workers | 0 | 0.0% |
| Total | 882 | 100.0% |
Employment Status by Age in Middleport
According to the labor force statistics for Middleport, out of the total population over 16 years of age (1,520), 63.8% or 970 individuals are in the labor force, with 6.1% or 59 of them unemployed. The age group with the highest labor force participation rate is 45 to 54 years, with 92.0% or 183 individuals in the labor force. Within the labor force, the 60 to 64 years age range has the highest percentage of unemployed individuals, with 13.0% or 13 of them being unemployed.
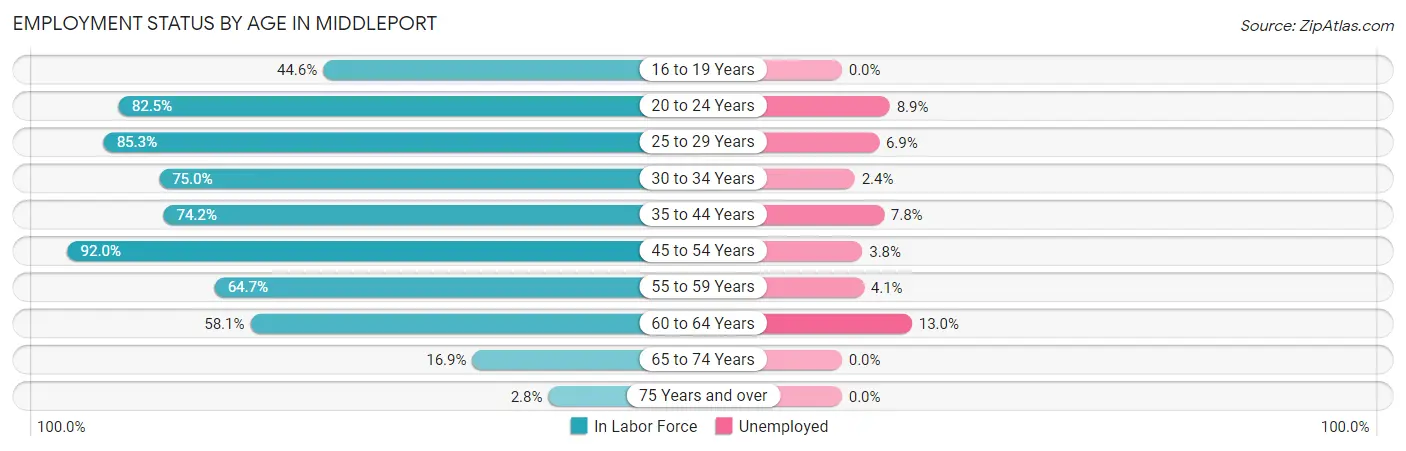
| Age Bracket | In Labor Force | Unemployed |
| 16 to 19 Years | 41 (44.6%) | 0 (0.0%) |
| 20 to 24 Years | 146 (82.5%) | 13 (8.9%) |
| 25 to 29 Years | 87 (85.3%) | 6 (6.9%) |
| 30 to 34 Years | 123 (75.0%) | 3 (2.4%) |
| 35 to 44 Years | 167 (74.2%) | 13 (7.8%) |
| 45 to 54 Years | 183 (92.0%) | 7 (3.8%) |
| 55 to 59 Years | 97 (64.7%) | 4 (4.1%) |
| 60 to 64 Years | 100 (58.1%) | 13 (13.0%) |
| 65 to 74 Years | 22 (16.9%) | 0 (0.0%) |
| 75 Years and over | 3 (2.8%) | 0 (0.0%) |
| Total | 970 (63.8%) | 59 (6.1%) |
Employment Status by Educational Attainment in Middleport
According to labor force statistics for Middleport, 74.8% of individuals (757) out of the total population between 25 and 64 years of age (1,012) are in the labor force, with 6.1% or 46 of them being unemployed. The group with the highest labor force participation rate are those with the educational attainment of college / associate degree, with 80.5% or 260 individuals in the labor force. Within the labor force, individuals with bachelor's degree or higher education have the highest percentage of unemployment, with 9.5% or 18 of them being unemployed.
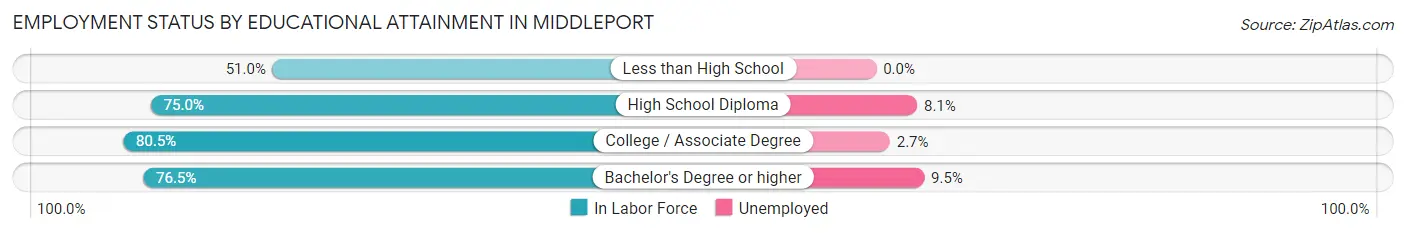
| Educational Attainment | In Labor Force | Unemployed |
| Less than High School | 50 (51.0%) | 0 (0.0%) |
| High School Diploma | 258 (75.0%) | 28 (8.1%) |
| College / Associate Degree | 260 (80.5%) | 9 (2.7%) |
| Bachelor's Degree or higher | 189 (76.5%) | 23 (9.5%) |
| Total | 757 (74.8%) | 62 (6.1%) |
Employment Occupations by Sex in Middleport
Management, Business, Science and Arts Occupations
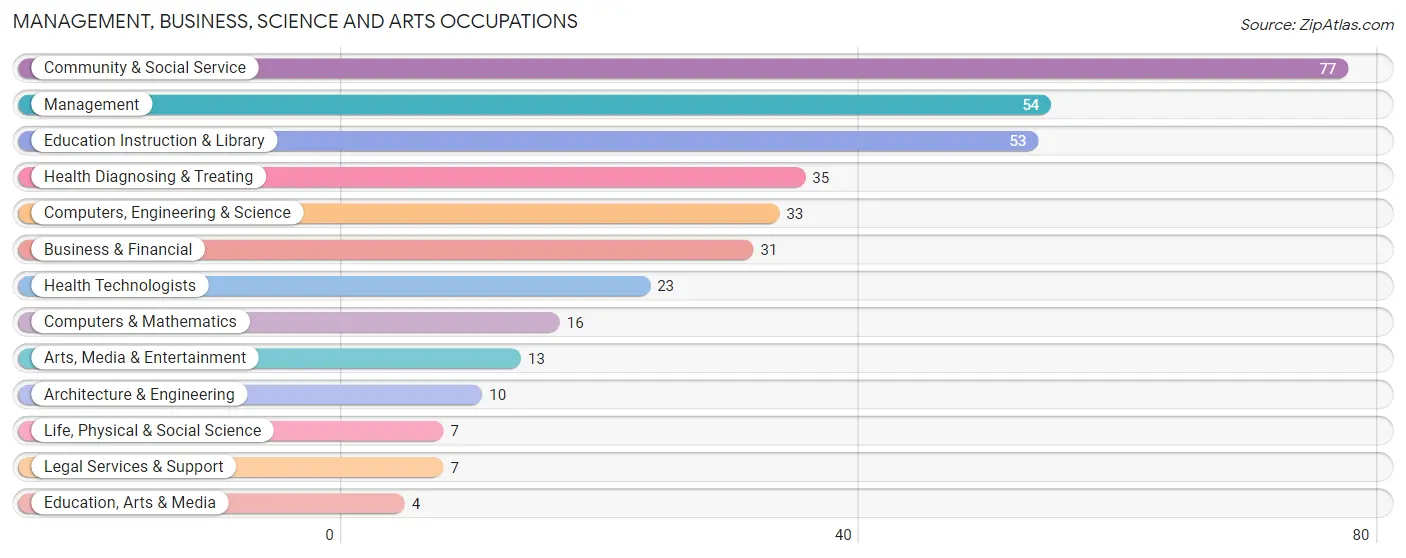
The most common Management, Business, Science and Arts occupations in Middleport are Community & Social Service (77 | 8.5%), Management (54 | 5.9%), Education Instruction & Library (53 | 5.8%), Health Diagnosing & Treating (35 | 3.8%), and Computers, Engineering & Science (33 | 3.6%).
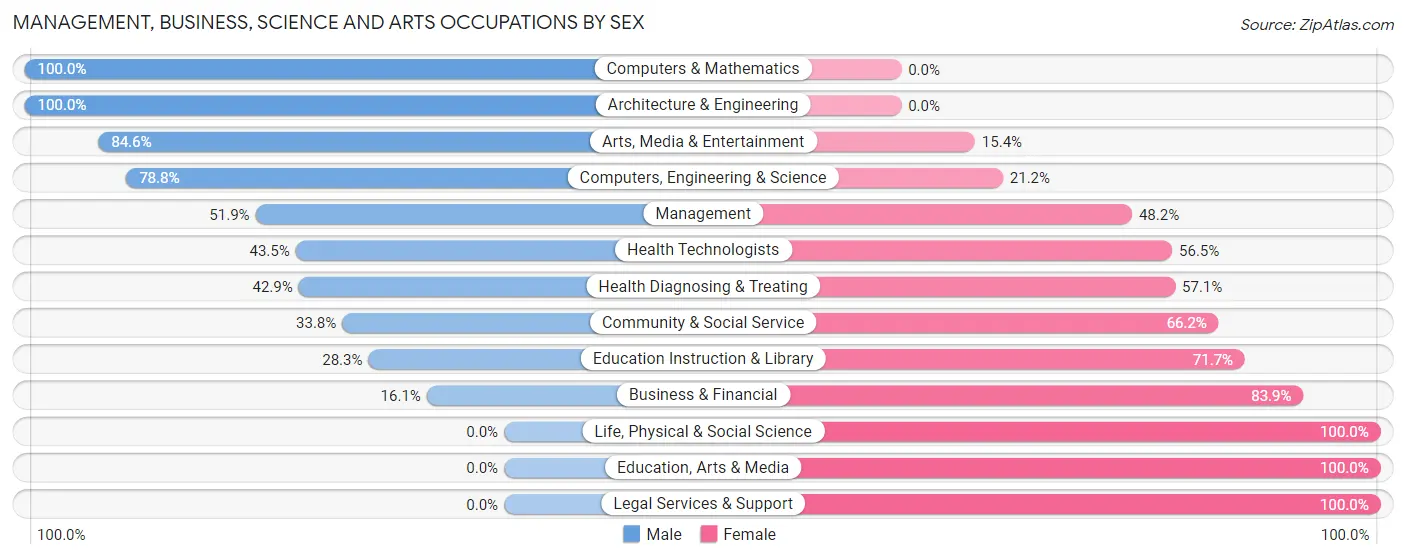
Management, Business, Science and Arts Occupations by Sex
Within the Management, Business, Science and Arts occupations in Middleport, the most male-oriented occupations are Computers & Mathematics (100.0%), Architecture & Engineering (100.0%), and Arts, Media & Entertainment (84.6%), while the most female-oriented occupations are Life, Physical & Social Science (100.0%), Education, Arts & Media (100.0%), and Legal Services & Support (100.0%).
| Occupation | Male | Female |
| Management | 28 (51.8%) | 26 (48.1%) |
| Business & Financial | 5 (16.1%) | 26 (83.9%) |
| Computers, Engineering & Science | 26 (78.8%) | 7 (21.2%) |
| Computers & Mathematics | 16 (100.0%) | 0 (0.0%) |
| Architecture & Engineering | 10 (100.0%) | 0 (0.0%) |
| Life, Physical & Social Science | 0 (0.0%) | 7 (100.0%) |
| Community & Social Service | 26 (33.8%) | 51 (66.2%) |
| Education, Arts & Media | 0 (0.0%) | 4 (100.0%) |
| Legal Services & Support | 0 (0.0%) | 7 (100.0%) |
| Education Instruction & Library | 15 (28.3%) | 38 (71.7%) |
| Arts, Media & Entertainment | 11 (84.6%) | 2 (15.4%) |
| Health Diagnosing & Treating | 15 (42.9%) | 20 (57.1%) |
| Health Technologists | 10 (43.5%) | 13 (56.5%) |
| Total (Category) | 100 (43.5%) | 130 (56.5%) |
| Total (Overall) | 455 (50.0%) | 455 (50.0%) |
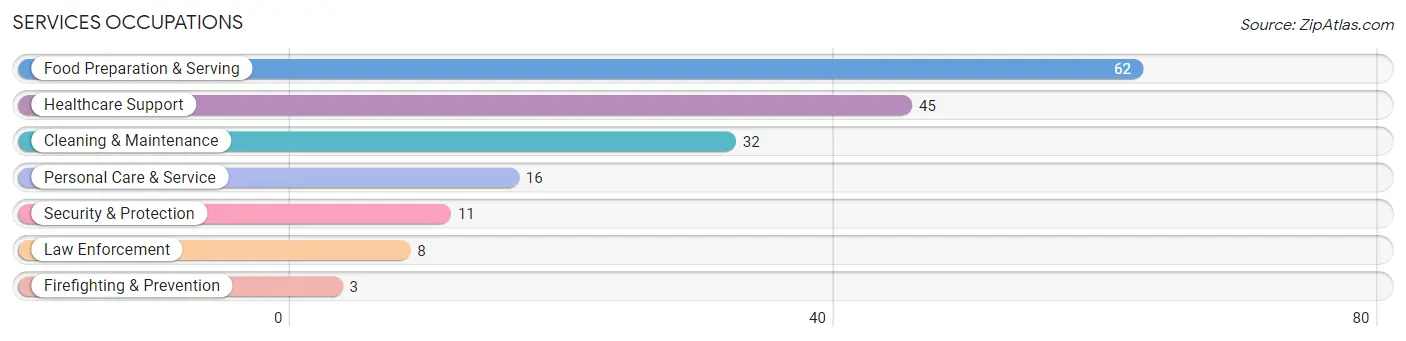
Services Occupations
The most common Services occupations in Middleport are Food Preparation & Serving (62 | 6.8%), Healthcare Support (45 | 5.0%), Cleaning & Maintenance (32 | 3.5%), Personal Care & Service (16 | 1.8%), and Security & Protection (11 | 1.2%).
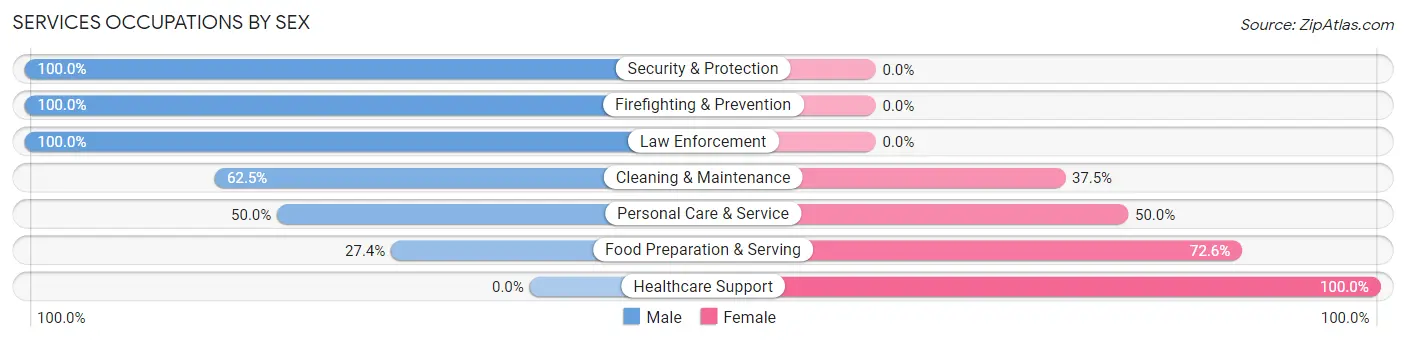
Services Occupations by Sex
Within the Services occupations in Middleport, the most male-oriented occupations are Security & Protection (100.0%), Firefighting & Prevention (100.0%), and Law Enforcement (100.0%), while the most female-oriented occupations are Healthcare Support (100.0%), Food Preparation & Serving (72.6%), and Personal Care & Service (50.0%).
| Occupation | Male | Female |
| Healthcare Support | 0 (0.0%) | 45 (100.0%) |
| Security & Protection | 11 (100.0%) | 0 (0.0%) |
| Firefighting & Prevention | 3 (100.0%) | 0 (0.0%) |
| Law Enforcement | 8 (100.0%) | 0 (0.0%) |
| Food Preparation & Serving | 17 (27.4%) | 45 (72.6%) |
| Cleaning & Maintenance | 20 (62.5%) | 12 (37.5%) |
| Personal Care & Service | 8 (50.0%) | 8 (50.0%) |
| Total (Category) | 56 (33.7%) | 110 (66.3%) |
| Total (Overall) | 455 (50.0%) | 455 (50.0%) |
Sales and Office Occupations
The most common Sales and Office occupations in Middleport are Office & Administration (140 | 15.4%), and Sales & Related (110 | 12.1%).
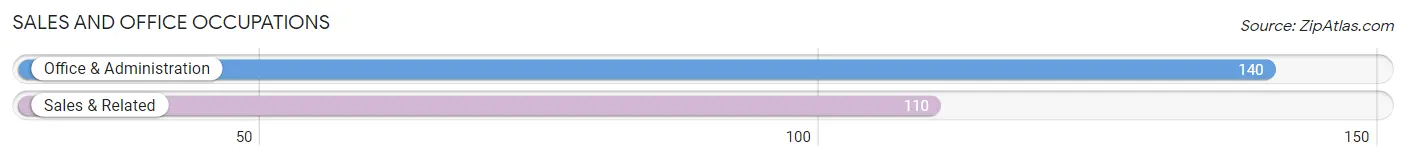
Sales and Office Occupations by Sex
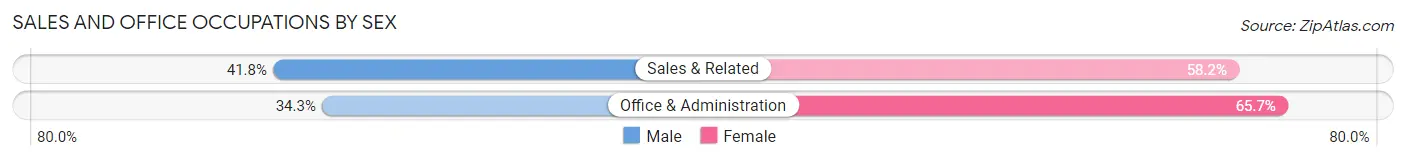
| Occupation | Male | Female |
| Sales & Related | 46 (41.8%) | 64 (58.2%) |
| Office & Administration | 48 (34.3%) | 92 (65.7%) |
| Total (Category) | 94 (37.6%) | 156 (62.4%) |
| Total (Overall) | 455 (50.0%) | 455 (50.0%) |
Natural Resources, Construction and Maintenance Occupations
The most common Natural Resources, Construction and Maintenance occupations in Middleport are Construction & Extraction (37 | 4.1%), Installation, Maintenance & Repair (25 | 2.8%), and Farming, Fishing & Forestry (22 | 2.4%).
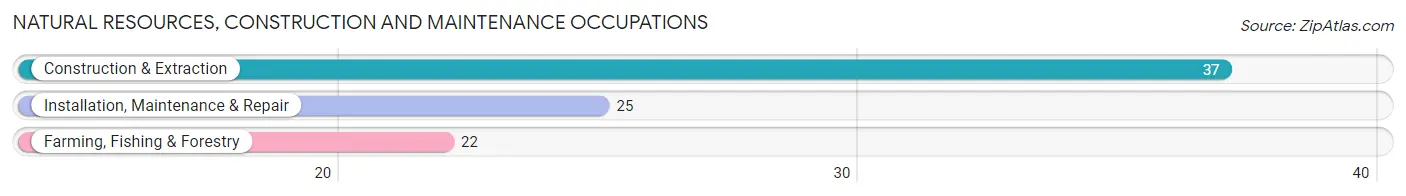
Natural Resources, Construction and Maintenance Occupations by Sex

| Occupation | Male | Female |
| Farming, Fishing & Forestry | 0 (0.0%) | 22 (100.0%) |
| Construction & Extraction | 37 (100.0%) | 0 (0.0%) |
| Installation, Maintenance & Repair | 25 (100.0%) | 0 (0.0%) |
| Total (Category) | 62 (73.8%) | 22 (26.2%) |
| Total (Overall) | 455 (50.0%) | 455 (50.0%) |
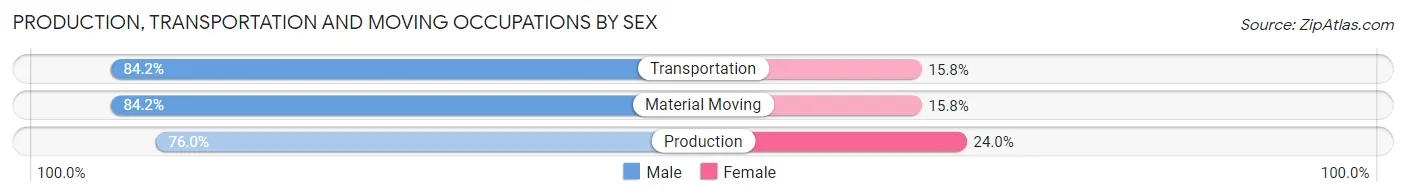
Production, Transportation and Moving Occupations
The most common Production, Transportation and Moving occupations in Middleport are Production (104 | 11.4%), Material Moving (57 | 6.3%), and Transportation (19 | 2.1%).
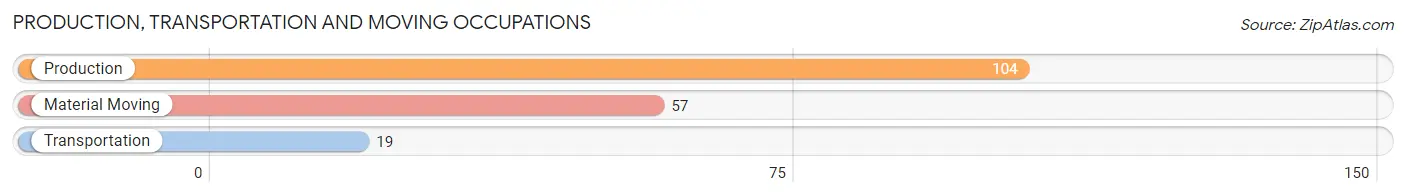
Production, Transportation and Moving Occupations by Sex
| Occupation | Male | Female |
| Production | 79 (76.0%) | 25 (24.0%) |
| Transportation | 16 (84.2%) | 3 (15.8%) |
| Material Moving | 48 (84.2%) | 9 (15.8%) |
| Total (Category) | 143 (79.4%) | 37 (20.6%) |
| Total (Overall) | 455 (50.0%) | 455 (50.0%) |
Employment Industries by Sex in Middleport
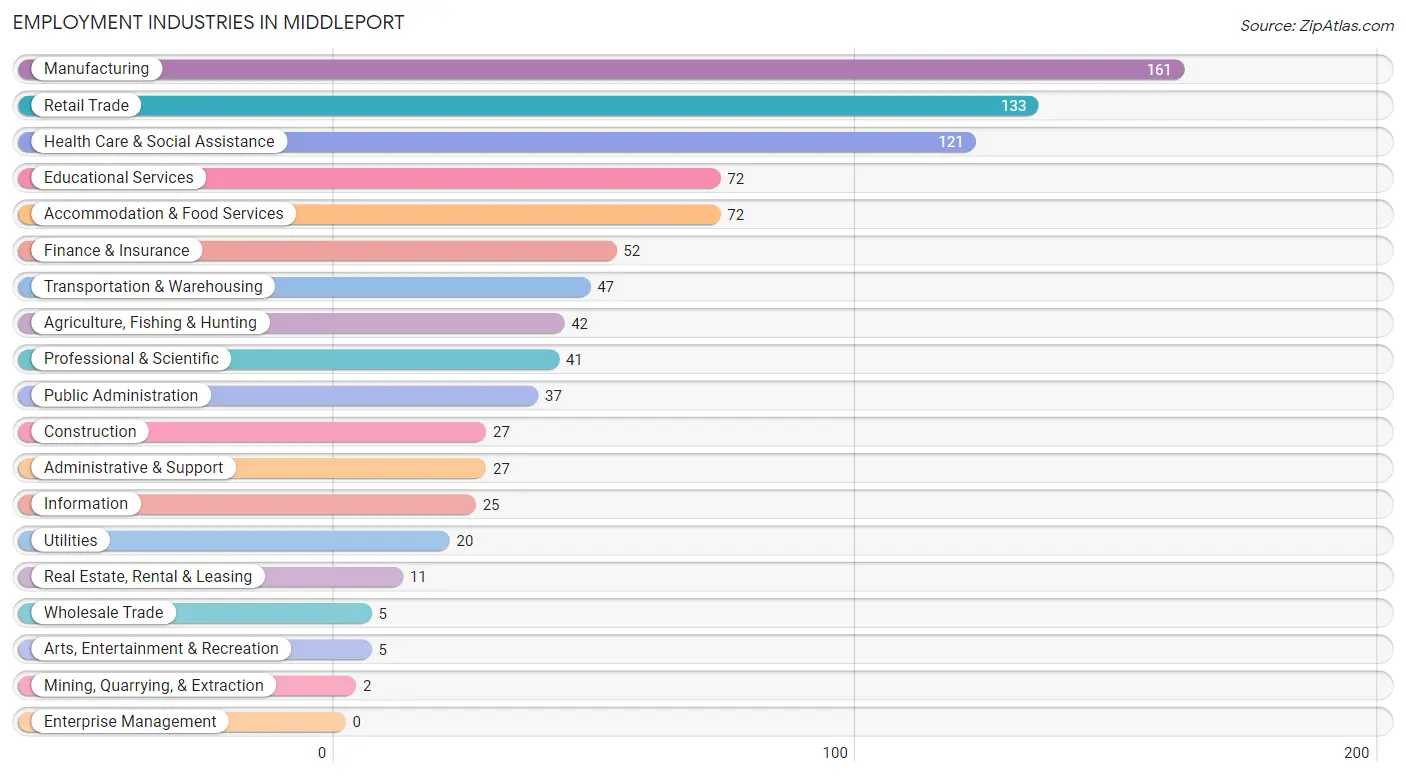
Employment Industries in Middleport
The major employment industries in Middleport include Manufacturing (161 | 17.7%), Retail Trade (133 | 14.6%), Health Care & Social Assistance (121 | 13.3%), Educational Services (72 | 7.9%), and Accommodation & Food Services (72 | 7.9%).
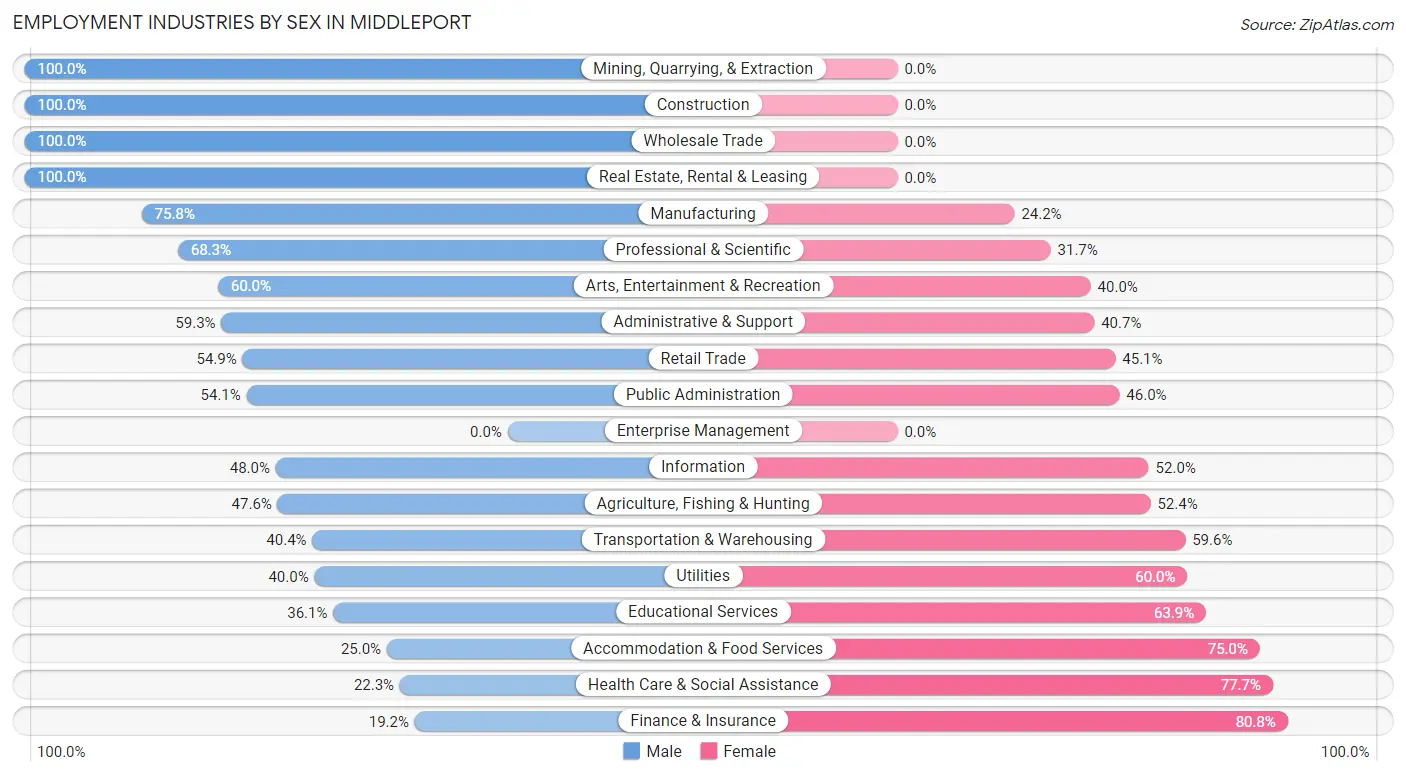
Employment Industries by Sex in Middleport
The Middleport industries that see more men than women are Mining, Quarrying, & Extraction (100.0%), Construction (100.0%), and Wholesale Trade (100.0%), whereas the industries that tend to have a higher number of women are Finance & Insurance (80.8%), Health Care & Social Assistance (77.7%), and Accommodation & Food Services (75.0%).
| Industry | Male | Female |
| Agriculture, Fishing & Hunting | 20 (47.6%) | 22 (52.4%) |
| Mining, Quarrying, & Extraction | 2 (100.0%) | 0 (0.0%) |
| Construction | 27 (100.0%) | 0 (0.0%) |
| Manufacturing | 122 (75.8%) | 39 (24.2%) |
| Wholesale Trade | 5 (100.0%) | 0 (0.0%) |
| Retail Trade | 73 (54.9%) | 60 (45.1%) |
| Transportation & Warehousing | 19 (40.4%) | 28 (59.6%) |
| Utilities | 8 (40.0%) | 12 (60.0%) |
| Information | 12 (48.0%) | 13 (52.0%) |
| Finance & Insurance | 10 (19.2%) | 42 (80.8%) |
| Real Estate, Rental & Leasing | 11 (100.0%) | 0 (0.0%) |
| Professional & Scientific | 28 (68.3%) | 13 (31.7%) |
| Enterprise Management | 0 (0.0%) | 0 (0.0%) |
| Administrative & Support | 16 (59.3%) | 11 (40.7%) |
| Educational Services | 26 (36.1%) | 46 (63.9%) |
| Health Care & Social Assistance | 27 (22.3%) | 94 (77.7%) |
| Arts, Entertainment & Recreation | 3 (60.0%) | 2 (40.0%) |
| Accommodation & Food Services | 18 (25.0%) | 54 (75.0%) |
| Public Administration | 20 (54.0%) | 17 (46.0%) |
| Total | 455 (50.0%) | 455 (50.0%) |
Education in Middleport
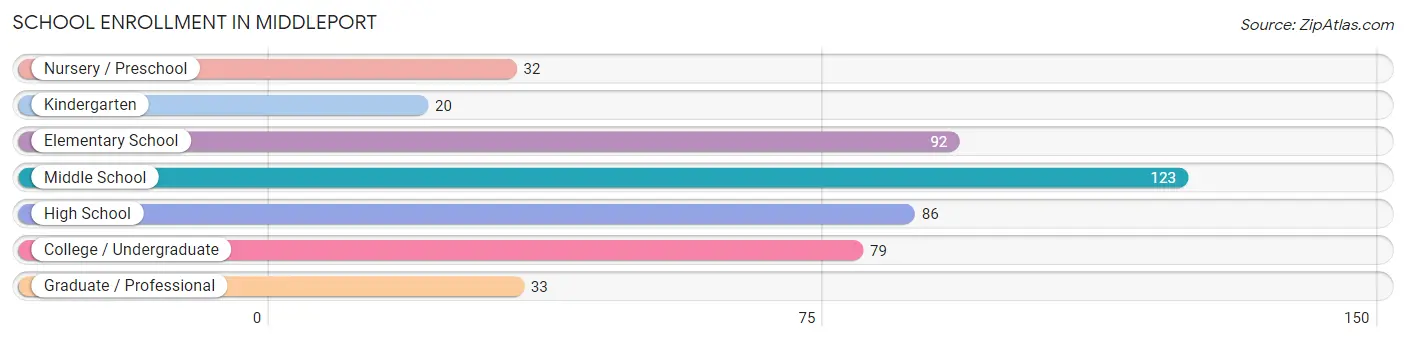
School Enrollment in Middleport
The most common levels of schooling among the 465 students in Middleport are middle school (123 | 26.5%), elementary school (92 | 19.8%), and high school (86 | 18.5%).
| School Level | # Students | % Students |
| Nursery / Preschool | 32 | 6.9% |
| Kindergarten | 20 | 4.3% |
| Elementary School | 92 | 19.8% |
| Middle School | 123 | 26.5% |
| High School | 86 | 18.5% |
| College / Undergraduate | 79 | 17.0% |
| Graduate / Professional | 33 | 7.1% |
| Total | 465 | 100.0% |
School Enrollment by Age by Funding Source in Middleport
Out of a total of 465 students who are enrolled in schools in Middleport, 58 (12.5%) attend a private institution, while the remaining 407 (87.5%) are enrolled in public schools. The age group of 20 to 24 year olds has the highest likelihood of being enrolled in private schools, with 21 (45.7% in the age bracket) enrolled. Conversely, the age group of 15 to 17 year olds has the lowest likelihood of being enrolled in a private school, with 82 (100.0% in the age bracket) attending a public institution.
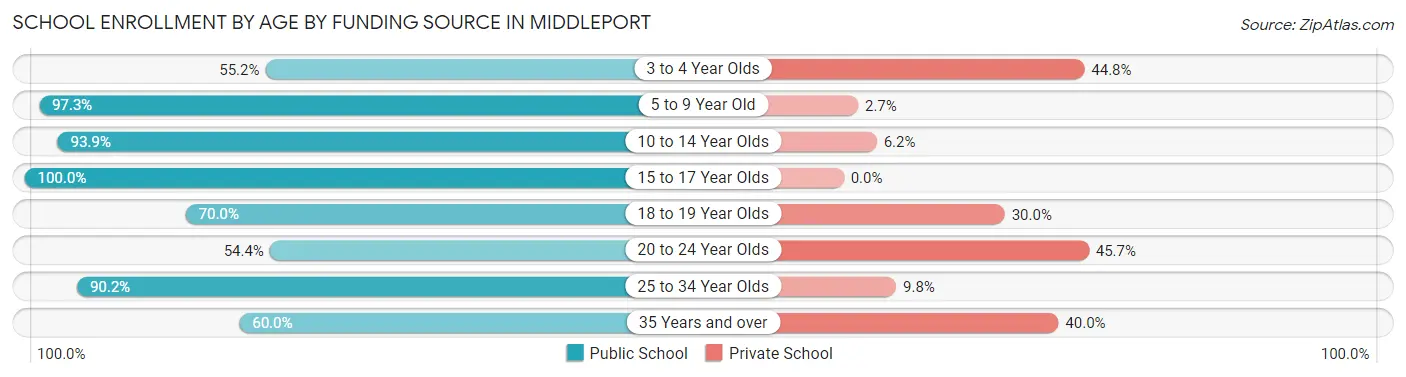
| Age Bracket | Public School | Private School |
| 3 to 4 Year Olds | 16 (55.2%) | 13 (44.8%) |
| 5 to 9 Year Old | 109 (97.3%) | 3 (2.7%) |
| 10 to 14 Year Olds | 122 (93.9%) | 8 (6.1%) |
| 15 to 17 Year Olds | 82 (100.0%) | 0 (0.0%) |
| 18 to 19 Year Olds | 7 (70.0%) | 3 (30.0%) |
| 20 to 24 Year Olds | 25 (54.3%) | 21 (45.7%) |
| 25 to 34 Year Olds | 37 (90.2%) | 4 (9.8%) |
| 35 Years and over | 9 (60.0%) | 6 (40.0%) |
| Total | 407 (87.5%) | 58 (12.5%) |
Educational Attainment by Field of Study in Middleport
Education (51 | 16.3%), arts & humanities (49 | 15.7%), business (36 | 11.5%), literature & languages (31 | 9.9%), and science & technology (23 | 7.3%) are the most common fields of study among 313 individuals in Middleport who have obtained a bachelor's degree or higher.
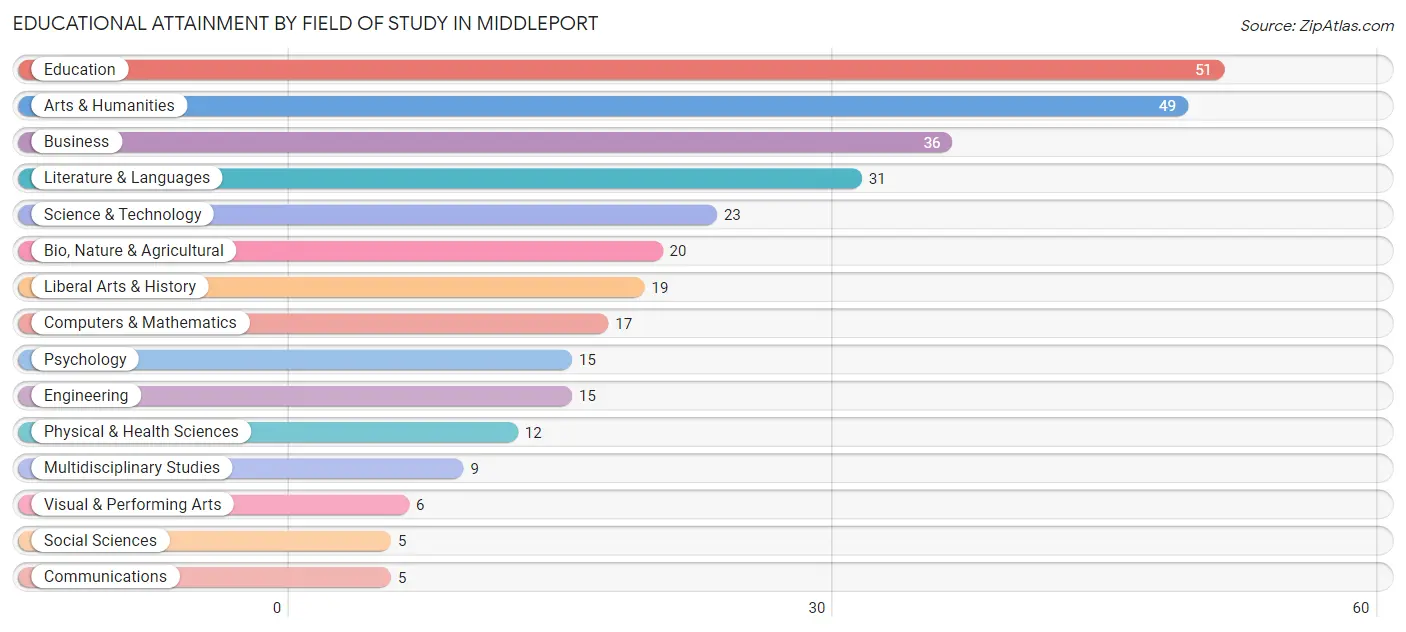
| Field of Study | # Graduates | % Graduates |
| Computers & Mathematics | 17 | 5.4% |
| Bio, Nature & Agricultural | 20 | 6.4% |
| Physical & Health Sciences | 12 | 3.8% |
| Psychology | 15 | 4.8% |
| Social Sciences | 5 | 1.6% |
| Engineering | 15 | 4.8% |
| Multidisciplinary Studies | 9 | 2.9% |
| Science & Technology | 23 | 7.3% |
| Business | 36 | 11.5% |
| Education | 51 | 16.3% |
| Literature & Languages | 31 | 9.9% |
| Liberal Arts & History | 19 | 6.1% |
| Visual & Performing Arts | 6 | 1.9% |
| Communications | 5 | 1.6% |
| Arts & Humanities | 49 | 15.7% |
| Total | 313 | 100.0% |
Transportation & Commute in Middleport
Vehicle Availability by Sex in Middleport
The most prevalent vehicle ownership categories in Middleport are males with 2 vehicles (175, accounting for 39.8%) and females with 2 vehicles (160, making up 39.6%).
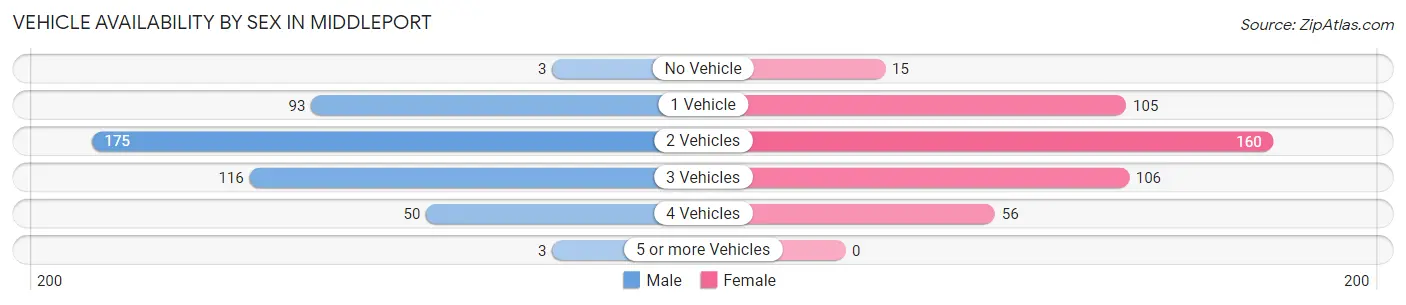
| Vehicles Available | Male | Female |
| No Vehicle | 3 (0.7%) | 15 (3.4%) |
| 1 Vehicle | 93 (21.1%) | 105 (23.8%) |
| 2 Vehicles | 175 (39.8%) | 160 (36.2%) |
| 3 Vehicles | 116 (26.4%) | 106 (24.0%) |
| 4 Vehicles | 50 (11.4%) | 56 (12.7%) |
| 5 or more Vehicles | 3 (0.7%) | 0 (0.0%) |
| Total | 440 (100.0%) | 442 (100.0%) |
Commute Time in Middleport
The most frequently occuring commute durations in Middleport are 20 to 24 minutes (128 commuters, 15.4%), 45 to 59 minutes (123 commuters, 14.8%), and 5 to 9 minutes (92 commuters, 11.1%).
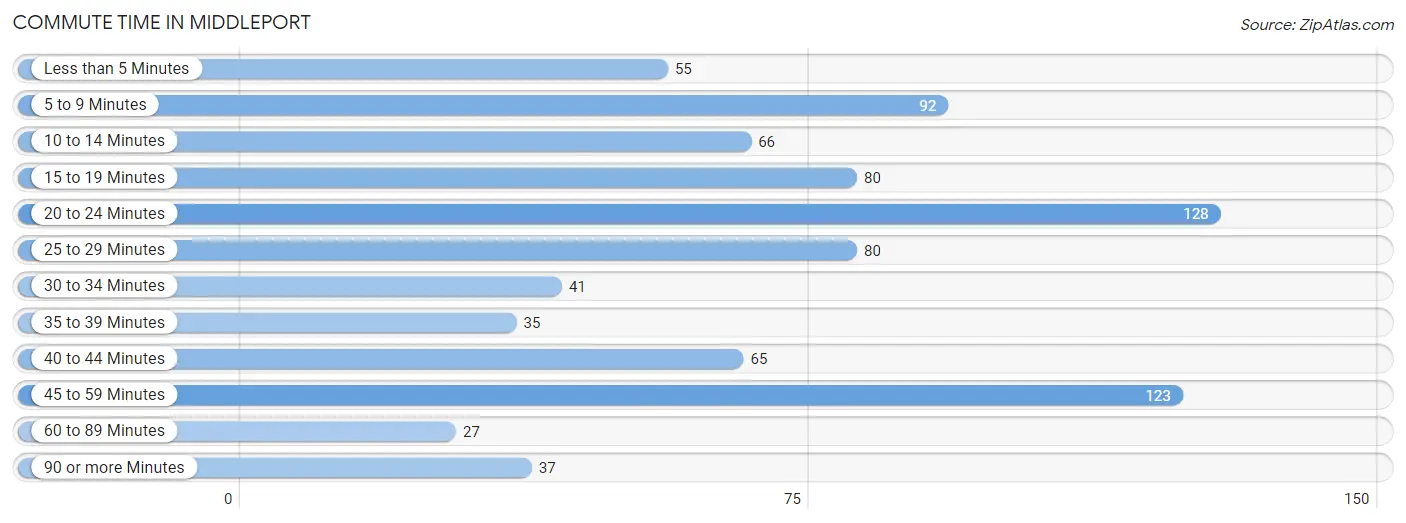
| Commute Time | # Commuters | % Commuters |
| Less than 5 Minutes | 55 | 6.6% |
| 5 to 9 Minutes | 92 | 11.1% |
| 10 to 14 Minutes | 66 | 8.0% |
| 15 to 19 Minutes | 80 | 9.7% |
| 20 to 24 Minutes | 128 | 15.4% |
| 25 to 29 Minutes | 80 | 9.7% |
| 30 to 34 Minutes | 41 | 5.0% |
| 35 to 39 Minutes | 35 | 4.2% |
| 40 to 44 Minutes | 65 | 7.8% |
| 45 to 59 Minutes | 123 | 14.8% |
| 60 to 89 Minutes | 27 | 3.3% |
| 90 or more Minutes | 37 | 4.5% |
Commute Time by Sex in Middleport
The most common commute times in Middleport are 45 to 59 minutes (74 commuters, 17.3%) for males and 20 to 24 minutes (60 commuters, 15.0%) for females.
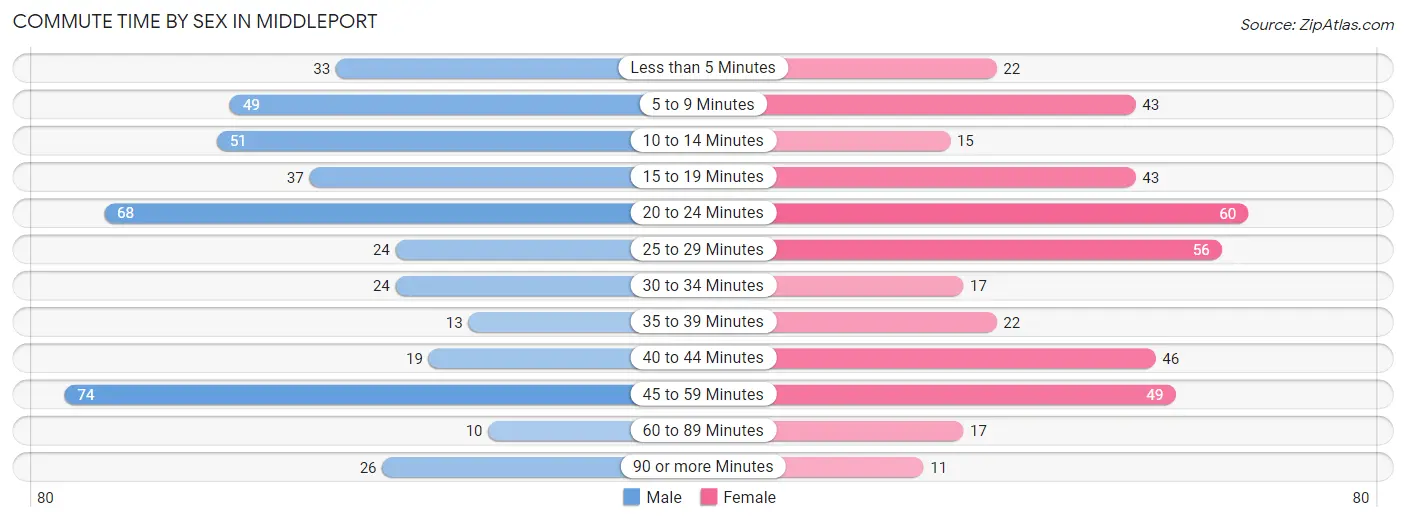
| Commute Time | Male | Female |
| Less than 5 Minutes | 33 (7.7%) | 22 (5.5%) |
| 5 to 9 Minutes | 49 (11.5%) | 43 (10.7%) |
| 10 to 14 Minutes | 51 (11.9%) | 15 (3.7%) |
| 15 to 19 Minutes | 37 (8.6%) | 43 (10.7%) |
| 20 to 24 Minutes | 68 (15.9%) | 60 (15.0%) |
| 25 to 29 Minutes | 24 (5.6%) | 56 (14.0%) |
| 30 to 34 Minutes | 24 (5.6%) | 17 (4.2%) |
| 35 to 39 Minutes | 13 (3.0%) | 22 (5.5%) |
| 40 to 44 Minutes | 19 (4.4%) | 46 (11.5%) |
| 45 to 59 Minutes | 74 (17.3%) | 49 (12.2%) |
| 60 to 89 Minutes | 10 (2.3%) | 17 (4.2%) |
| 90 or more Minutes | 26 (6.1%) | 11 (2.7%) |
Time of Departure to Work by Sex in Middleport
The most frequent times of departure to work in Middleport are 7:00 AM to 7:29 AM (84, 19.6%) for males and 7:00 AM to 7:29 AM (65, 16.2%) for females.
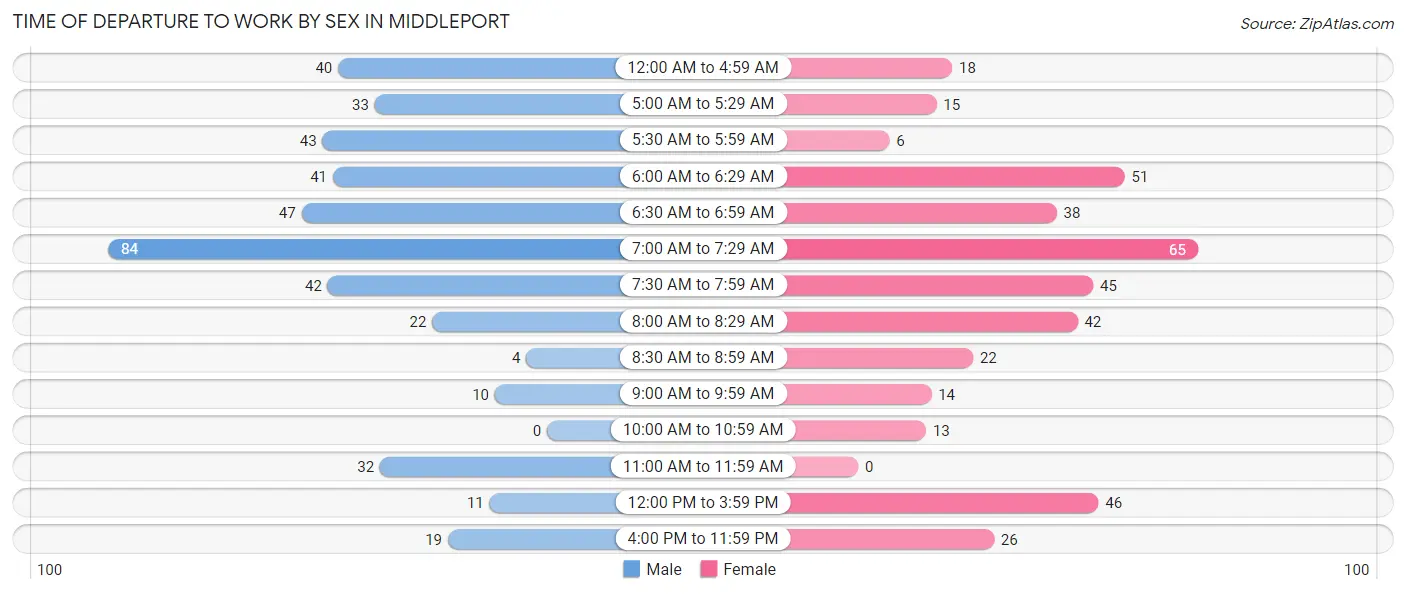
| Time of Departure | Male | Female |
| 12:00 AM to 4:59 AM | 40 (9.3%) | 18 (4.5%) |
| 5:00 AM to 5:29 AM | 33 (7.7%) | 15 (3.7%) |
| 5:30 AM to 5:59 AM | 43 (10.1%) | 6 (1.5%) |
| 6:00 AM to 6:29 AM | 41 (9.6%) | 51 (12.7%) |
| 6:30 AM to 6:59 AM | 47 (11.0%) | 38 (9.5%) |
| 7:00 AM to 7:29 AM | 84 (19.6%) | 65 (16.2%) |
| 7:30 AM to 7:59 AM | 42 (9.8%) | 45 (11.2%) |
| 8:00 AM to 8:29 AM | 22 (5.1%) | 42 (10.5%) |
| 8:30 AM to 8:59 AM | 4 (0.9%) | 22 (5.5%) |
| 9:00 AM to 9:59 AM | 10 (2.3%) | 14 (3.5%) |
| 10:00 AM to 10:59 AM | 0 (0.0%) | 13 (3.2%) |
| 11:00 AM to 11:59 AM | 32 (7.5%) | 0 (0.0%) |
| 12:00 PM to 3:59 PM | 11 (2.6%) | 46 (11.5%) |
| 4:00 PM to 11:59 PM | 19 (4.4%) | 26 (6.5%) |
| Total | 428 (100.0%) | 401 (100.0%) |
Housing Occupancy in Middleport
Occupancy by Ownership in Middleport
Of the total 754 dwellings in Middleport, owner-occupied units account for 518 (68.7%), while renter-occupied units make up 236 (31.3%).
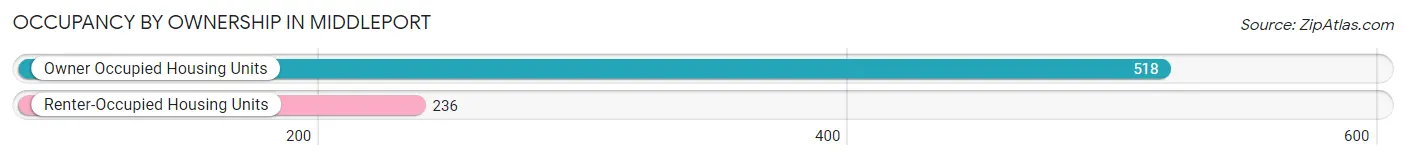
| Occupancy | # Housing Units | % Housing Units |
| Owner Occupied Housing Units | 518 | 68.7% |
| Renter-Occupied Housing Units | 236 | 31.3% |
| Total Occupied Housing Units | 754 | 100.0% |
Occupancy by Household Size in Middleport
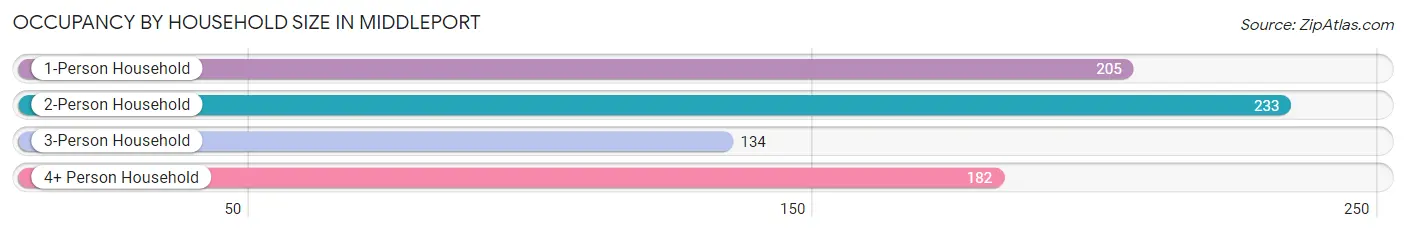
| Household Size | # Housing Units | % Housing Units |
| 1-Person Household | 205 | 27.2% |
| 2-Person Household | 233 | 30.9% |
| 3-Person Household | 134 | 17.8% |
| 4+ Person Household | 182 | 24.1% |
| Total Housing Units | 754 | 100.0% |
Occupancy by Ownership by Household Size in Middleport
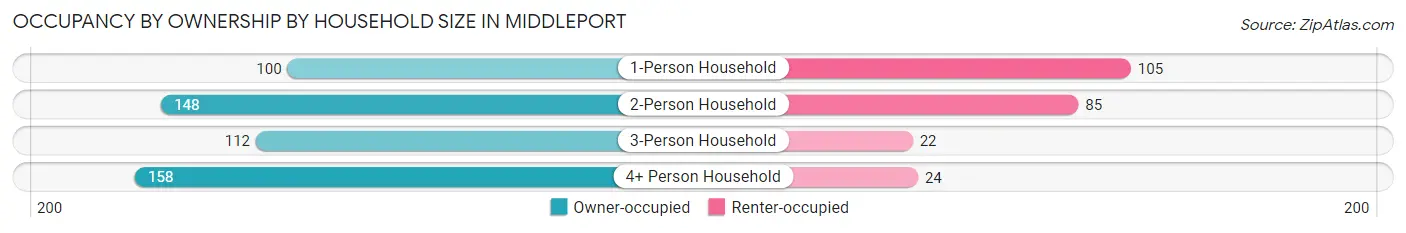
| Household Size | Owner-occupied | Renter-occupied |
| 1-Person Household | 100 (48.8%) | 105 (51.2%) |
| 2-Person Household | 148 (63.5%) | 85 (36.5%) |
| 3-Person Household | 112 (83.6%) | 22 (16.4%) |
| 4+ Person Household | 158 (86.8%) | 24 (13.2%) |
| Total Housing Units | 518 (68.7%) | 236 (31.3%) |
Occupancy by Educational Attainment in Middleport
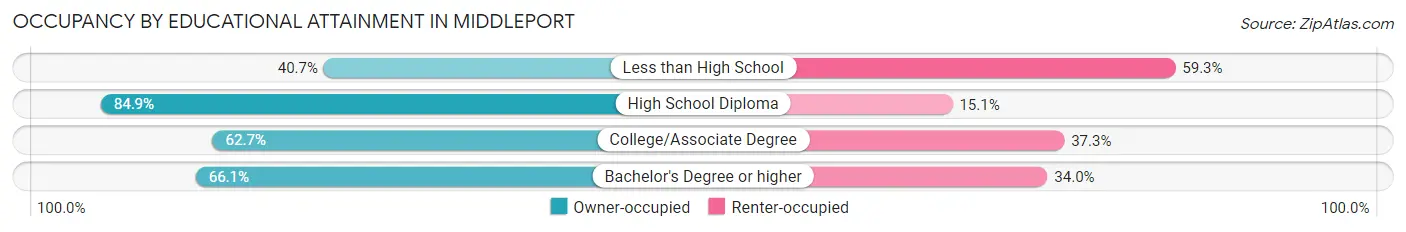
| Household Size | Owner-occupied | Renter-occupied |
| Less than High School | 24 (40.7%) | 35 (59.3%) |
| High School Diploma | 202 (84.9%) | 36 (15.1%) |
| College/Associate Degree | 185 (62.7%) | 110 (37.3%) |
| Bachelor's Degree or higher | 107 (66.0%) | 55 (34.0%) |
Occupancy by Age of Householder in Middleport
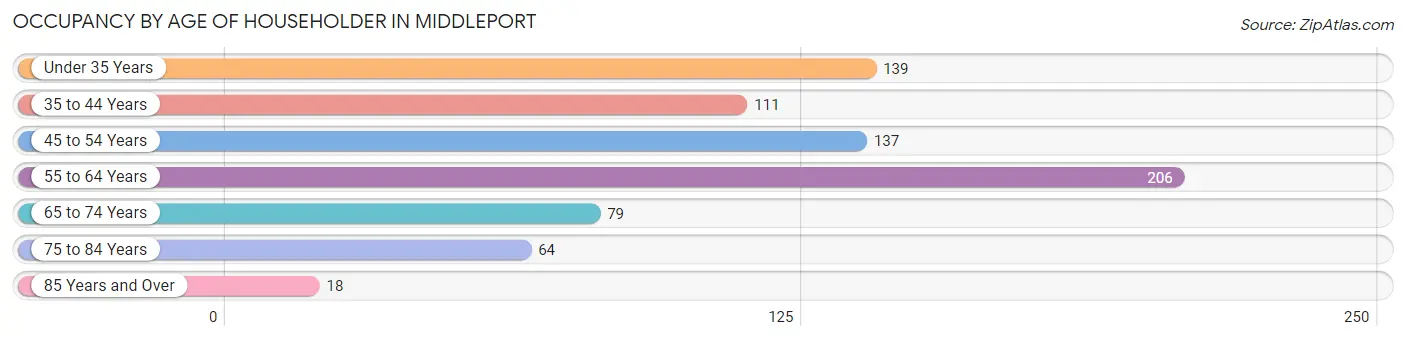
| Age Bracket | # Households | % Households |
| Under 35 Years | 139 | 18.4% |
| 35 to 44 Years | 111 | 14.7% |
| 45 to 54 Years | 137 | 18.2% |
| 55 to 64 Years | 206 | 27.3% |
| 65 to 74 Years | 79 | 10.5% |
| 75 to 84 Years | 64 | 8.5% |
| 85 Years and Over | 18 | 2.4% |
| Total | 754 | 100.0% |
Housing Finances in Middleport
Median Income by Occupancy in Middleport
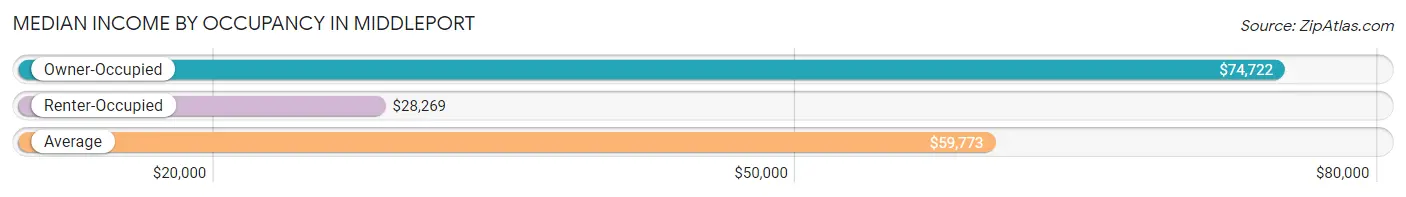
| Occupancy Type | # Households | Median Income |
| Owner-Occupied | 518 (68.7%) | $74,722 |
| Renter-Occupied | 236 (31.3%) | $28,269 |
| Average | 754 (100.0%) | $59,773 |
Occupancy by Householder Income Bracket in Middleport
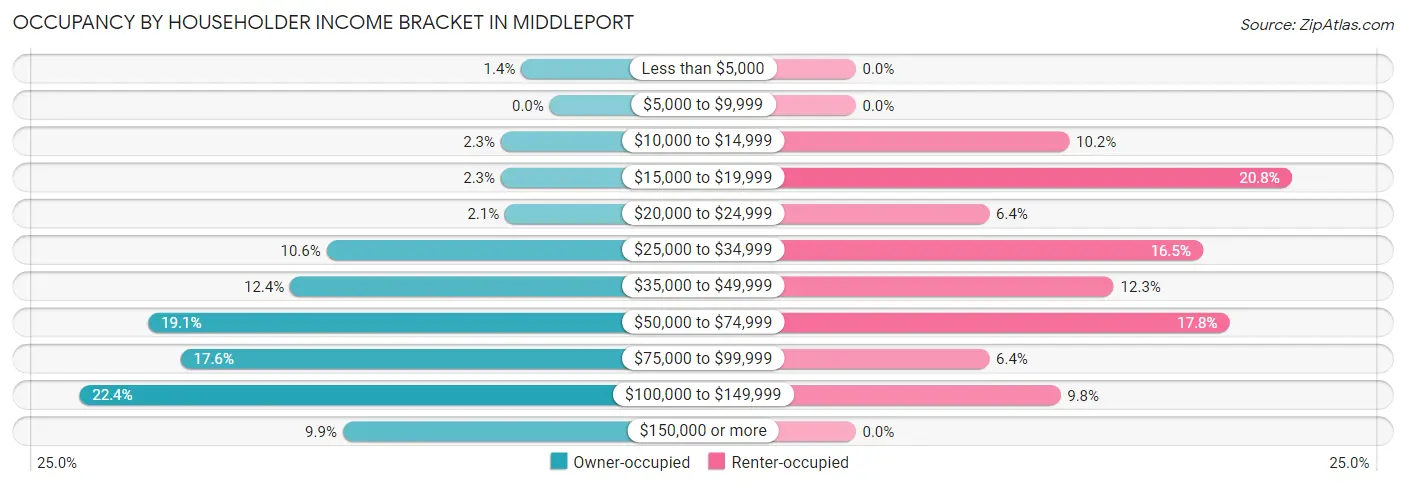
| Income Bracket | Owner-occupied | Renter-occupied |
| Less than $5,000 | 7 (1.3%) | 0 (0.0%) |
| $5,000 to $9,999 | 0 (0.0%) | 0 (0.0%) |
| $10,000 to $14,999 | 12 (2.3%) | 24 (10.2%) |
| $15,000 to $19,999 | 12 (2.3%) | 49 (20.8%) |
| $20,000 to $24,999 | 11 (2.1%) | 15 (6.4%) |
| $25,000 to $34,999 | 55 (10.6%) | 39 (16.5%) |
| $35,000 to $49,999 | 64 (12.4%) | 29 (12.3%) |
| $50,000 to $74,999 | 99 (19.1%) | 42 (17.8%) |
| $75,000 to $99,999 | 91 (17.6%) | 15 (6.4%) |
| $100,000 to $149,999 | 116 (22.4%) | 23 (9.8%) |
| $150,000 or more | 51 (9.9%) | 0 (0.0%) |
| Total | 518 (100.0%) | 236 (100.0%) |
Monthly Housing Cost Tiers in Middleport
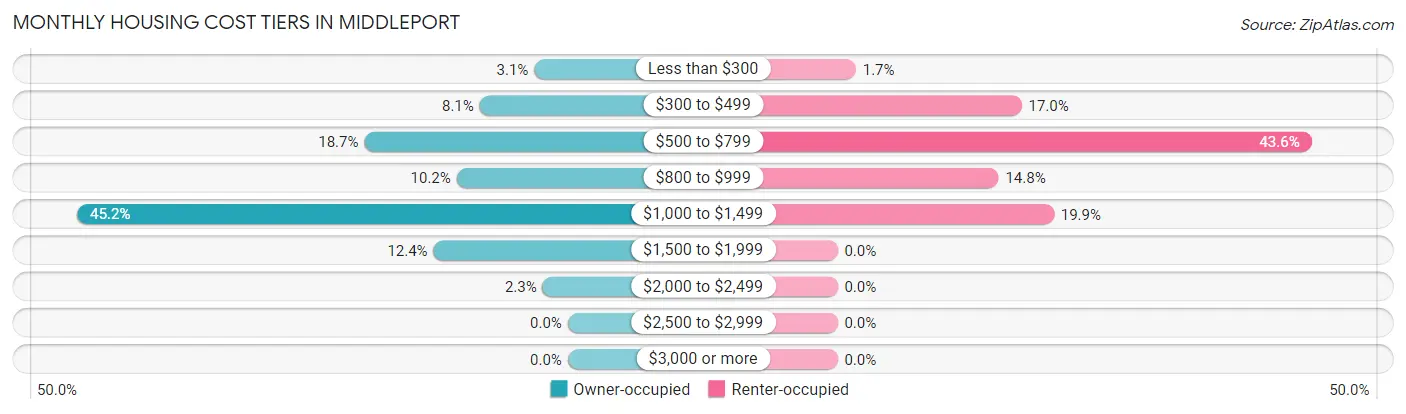
| Monthly Cost | Owner-occupied | Renter-occupied |
| Less than $300 | 16 (3.1%) | 4 (1.7%) |
| $300 to $499 | 42 (8.1%) | 40 (17.0%) |
| $500 to $799 | 97 (18.7%) | 103 (43.6%) |
| $800 to $999 | 53 (10.2%) | 35 (14.8%) |
| $1,000 to $1,499 | 234 (45.2%) | 47 (19.9%) |
| $1,500 to $1,999 | 64 (12.4%) | 0 (0.0%) |
| $2,000 to $2,499 | 12 (2.3%) | 0 (0.0%) |
| $2,500 to $2,999 | 0 (0.0%) | 0 (0.0%) |
| $3,000 or more | 0 (0.0%) | 0 (0.0%) |
| Total | 518 (100.0%) | 236 (100.0%) |
Physical Housing Characteristics in Middleport
Housing Structures in Middleport
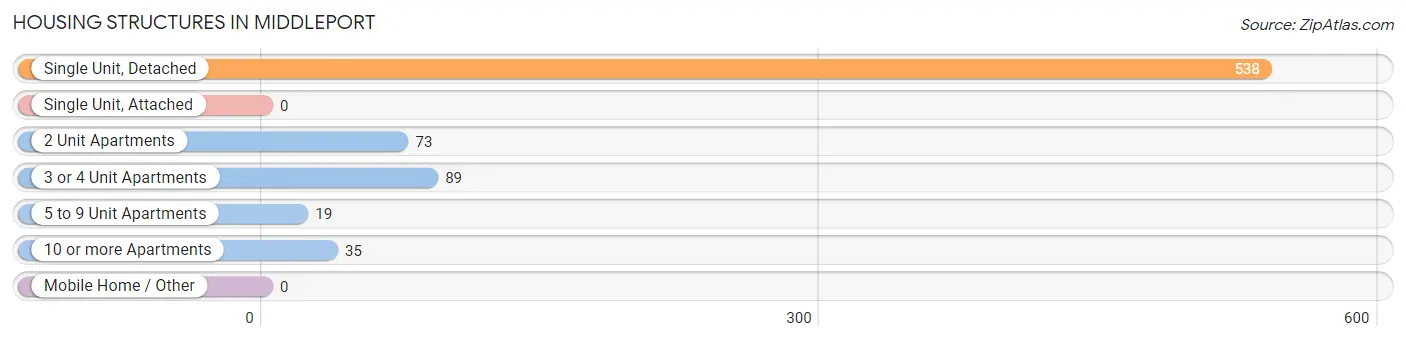
| Structure Type | # Housing Units | % Housing Units |
| Single Unit, Detached | 538 | 71.4% |
| Single Unit, Attached | 0 | 0.0% |
| 2 Unit Apartments | 73 | 9.7% |
| 3 or 4 Unit Apartments | 89 | 11.8% |
| 5 to 9 Unit Apartments | 19 | 2.5% |
| 10 or more Apartments | 35 | 4.6% |
| Mobile Home / Other | 0 | 0.0% |
| Total | 754 | 100.0% |
Housing Structures by Occupancy in Middleport
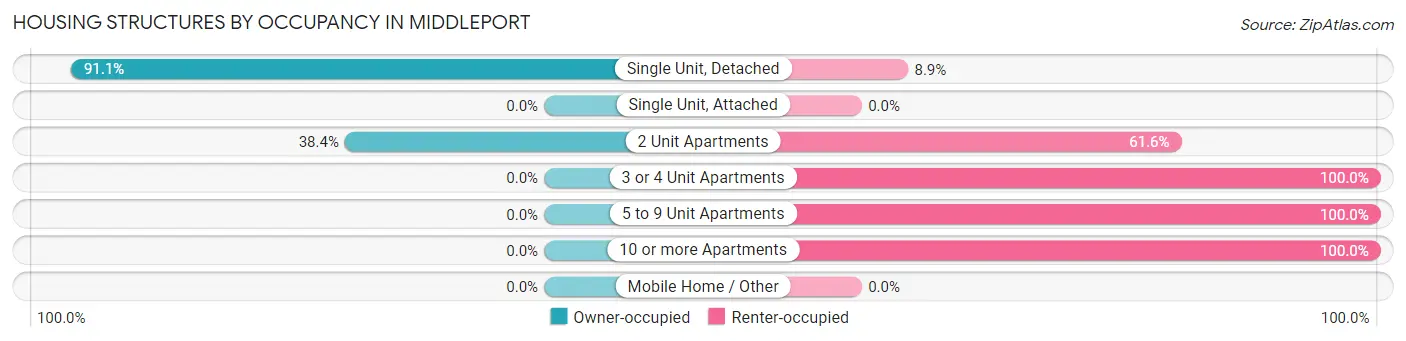
| Structure Type | Owner-occupied | Renter-occupied |
| Single Unit, Detached | 490 (91.1%) | 48 (8.9%) |
| Single Unit, Attached | 0 (0.0%) | 0 (0.0%) |
| 2 Unit Apartments | 28 (38.4%) | 45 (61.6%) |
| 3 or 4 Unit Apartments | 0 (0.0%) | 89 (100.0%) |
| 5 to 9 Unit Apartments | 0 (0.0%) | 19 (100.0%) |
| 10 or more Apartments | 0 (0.0%) | 35 (100.0%) |
| Mobile Home / Other | 0 (0.0%) | 0 (0.0%) |
| Total | 518 (68.7%) | 236 (31.3%) |
Housing Structures by Number of Rooms in Middleport
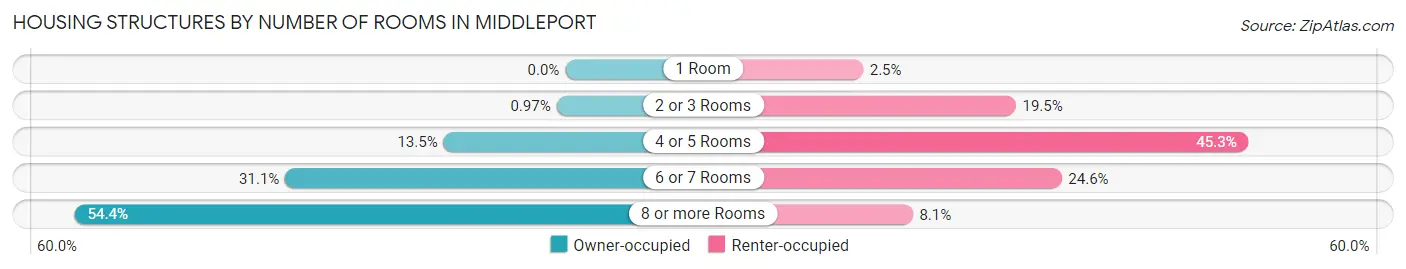
| Number of Rooms | Owner-occupied | Renter-occupied |
| 1 Room | 0 (0.0%) | 6 (2.5%) |
| 2 or 3 Rooms | 5 (1.0%) | 46 (19.5%) |
| 4 or 5 Rooms | 70 (13.5%) | 107 (45.3%) |
| 6 or 7 Rooms | 161 (31.1%) | 58 (24.6%) |
| 8 or more Rooms | 282 (54.4%) | 19 (8.1%) |
| Total | 518 (100.0%) | 236 (100.0%) |
Housing Structure by Heating Type in Middleport
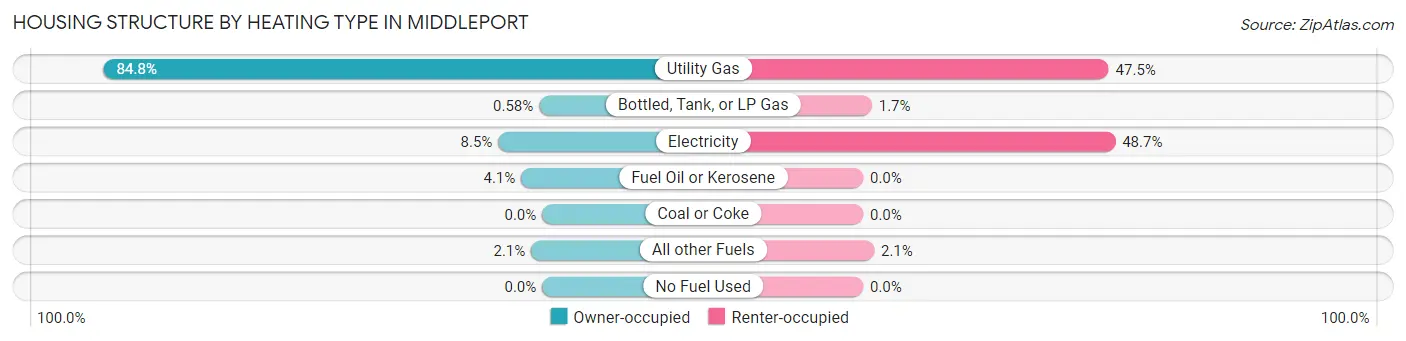
| Heating Type | Owner-occupied | Renter-occupied |
| Utility Gas | 439 (84.8%) | 112 (47.5%) |
| Bottled, Tank, or LP Gas | 3 (0.6%) | 4 (1.7%) |
| Electricity | 44 (8.5%) | 115 (48.7%) |
| Fuel Oil or Kerosene | 21 (4.1%) | 0 (0.0%) |
| Coal or Coke | 0 (0.0%) | 0 (0.0%) |
| All other Fuels | 11 (2.1%) | 5 (2.1%) |
| No Fuel Used | 0 (0.0%) | 0 (0.0%) |
| Total | 518 (100.0%) | 236 (100.0%) |
Household Vehicle Usage in Middleport
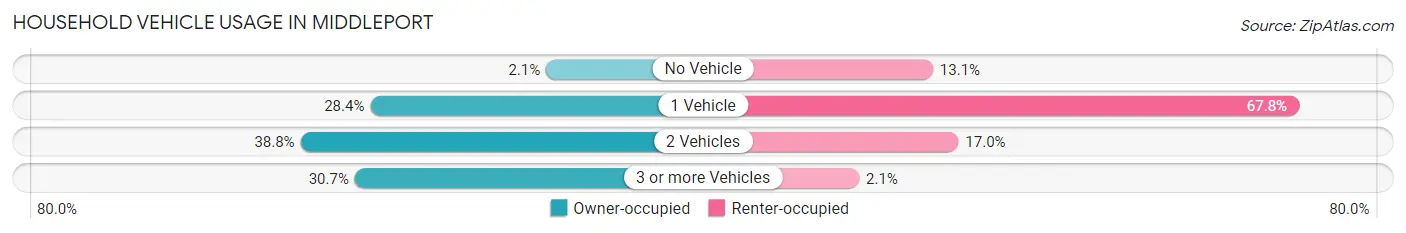
| Vehicles per Household | Owner-occupied | Renter-occupied |
| No Vehicle | 11 (2.1%) | 31 (13.1%) |
| 1 Vehicle | 147 (28.4%) | 160 (67.8%) |
| 2 Vehicles | 201 (38.8%) | 40 (17.0%) |
| 3 or more Vehicles | 159 (30.7%) | 5 (2.1%) |
| Total | 518 (100.0%) | 236 (100.0%) |
Real Estate & Mortgages in Middleport
Real Estate and Mortgage Overview in Middleport
| Characteristic | Without Mortgage | With Mortgage |
| Housing Units | 168 | 350 |
| Median Property Value | $104,900 | $107,100 |
| Median Household Income | $57,500 | $43 |
| Monthly Housing Costs | $581 | $0 |
| Real Estate Taxes | $3,063 | $3 |
Property Value by Mortgage Status in Middleport
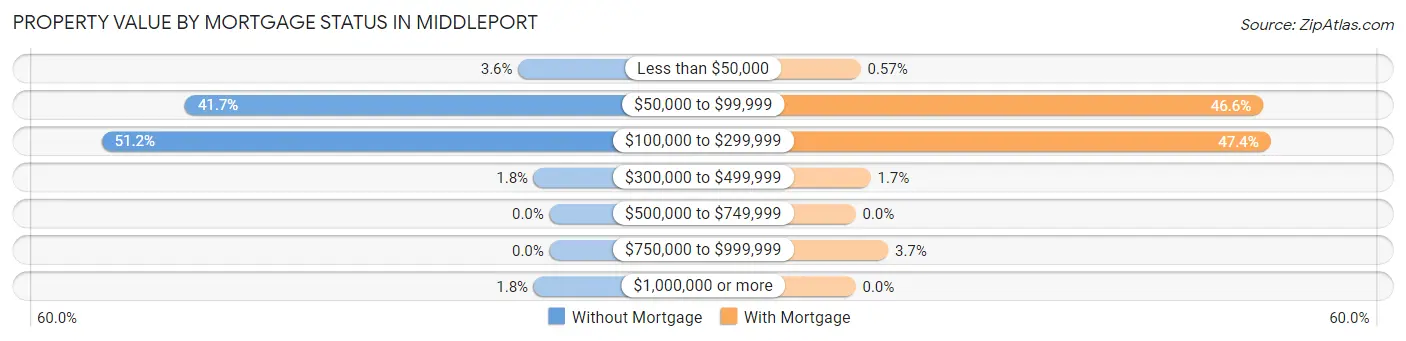
| Property Value | Without Mortgage | With Mortgage |
| Less than $50,000 | 6 (3.6%) | 2 (0.6%) |
| $50,000 to $99,999 | 70 (41.7%) | 163 (46.6%) |
| $100,000 to $299,999 | 86 (51.2%) | 166 (47.4%) |
| $300,000 to $499,999 | 3 (1.8%) | 6 (1.7%) |
| $500,000 to $749,999 | 0 (0.0%) | 0 (0.0%) |
| $750,000 to $999,999 | 0 (0.0%) | 13 (3.7%) |
| $1,000,000 or more | 3 (1.8%) | 0 (0.0%) |
| Total | 168 (100.0%) | 350 (100.0%) |
Household Income by Mortgage Status in Middleport
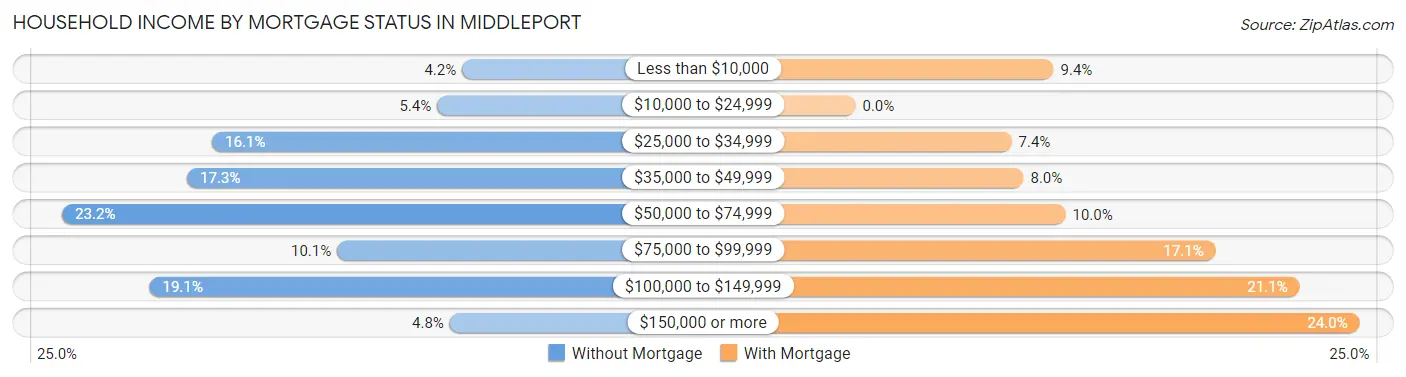
| Household Income | Without Mortgage | With Mortgage |
| Less than $10,000 | 7 (4.2%) | 33 (9.4%) |
| $10,000 to $24,999 | 9 (5.4%) | 0 (0.0%) |
| $25,000 to $34,999 | 27 (16.1%) | 26 (7.4%) |
| $35,000 to $49,999 | 29 (17.3%) | 28 (8.0%) |
| $50,000 to $74,999 | 39 (23.2%) | 35 (10.0%) |
| $75,000 to $99,999 | 17 (10.1%) | 60 (17.1%) |
| $100,000 to $149,999 | 32 (19.1%) | 74 (21.1%) |
| $150,000 or more | 8 (4.8%) | 84 (24.0%) |
| Total | 168 (100.0%) | 350 (100.0%) |
Property Value to Household Income Ratio in Middleport
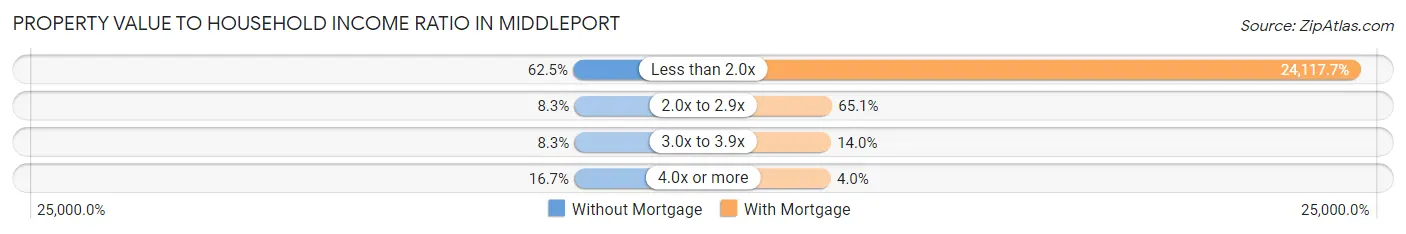
| Value-to-Income Ratio | Without Mortgage | With Mortgage |
| Less than 2.0x | 105 (62.5%) | 84,412 (24,117.7%) |
| 2.0x to 2.9x | 14 (8.3%) | 228 (65.1%) |
| 3.0x to 3.9x | 14 (8.3%) | 49 (14.0%) |
| 4.0x or more | 28 (16.7%) | 14 (4.0%) |
| Total | 168 (100.0%) | 350 (100.0%) |
Real Estate Taxes by Mortgage Status in Middleport
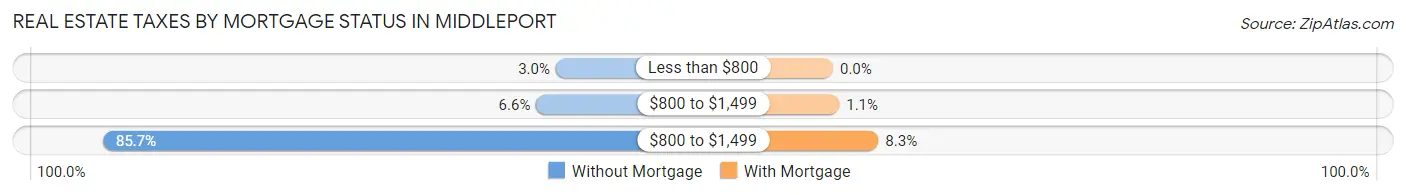
| Property Taxes | Without Mortgage | With Mortgage |
| Less than $800 | 5 (3.0%) | 0 (0.0%) |
| $800 to $1,499 | 11 (6.6%) | 4 (1.1%) |
| $800 to $1,499 | 144 (85.7%) | 29 (8.3%) |
| Total | 168 (100.0%) | 350 (100.0%) |
Health & Disability in Middleport
Health Insurance Coverage by Age in Middleport
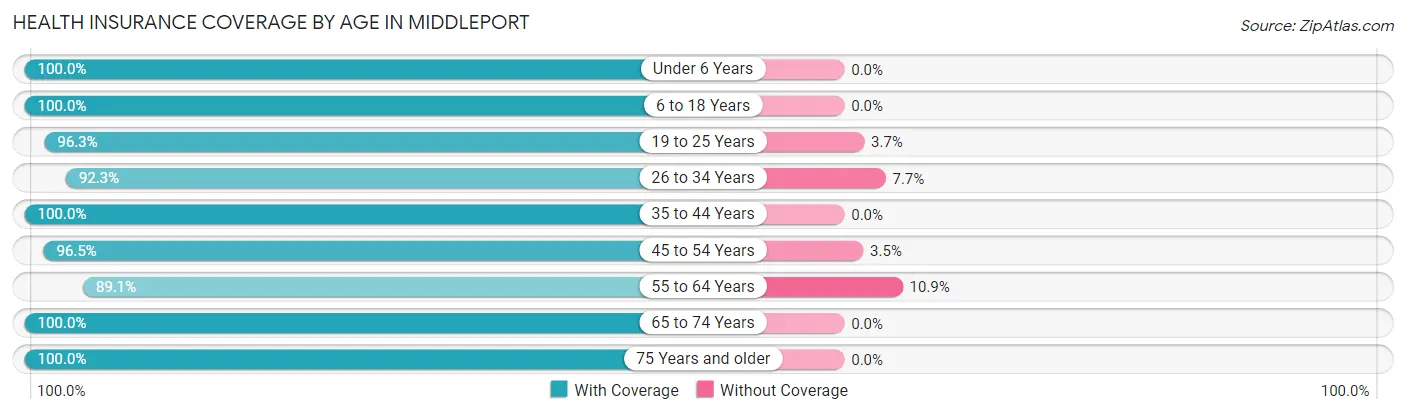
| Age Bracket | With Coverage | Without Coverage |
| Under 6 Years | 172 (100.0%) | 0 (0.0%) |
| 6 to 18 Years | 351 (100.0%) | 0 (0.0%) |
| 19 to 25 Years | 209 (96.3%) | 8 (3.7%) |
| 26 to 34 Years | 228 (92.3%) | 19 (7.7%) |
| 35 to 44 Years | 225 (100.0%) | 0 (0.0%) |
| 45 to 54 Years | 192 (96.5%) | 7 (3.5%) |
| 55 to 64 Years | 287 (89.1%) | 35 (10.9%) |
| 65 to 74 Years | 130 (100.0%) | 0 (0.0%) |
| 75 Years and older | 109 (100.0%) | 0 (0.0%) |
| Total | 1,903 (96.5%) | 69 (3.5%) |
Health Insurance Coverage by Citizenship Status in Middleport
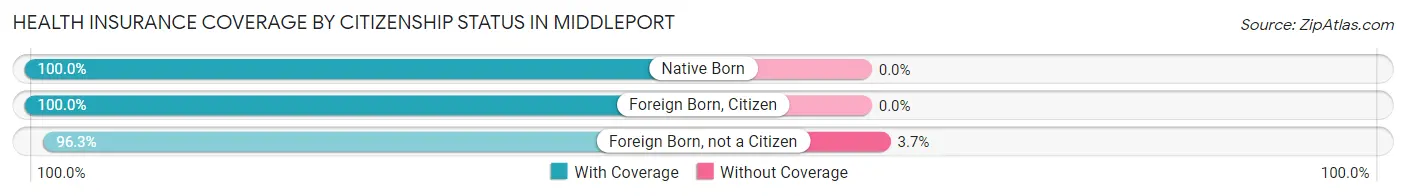
| Citizenship Status | With Coverage | Without Coverage |
| Native Born | 172 (100.0%) | 0 (0.0%) |
| Foreign Born, Citizen | 351 (100.0%) | 0 (0.0%) |
| Foreign Born, not a Citizen | 209 (96.3%) | 8 (3.7%) |
Health Insurance Coverage by Household Income in Middleport
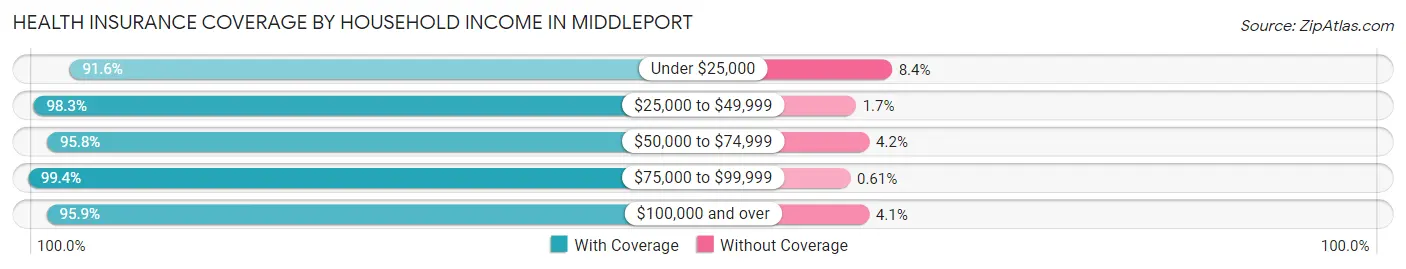
| Household Income | With Coverage | Without Coverage |
| Under $25,000 | 196 (91.6%) | 18 (8.4%) |
| $25,000 to $49,999 | 411 (98.3%) | 7 (1.7%) |
| $50,000 to $74,999 | 366 (95.8%) | 16 (4.2%) |
| $75,000 to $99,999 | 328 (99.4%) | 2 (0.6%) |
| $100,000 and over | 602 (95.9%) | 26 (4.1%) |
Public vs Private Health Insurance Coverage by Age in Middleport
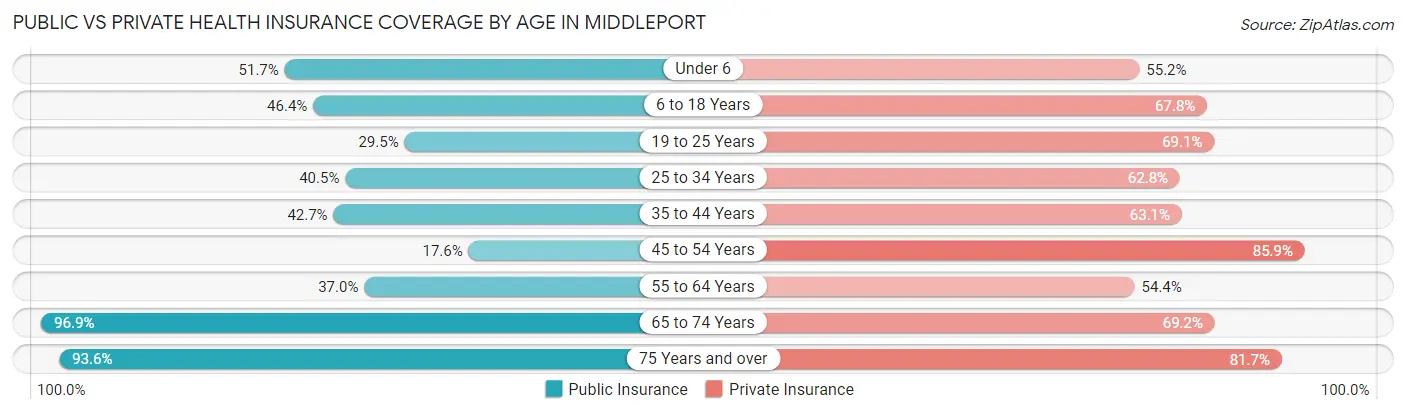
| Age Bracket | Public Insurance | Private Insurance |
| Under 6 | 89 (51.7%) | 95 (55.2%) |
| 6 to 18 Years | 163 (46.4%) | 238 (67.8%) |
| 19 to 25 Years | 64 (29.5%) | 150 (69.1%) |
| 25 to 34 Years | 100 (40.5%) | 155 (62.7%) |
| 35 to 44 Years | 96 (42.7%) | 142 (63.1%) |
| 45 to 54 Years | 35 (17.6%) | 171 (85.9%) |
| 55 to 64 Years | 119 (37.0%) | 175 (54.3%) |
| 65 to 74 Years | 126 (96.9%) | 90 (69.2%) |
| 75 Years and over | 102 (93.6%) | 89 (81.7%) |
| Total | 894 (45.3%) | 1,305 (66.2%) |
Disability Status by Sex by Age in Middleport
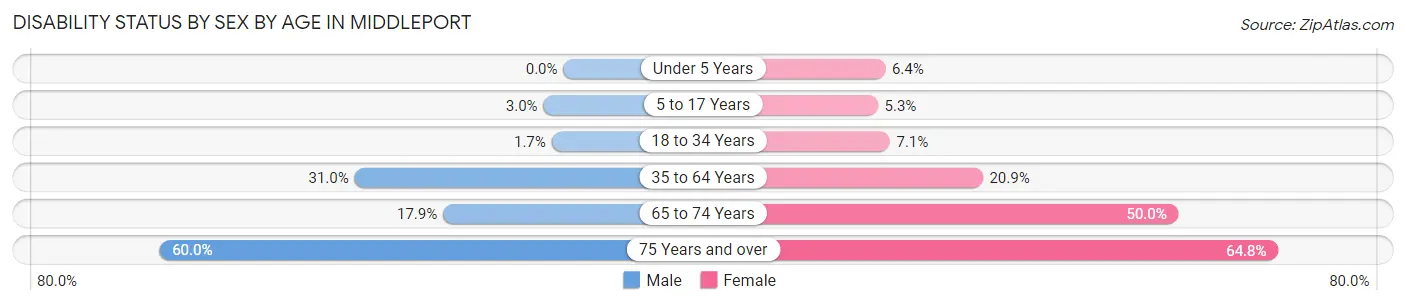
| Age Bracket | Male | Female |
| Under 5 Years | 0 (0.0%) | 5 (6.4%) |
| 5 to 17 Years | 5 (3.0%) | 10 (5.3%) |
| 18 to 34 Years | 4 (1.7%) | 18 (7.1%) |
| 35 to 64 Years | 120 (31.0%) | 75 (20.9%) |
| 65 to 74 Years | 10 (17.9%) | 37 (50.0%) |
| 75 Years and over | 33 (60.0%) | 35 (64.8%) |
Disability Class by Sex by Age in Middleport
Disability Class: Hearing Difficulty
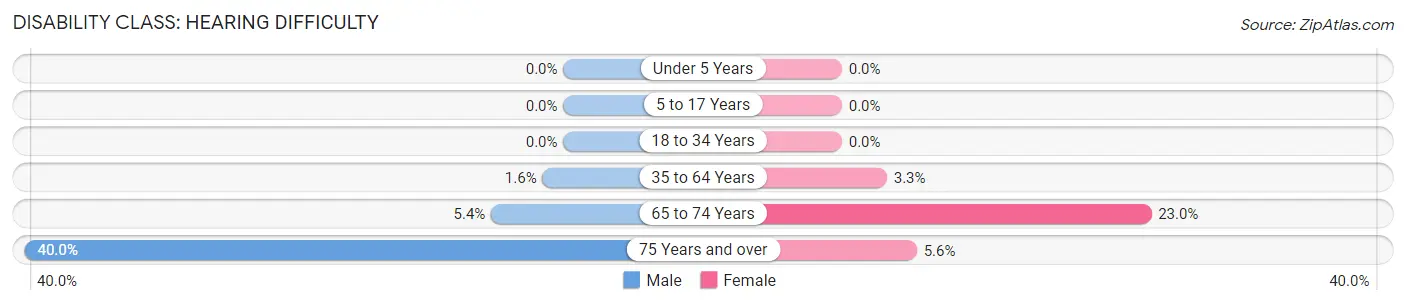
| Age Bracket | Male | Female |
| Under 5 Years | 0 (0.0%) | 0 (0.0%) |
| 5 to 17 Years | 0 (0.0%) | 0 (0.0%) |
| 18 to 34 Years | 0 (0.0%) | 0 (0.0%) |
| 35 to 64 Years | 6 (1.5%) | 12 (3.3%) |
| 65 to 74 Years | 3 (5.4%) | 17 (23.0%) |
| 75 Years and over | 22 (40.0%) | 3 (5.6%) |
Disability Class: Vision Difficulty
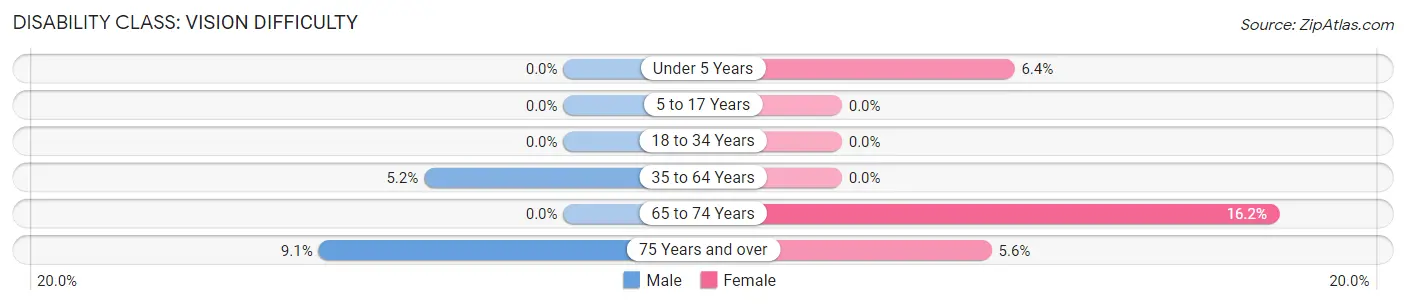
| Age Bracket | Male | Female |
| Under 5 Years | 0 (0.0%) | 5 (6.4%) |
| 5 to 17 Years | 0 (0.0%) | 0 (0.0%) |
| 18 to 34 Years | 0 (0.0%) | 0 (0.0%) |
| 35 to 64 Years | 20 (5.2%) | 0 (0.0%) |
| 65 to 74 Years | 0 (0.0%) | 12 (16.2%) |
| 75 Years and over | 5 (9.1%) | 3 (5.6%) |
Disability Class: Cognitive Difficulty
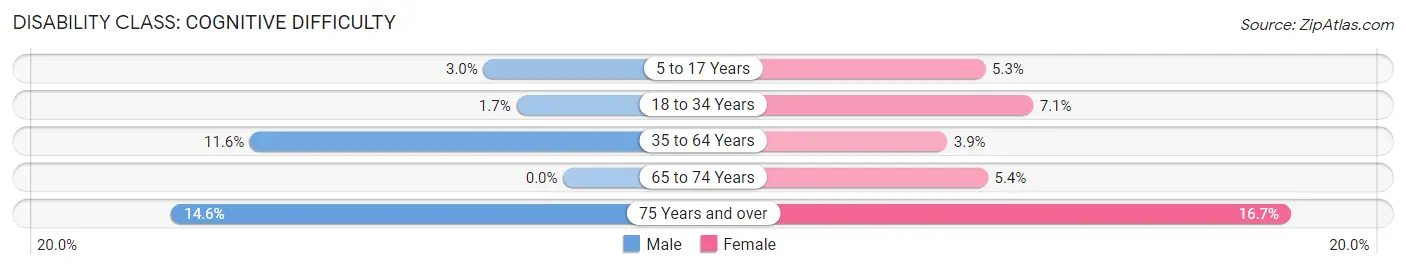
| Age Bracket | Male | Female |
| 5 to 17 Years | 5 (3.0%) | 10 (5.3%) |
| 18 to 34 Years | 4 (1.7%) | 18 (7.1%) |
| 35 to 64 Years | 45 (11.6%) | 14 (3.9%) |
| 65 to 74 Years | 0 (0.0%) | 4 (5.4%) |
| 75 Years and over | 8 (14.5%) | 9 (16.7%) |
Disability Class: Ambulatory Difficulty
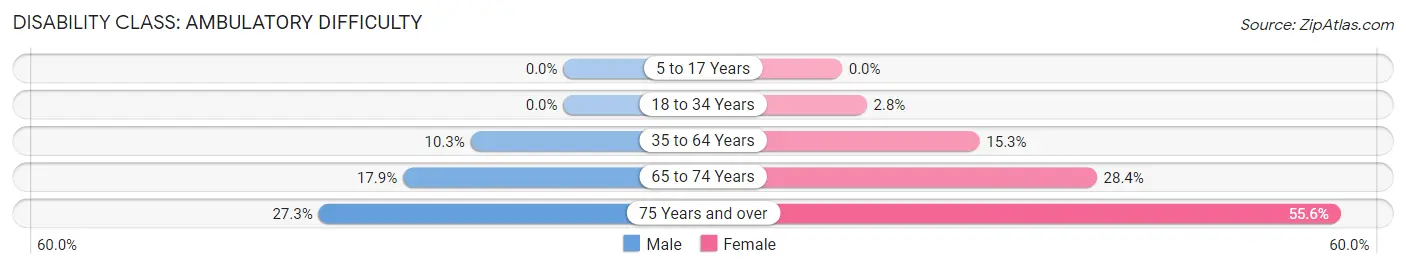
| Age Bracket | Male | Female |
| 5 to 17 Years | 0 (0.0%) | 0 (0.0%) |
| 18 to 34 Years | 0 (0.0%) | 7 (2.8%) |
| 35 to 64 Years | 40 (10.3%) | 55 (15.3%) |
| 65 to 74 Years | 10 (17.9%) | 21 (28.4%) |
| 75 Years and over | 15 (27.3%) | 30 (55.6%) |
Disability Class: Self-Care Difficulty
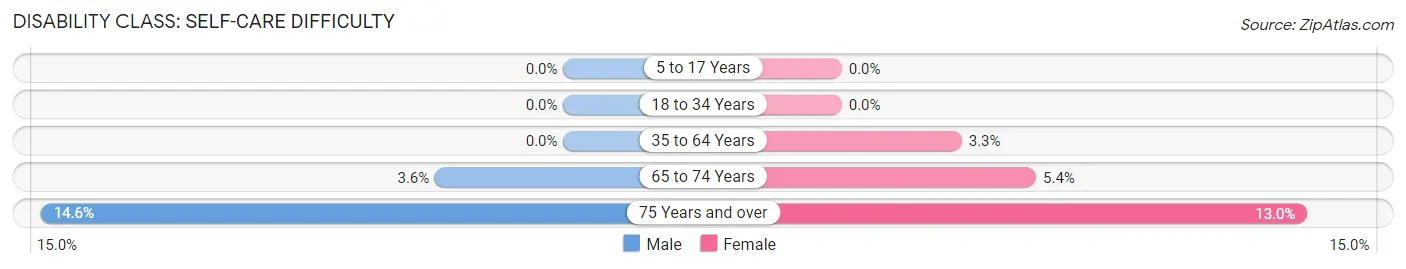
| Age Bracket | Male | Female |
| 5 to 17 Years | 0 (0.0%) | 0 (0.0%) |
| 18 to 34 Years | 0 (0.0%) | 0 (0.0%) |
| 35 to 64 Years | 0 (0.0%) | 12 (3.3%) |
| 65 to 74 Years | 2 (3.6%) | 4 (5.4%) |
| 75 Years and over | 8 (14.5%) | 7 (13.0%) |
Technology Access in Middleport
Computing Device Access in Middleport
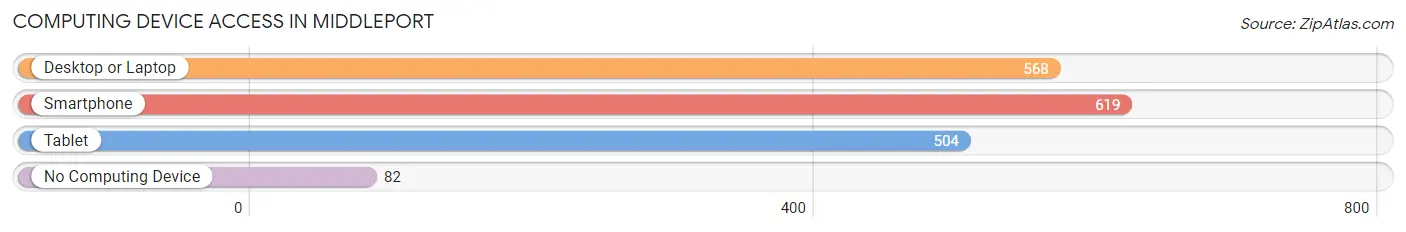
| Device Type | # Households | % Households |
| Desktop or Laptop | 568 | 75.3% |
| Smartphone | 619 | 82.1% |
| Tablet | 504 | 66.8% |
| No Computing Device | 82 | 10.9% |
| Total | 754 | 100.0% |
Internet Access in Middleport
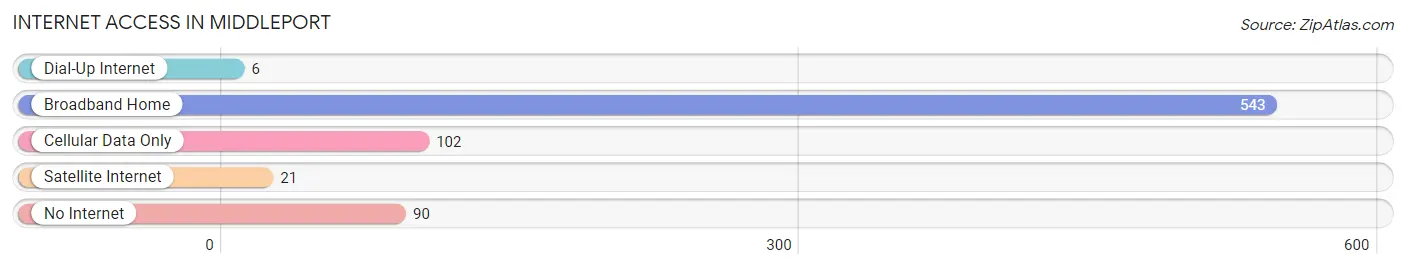
| Internet Type | # Households | % Households |
| Dial-Up Internet | 6 | 0.8% |
| Broadband Home | 543 | 72.0% |
| Cellular Data Only | 102 | 13.5% |
| Satellite Internet | 21 | 2.8% |
| No Internet | 90 | 11.9% |
| Total | 754 | 100.0% |
Middleport Summary
Introduction
Middleport is a small village located in Niagara County, New York. It is situated on the banks of the Erie Canal, and is part of the larger Niagara Falls metropolitan area. The village has a population of approximately 1,500 people, and is home to a variety of businesses, including a number of small manufacturing companies. Middleport is a popular tourist destination, and is known for its historic buildings and scenic views.
History
Middleport was first settled in 1818 by a group of settlers from Connecticut. The village was originally known as “Middleport Landing”, and was a popular stop for travelers on the Erie Canal. In 1825, the village was officially incorporated as the Village of Middleport.
The village grew rapidly in the 19th century, and by the early 20th century, it had become a major industrial center. The village was home to a number of factories, including a paper mill, a flour mill, and a tannery. The village also had a number of stores, hotels, and other businesses.
In the late 20th century, the village began to decline. Many of the factories closed, and the population began to decline. In the early 21st century, the village began to experience a resurgence, and many of the historic buildings were restored.
Geography
Middleport is located in Niagara County, New York, on the banks of the Erie Canal. The village is situated on the eastern edge of the Niagara River, and is bordered by the towns of Royalton and Hartland. The village is located approximately 25 miles north of Buffalo, and is part of the larger Niagara Falls metropolitan area.
The village has a total area of 0.7 square miles, all of which is land. The terrain is mostly flat, with some rolling hills. The village is located in a temperate climate zone, and experiences four distinct seasons.
Economy
Middleport’s economy is largely based on tourism and manufacturing. The village is home to a number of small manufacturing companies, including a paper mill, a flour mill, and a tannery. The village also has a number of stores, restaurants, and other businesses.
The village is also home to a number of tourist attractions, including the historic Erie Canal, the Niagara River, and the Niagara Falls. The village is also home to a number of historic buildings, including the Middleport Opera House and the Middleport Town Hall.
Demographics
As of the 2010 census, the village had a population of 1,500 people. The population is largely white (94.7%), with a small percentage of African Americans (2.7%) and Hispanics (2.0%). The median household income is $37,500, and the median age is 43.
Conclusion
Middleport is a small village located in Niagara County, New York. It is situated on the banks of the Erie Canal, and is part of the larger Niagara Falls metropolitan area. The village has a population of approximately 1,500 people, and is home to a variety of businesses, including a number of small manufacturing companies. Middleport is a popular tourist destination, and is known for its historic buildings and scenic views. The village’s economy is largely based on tourism and manufacturing, and the population is largely white.
Common Questions
What is Per Capita Income in Middleport?
Per Capita income in Middleport is $27,377.
What is the Median Family Income in Middleport?
Median Family Income in Middleport is $68,462.
What is the Median Household income in Middleport?
Median Household Income in Middleport is $59,773.
What is Income or Wage Gap in Middleport?
Income or Wage Gap in Middleport is 21.3%.
Women in Middleport earn 78.7 cents for every dollar earned by a man.
What is Inequality or Gini Index in Middleport?
Inequality or Gini Index in Middleport is 0.38.
What is the Total Population of Middleport?
Total Population of Middleport is 1,972.
What is the Total Male Population of Middleport?
Total Male Population of Middleport is 965.
What is the Total Female Population of Middleport?
Total Female Population of Middleport is 1,007.
What is the Ratio of Males per 100 Females in Middleport?
There are 95.83 Males per 100 Females in Middleport.
What is the Ratio of Females per 100 Males in Middleport?
There are 104.35 Females per 100 Males in Middleport.
What is the Median Population Age in Middleport?
Median Population Age in Middleport is 34.9 Years.
What is the Average Family Size in Middleport
Average Family Size in Middleport is 3.1 People.
What is the Average Household Size in Middleport
Average Household Size in Middleport is 2.6 People.
How Large is the Labor Force in Middleport?
There are 970 People in the Labor Forcein in Middleport.
What is the Percentage of People in the Labor Force in Middleport?
63.8% of People are in the Labor Force in Middleport.
What is the Unemployment Rate in Middleport?
Unemployment Rate in Middleport is 6.1%.