Cities with the Largest British West Indian Community in the United States
RELATED REPORTS & OPTIONS
British West Indian
United States
Compare Cities
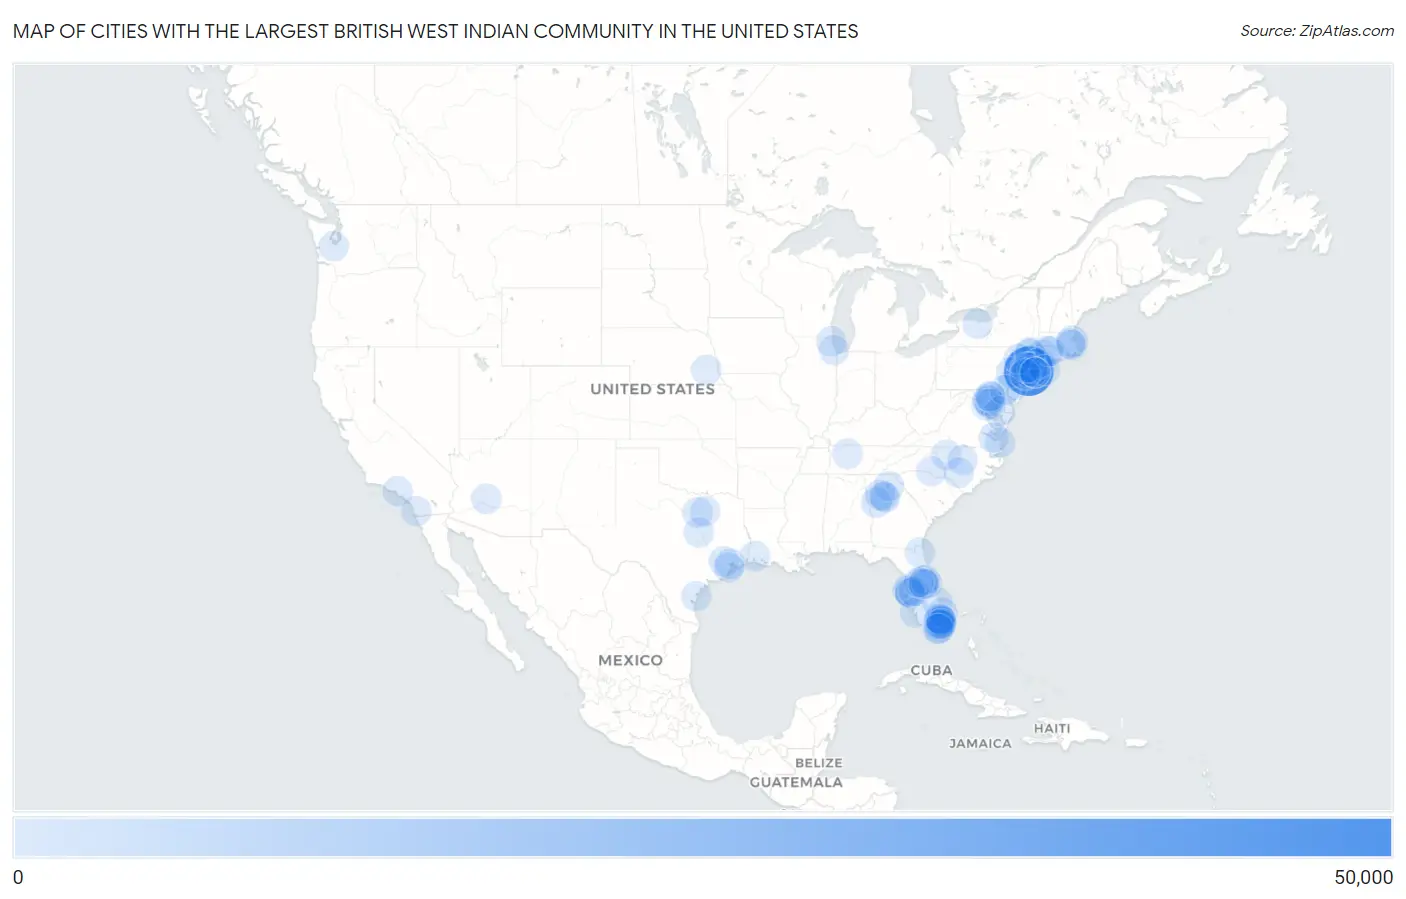
Map of Cities with the Largest British West Indian Community in the United States
0
50,000
Cities with the Largest British West Indian Community in the United States
| City | British West Indian | vs State | vs National | |
| 1. | New York | 49,370 | 57,691(85.58%)#1 | 121,005(40.80%)#1 |
| 2. | Boston | 2,377 | 4,574(51.97%)#1 | 121,005(1.96%)#2 |
| 3. | Lauderhill | 1,057 | 17,476(6.05%)#1 | 121,005(0.87%)#3 |
| 4. | Mount Vernon | 918 | 57,691(1.59%)#2 | 121,005(0.76%)#4 |
| 5. | Philadelphia | 868 | 2,179(39.83%)#1 | 121,005(0.72%)#5 |
| 6. | Tampa | 838 | 17,476(4.80%)#2 | 121,005(0.69%)#6 |
| 7. | Waterbury | 743 | 2,842(26.14%)#1 | 121,005(0.61%)#7 |
| 8. | Pine Hills | 676 | 17,476(3.87%)#3 | 121,005(0.56%)#8 |
| 9. | East Orange | 662 | 7,094(9.33%)#1 | 121,005(0.55%)#9 |
| 10. | Newark | 641 | 7,094(9.04%)#2 | 121,005(0.53%)#10 |
| 11. | Jersey City | 599 | 7,094(8.44%)#3 | 121,005(0.50%)#11 |
| 12. | Port St Lucie | 597 | 17,476(3.42%)#4 | 121,005(0.49%)#12 |
| 13. | Newnan | 596 | 6,211(9.60%)#1 | 121,005(0.49%)#13 |
| 14. | Yonkers | 569 | 57,691(0.99%)#3 | 121,005(0.47%)#14 |
| 15. | Houston | 542 | 4,328(12.52%)#1 | 121,005(0.45%)#15 |
| 16. | Los Angeles | 516 | 2,476(20.84%)#1 | 121,005(0.43%)#16 |
| 17. | Miami | 514 | 17,476(2.94%)#5 | 121,005(0.42%)#17 |
| 18. | Elmont | 481 | 57,691(0.83%)#4 | 121,005(0.40%)#18 |
| 19. | Tamarac | 447 | 17,476(2.56%)#6 | 121,005(0.37%)#19 |
| 20. | Prien | 447 | 704(63.49%)#1 | 121,005(0.37%)#20 |
| 21. | Washington | 439 | 439(100.00%)#1 | 121,005(0.36%)#21 |
| 22. | Miramar | 417 | 17,476(2.39%)#7 | 121,005(0.34%)#22 |
| 23. | Greensboro | 408 | 1,828(22.32%)#1 | 121,005(0.34%)#23 |
| 24. | Citrus Park | 402 | 17,476(2.30%)#8 | 121,005(0.33%)#24 |
| 25. | Atlanta | 387 | 6,211(6.23%)#2 | 121,005(0.32%)#25 |
| 26. | Sunrise | 376 | 17,476(2.15%)#9 | 121,005(0.31%)#26 |
| 27. | La Porte | 376 | 4,328(8.69%)#2 | 121,005(0.31%)#27 |
| 28. | Hartford | 362 | 2,842(12.74%)#2 | 121,005(0.30%)#28 |
| 29. | Randolph Town | 359 | 4,574(7.85%)#2 | 121,005(0.30%)#29 |
| 30. | Pembroke Pines | 350 | 17,476(2.00%)#10 | 121,005(0.29%)#30 |
| 31. | Miami Gardens | 343 | 17,476(1.96%)#11 | 121,005(0.28%)#31 |
| 32. | Poughkeepsie | 339 | 57,691(0.59%)#5 | 121,005(0.28%)#32 |
| 33. | Nashville | 335 | 861(38.91%)#1 | 121,005(0.28%)#33 |
| 34. | Jacksonville | 316 | 17,476(1.81%)#12 | 121,005(0.26%)#34 |
| 35. | Hollywood | 312 | 17,476(1.79%)#13 | 121,005(0.26%)#35 |
| 36. | New Rochelle | 304 | 57,691(0.53%)#6 | 121,005(0.25%)#36 |
| 37. | Margate | 299 | 17,476(1.71%)#14 | 121,005(0.25%)#37 |
| 38. | Bridgeport | 283 | 2,842(9.96%)#3 | 121,005(0.23%)#38 |
| 39. | Stonecrest | 257 | 6,211(4.14%)#3 | 121,005(0.21%)#39 |
| 40. | Palm Springs | 255 | 17,476(1.46%)#15 | 121,005(0.21%)#40 |
| 41. | Peekskill | 243 | 57,691(0.42%)#7 | 121,005(0.20%)#41 |
| 42. | Virginia Beach | 242 | 1,426(16.97%)#1 | 121,005(0.20%)#42 |
| 43. | Norwalk | 242 | 2,842(8.52%)#4 | 121,005(0.20%)#43 |
| 44. | Fort Worth | 239 | 4,328(5.52%)#3 | 121,005(0.20%)#44 |
| 45. | Columbia | 239 | 4,051(5.90%)#1 | 121,005(0.20%)#45 |
| 46. | Brockton | 238 | 4,574(5.20%)#3 | 121,005(0.20%)#46 |
| 47. | The Hammocks | 233 | 17,476(1.33%)#16 | 121,005(0.19%)#47 |
| 48. | Corpus Christi | 232 | 4,328(5.36%)#4 | 121,005(0.19%)#48 |
| 49. | Plainfield | 229 | 7,094(3.23%)#4 | 121,005(0.19%)#49 |
| 50. | Coral Springs | 226 | 17,476(1.29%)#17 | 121,005(0.19%)#50 |
| 51. | Perth Amboy | 225 | 7,094(3.17%)#5 | 121,005(0.19%)#51 |
| 52. | Fort Lauderdale | 221 | 17,476(1.26%)#18 | 121,005(0.18%)#52 |
| 53. | Maryland City | 221 | 4,051(5.46%)#2 | 121,005(0.18%)#53 |
| 54. | Oakland Park | 218 | 17,476(1.25%)#19 | 121,005(0.18%)#54 |
| 55. | Easton | 216 | 2,179(9.91%)#2 | 121,005(0.18%)#55 |
| 56. | North Chicago | 214 | 682(31.38%)#1 | 121,005(0.18%)#56 |
| 57. | Baltimore | 213 | 4,051(5.26%)#3 | 121,005(0.18%)#57 |
| 58. | San Diego | 211 | 2,476(8.52%)#2 | 121,005(0.17%)#58 |
| 59. | Orlando | 208 | 17,476(1.19%)#20 | 121,005(0.17%)#59 |
| 60. | Bowie | 188 | 4,051(4.64%)#4 | 121,005(0.16%)#60 |
| 61. | Opa Locka | 188 | 17,476(1.08%)#21 | 121,005(0.16%)#61 |
| 62. | Gibsonton | 186 | 17,476(1.06%)#22 | 121,005(0.15%)#62 |
| 63. | Cape Coral | 180 | 17,476(1.03%)#23 | 121,005(0.15%)#63 |
| 64. | Spackenkill | 179 | 57,691(0.31%)#8 | 121,005(0.15%)#64 |
| 65. | Lincoln | 177 | 238(74.37%)#1 | 121,005(0.15%)#65 |
| 66. | Port Jervis | 176 | 57,691(0.31%)#9 | 121,005(0.15%)#66 |
| 67. | Rochester | 172 | 57,691(0.30%)#10 | 121,005(0.14%)#67 |
| 68. | Wedgefield | 171 | 17,476(0.98%)#24 | 121,005(0.14%)#68 |
| 69. | Charlotte | 169 | 1,828(9.25%)#2 | 121,005(0.14%)#69 |
| 70. | Casselberry | 169 | 17,476(0.97%)#25 | 121,005(0.14%)#70 |
| 71. | League City | 168 | 4,328(3.88%)#5 | 121,005(0.14%)#71 |
| 72. | Progress Village | 167 | 17,476(0.96%)#26 | 121,005(0.14%)#72 |
| 73. | Dallas | 164 | 4,328(3.79%)#6 | 121,005(0.14%)#73 |
| 74. | Olympia | 163 | 578(28.20%)#1 | 121,005(0.13%)#74 |
| 75. | Plant City | 163 | 17,476(0.93%)#27 | 121,005(0.13%)#75 |
| 76. | North Valley Stream | 163 | 57,691(0.28%)#11 | 121,005(0.13%)#76 |
| 77. | Sky Lake | 163 | 17,476(0.93%)#28 | 121,005(0.13%)#77 |
| 78. | Richmond Heights | 162 | 17,476(0.93%)#29 | 121,005(0.13%)#78 |
| 79. | Clermont | 159 | 17,476(0.91%)#30 | 121,005(0.13%)#79 |
| 80. | Hackensack | 158 | 7,094(2.23%)#6 | 121,005(0.13%)#80 |
| 81. | Shirley | 158 | 57,691(0.27%)#12 | 121,005(0.13%)#81 |
| 82. | Paterson | 154 | 7,094(2.17%)#7 | 121,005(0.13%)#82 |
| 83. | Manchester | 154 | 2,842(5.42%)#5 | 121,005(0.13%)#83 |
| 84. | Pike Creek Valley | 153 | 385(39.74%)#1 | 121,005(0.13%)#84 |
| 85. | Hallandale Beach | 151 | 17,476(0.86%)#31 | 121,005(0.12%)#85 |
| 86. | Rahway | 151 | 7,094(2.13%)#8 | 121,005(0.12%)#86 |
| 87. | Flower Hill | 151 | 4,051(3.73%)#5 | 121,005(0.12%)#87 |
| 88. | Raleigh | 150 | 1,828(8.21%)#3 | 121,005(0.12%)#88 |
| 89. | Waco | 149 | 4,328(3.44%)#7 | 121,005(0.12%)#89 |
| 90. | Cambridge | 148 | 4,051(3.65%)#6 | 121,005(0.12%)#90 |
| 91. | Lochearn | 147 | 4,051(3.63%)#7 | 121,005(0.12%)#91 |
| 92. | Roosevelt | 143 | 57,691(0.25%)#13 | 121,005(0.12%)#92 |
| 93. | Fayetteville | 141 | 1,828(7.71%)#4 | 121,005(0.12%)#93 |
| 94. | Bayamón | 141 | 492(28.66%)#1 | 121,005(0.12%)#94 |
| 95. | Gainesville | 140 | 6,211(2.25%)#4 | 121,005(0.12%)#95 |
| 96. | Phoenix | 139 | 263(52.85%)#1 | 121,005(0.11%)#96 |
| 97. | Newport News | 137 | 1,426(9.61%)#2 | 121,005(0.11%)#97 |
| 98. | Freeport | 137 | 57,691(0.24%)#14 | 121,005(0.11%)#98 |
| 99. | Redan | 136 | 6,211(2.19%)#5 | 121,005(0.11%)#99 |
| 100. | Chicago | 135 | 682(19.79%)#2 | 121,005(0.11%)#100 |
Common Questions
What are the Top 10 Cities with the Largest British West Indian Community in the United States?
Top 10 Cities with the Largest British West Indian Community in the United States are:
#1
49,370
#2
2,377
#3
1,057
#4
918
#5
868
#6
838
#7
743
#8
676
#9
662
#10
641
What city has the Largest British West Indian Community in the United States?
New York has the Largest British West Indian Community in the United States with 49,370.
What is the Total British West Indian Population in the United States?
Total British West Indian Population in the United States is 121,005.