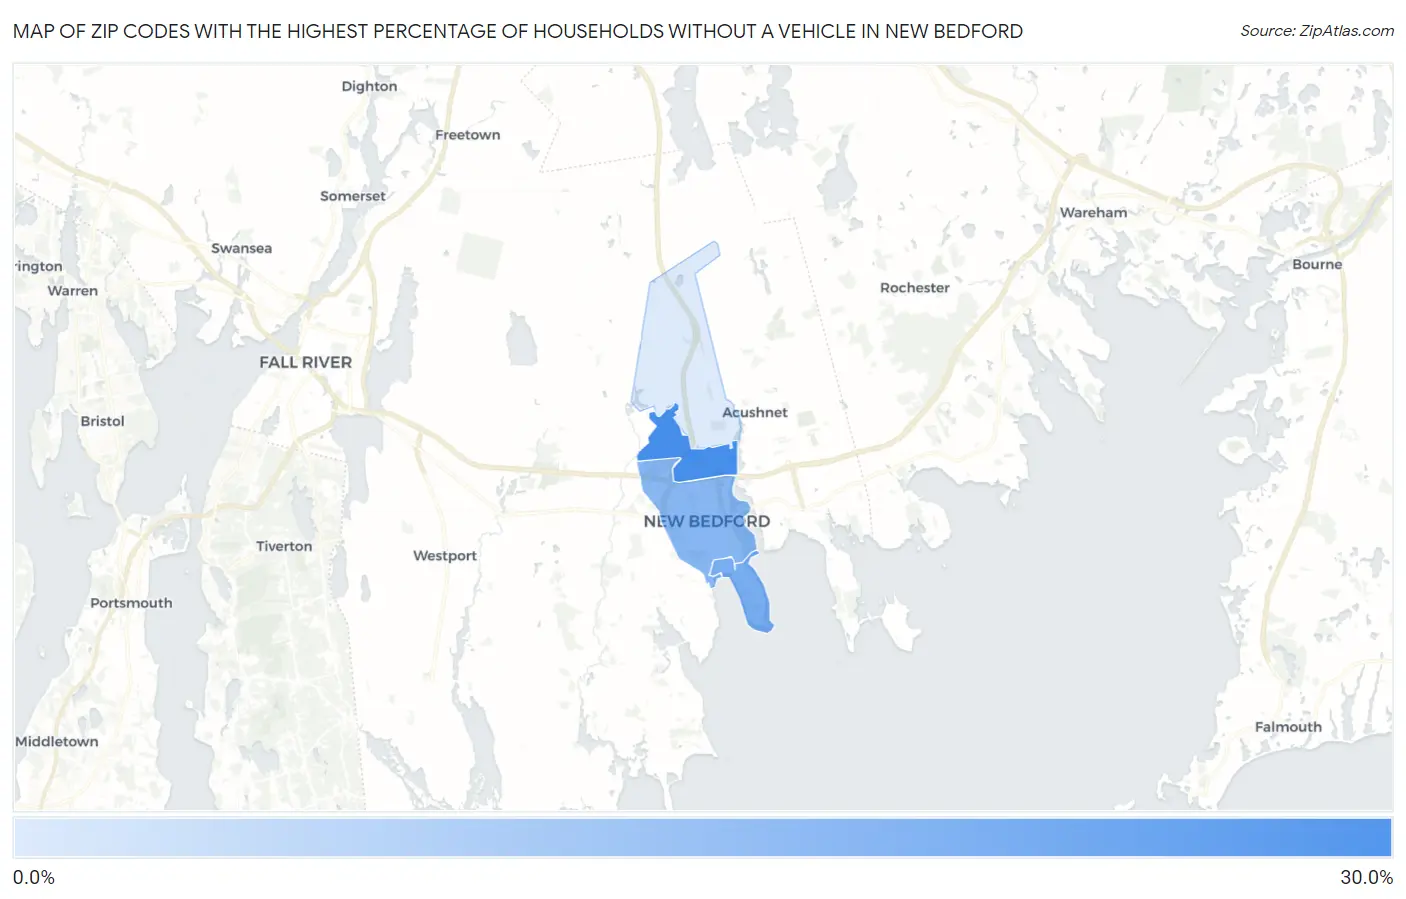
Zip Codes with the Highest Percentage of Households Without a Vehicle in New Bedford, MA
RELATED REPORTS & OPTIONS
Households without a Cars
New Bedford
Compare Zip Codes
Map of Zip Codes with the Highest Percentage of Households Without a Vehicle in New Bedford
7.7%
28.3%
Zip Codes with the Highest Percentage of Households Without a Vehicle in New Bedford, MA
| Zip Code | Housholds Without a Car | vs State | vs National | |
| 1. | 02746 | 28.3% | 11.9%(+16.4)#35 | 8.3%(+20.0)#881 |
| 2. | 02744 | 21.2% | 11.9%(+9.30)#50 | 8.3%(+12.9)#1,368 |
| 3. | 02740 | 19.0% | 11.9%(+7.10)#56 | 8.3%(+10.7)#1,626 |
| 4. | 02745 | 7.7% | 11.9%(-4.20)#155 | 8.3%(-0.600)#7,389 |
1
Common Questions
What are the Top 3 Zip Codes with the Highest Percentage of Households Without a Vehicle in New Bedford, MA?
Top 3 Zip Codes with the Highest Percentage of Households Without a Vehicle in New Bedford, MA are:
What zip code has the Highest Percentage of Households Without a Vehicle in New Bedford, MA?
02746 has the Highest Percentage of Households Without a Vehicle in New Bedford, MA with 28.3%.
What is the Percentage of Households Without a Vehicle in New Bedford, MA?
Percentage of Households Without a Vehicle in New Bedford is 18.0%.
What is the Percentage of Households Without a Vehicle in Massachusetts?
Percentage of Households Without a Vehicle in Massachusetts is 11.9%.
What is the Percentage of Households Without a Vehicle in the United States?
Percentage of Households Without a Vehicle in the United States is 8.3%.