Zip Codes with the Highest Percentage of Households Without a Vehicle in Massachusetts
RELATED REPORTS & OPTIONS
Households without a Cars
Massachusetts
Compare Zip Codes
Map of Zip Codes with the Highest Percentage of Households Without a Vehicle in Massachusetts
0.0%
100.0%
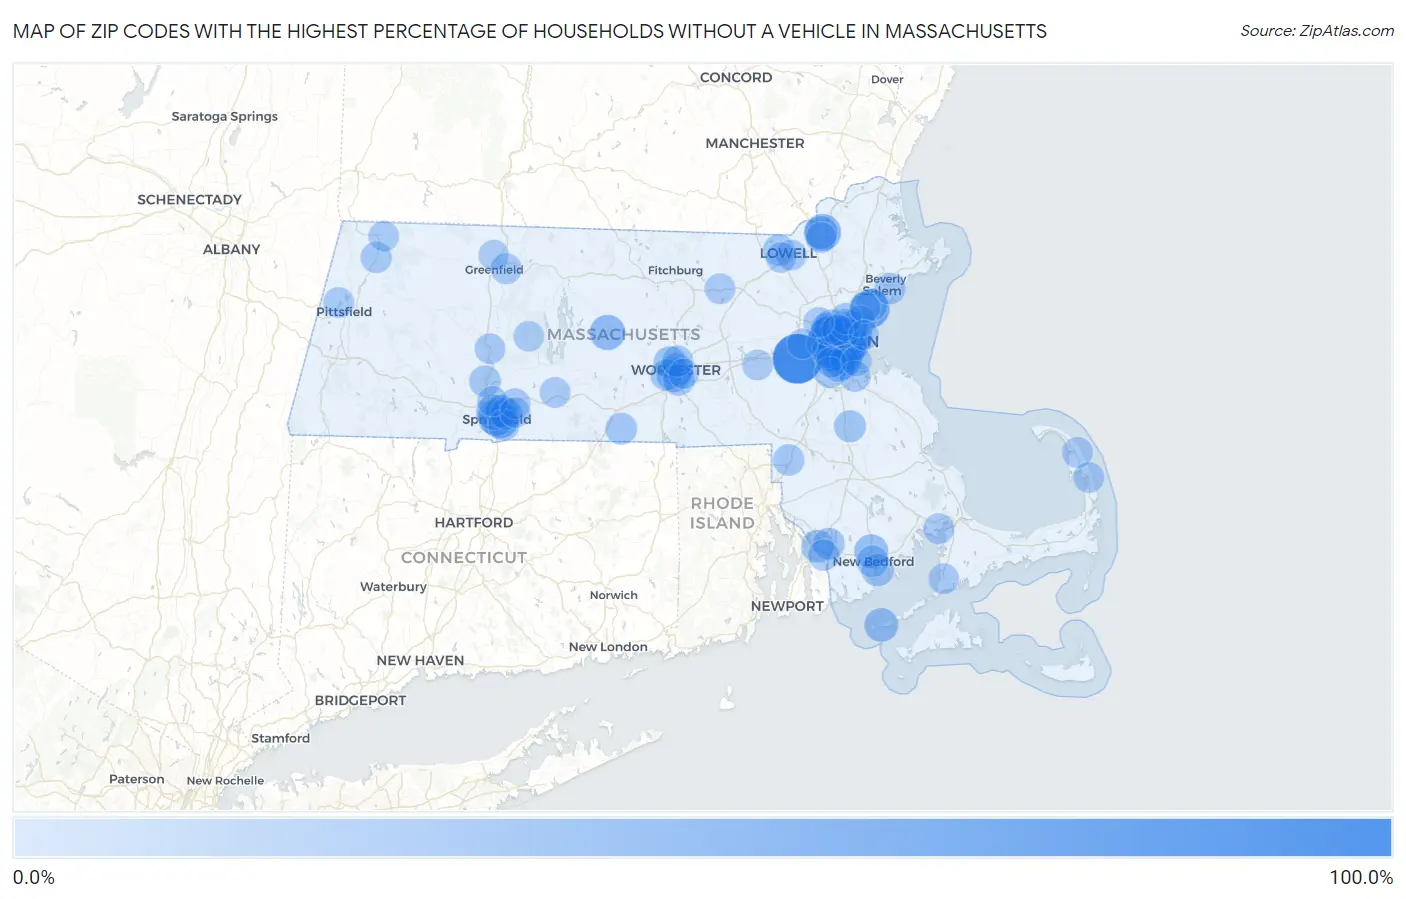
Zip Codes with the Highest Percentage of Households Without a Vehicle in Massachusetts
| Zip Code | Housholds Without a Car | vs State | vs National | |
| 1. | 02457 | 100.0% | 11.9% (+88.1)#1 | 8.3% (+91.7)#10 |
| 2. | 02163 | 67.1% | 11.9% (+55.2)#2 | 8.3% (+58.8)#218 |
| 3. | 02115 | 63.9% | 11.9% (+52.0)#3 | 8.3% (+55.6)#242 |
| 4. | 02111 | 63.3% | 11.9% (+51.4)#4 | 8.3% (+55.0)#246 |
| 5. | 02114 | 61.8% | 11.9% (+49.9)#5 | 8.3% (+53.5)#259 |
| 6. | 02215 | 59.2% | 11.9% (+47.3)#6 | 8.3% (+50.9)#278 |
| 7. | 02113 | 57.2% | 11.9% (+45.3)#7 | 8.3% (+48.9)#288 |
| 8. | 01901 | 52.1% | 11.9% (+40.2)#8 | 8.3% (+43.8)#331 |
| 9. | 02109 | 49.2% | 11.9% (+37.3)#9 | 8.3% (+40.9)#355 |
| 10. | 02134 | 46.7% | 11.9% (+34.8)#10 | 8.3% (+38.4)#382 |
| 11. | 02108 | 46.6% | 11.9% (+34.7)#11 | 8.3% (+38.3)#385 |
| 12. | 02116 | 46.1% | 11.9% (+34.2)#12 | 8.3% (+37.8)#390 |
| 13. | 02120 | 44.2% | 11.9% (+32.3)#13 | 8.3% (+35.9)#421 |
| 14. | 02119 | 43.2% | 11.9% (+31.3)#14 | 8.3% (+34.9)#445 |
| 15. | 02199 | 42.9% | 11.9% (+31.0)#15 | 8.3% (+34.6)#454 |
| 16. | 01840 | 42.3% | 11.9% (+30.4)#16 | 8.3% (+34.0)#468 |
| 17. | 02210 | 42.0% | 11.9% (+30.1)#17 | 8.3% (+33.7)#471 |
| 18. | 01105 | 41.1% | 11.9% (+29.2)#18 | 8.3% (+32.8)#492 |
| 19. | 01103 | 40.2% | 11.9% (+28.3)#19 | 8.3% (+31.9)#508 |
| 20. | 02118 | 40.0% | 11.9% (+28.1)#20 | 8.3% (+31.7)#513 |
| 21. | 02142 | 39.1% | 11.9% (+27.2)#21 | 8.3% (+30.8)#535 |
| 22. | 02139 | 38.7% | 11.9% (+26.8)#22 | 8.3% (+30.4)#542 |
| 23. | 02110 | 37.9% | 11.9% (+26.0)#23 | 8.3% (+29.6)#563 |
| 24. | 02141 | 37.6% | 11.9% (+25.7)#24 | 8.3% (+29.3)#574 |
| 25. | 02121 | 37.2% | 11.9% (+25.3)#25 | 8.3% (+28.9)#585 |
| 26. | 02446 | 36.1% | 11.9% (+24.2)#26 | 8.3% (+27.8)#614 |
| 27. | 01074 | 34.4% | 11.9% (+22.5)#27 | 8.3% (+26.1)#651 |
| 28. | 01107 | 33.3% | 11.9% (+21.4)#28 | 8.3% (+25.0)#678 |
| 29. | 02138 | 33.2% | 11.9% (+21.3)#29 | 8.3% (+24.9)#686 |
| 30. | 02135 | 31.6% | 11.9% (+19.7)#30 | 8.3% (+23.3)#737 |
| 31. | 02128 | 31.5% | 11.9% (+19.6)#31 | 8.3% (+23.2)#744 |
| 32. | 02125 | 31.5% | 11.9% (+19.6)#32 | 8.3% (+23.2)#746 |
| 33. | 01610 | 29.1% | 11.9% (+17.2)#33 | 8.3% (+20.8)#839 |
| 34. | 02150 | 28.3% | 11.9% (+16.4)#34 | 8.3% (+20.0)#879 |
| 35. | 02746 | 28.3% | 11.9% (+16.4)#35 | 8.3% (+20.0)#881 |
| 36. | 02713 | 27.8% | 11.9% (+15.9)#36 | 8.3% (+19.5)#901 |
| 37. | 02127 | 27.5% | 11.9% (+15.6)#37 | 8.3% (+19.2)#912 |
| 38. | 02124 | 26.8% | 11.9% (+14.9)#38 | 8.3% (+18.5)#954 |
| 39. | 02126 | 26.7% | 11.9% (+14.8)#39 | 8.3% (+18.4)#962 |
| 40. | 02130 | 25.9% | 11.9% (+14.0)#40 | 8.3% (+17.6)#1,004 |
| 41. | 02445 | 25.3% | 11.9% (+13.4)#41 | 8.3% (+17.0)#1,048 |
| 42. | 01608 | 25.0% | 11.9% (+13.1)#42 | 8.3% (+16.7)#1,068 |
| 43. | 02144 | 24.9% | 11.9% (+13.0)#43 | 8.3% (+16.6)#1,077 |
| 44. | 01841 | 24.3% | 11.9% (+12.4)#44 | 8.3% (+16.0)#1,109 |
| 45. | 02143 | 24.1% | 11.9% (+12.2)#45 | 8.3% (+15.8)#1,128 |
| 46. | 01609 | 22.2% | 11.9% (+10.3)#46 | 8.3% (+13.9)#1,281 |
| 47. | 01104 | 22.2% | 11.9% (+10.3)#47 | 8.3% (+13.9)#1,282 |
| 48. | 02724 | 21.9% | 11.9% (+10.00)#48 | 8.3% (+13.6)#1,305 |
| 49. | 02140 | 21.2% | 11.9% (+9.30)#49 | 8.3% (+12.9)#1,365 |
| 50. | 02744 | 21.2% | 11.9% (+9.30)#50 | 8.3% (+12.9)#1,368 |
| 51. | 02129 | 20.8% | 11.9% (+8.90)#51 | 8.3% (+12.5)#1,410 |
| 52. | 01902 | 20.5% | 11.9% (+8.60)#52 | 8.3% (+12.2)#1,437 |
| 53. | 01109 | 20.4% | 11.9% (+8.50)#53 | 8.3% (+12.1)#1,449 |
| 54. | 02149 | 19.9% | 11.9% (+8.00)#54 | 8.3% (+11.6)#1,514 |
| 55. | 02301 | 19.3% | 11.9% (+7.40)#55 | 8.3% (+11.0)#1,590 |
| 56. | 02740 | 19.0% | 11.9% (+7.10)#56 | 8.3% (+10.7)#1,626 |
| 57. | 02122 | 18.6% | 11.9% (+6.70)#57 | 8.3% (+10.3)#1,695 |
| 58. | 02723 | 18.6% | 11.9% (+6.70)#58 | 8.3% (+10.3)#1,696 |
| 59. | 01550 | 18.3% | 11.9% (+6.40)#59 | 8.3% (+10.00)#1,737 |
| 60. | 01040 | 17.9% | 11.9% (+6.00)#60 | 8.3% (+9.60)#1,792 |
| 61. | 01854 | 17.9% | 11.9% (+6.00)#61 | 8.3% (+9.60)#1,794 |
| 62. | 01603 | 17.8% | 11.9% (+5.90)#62 | 8.3% (+9.50)#1,814 |
| 63. | 01607 | 17.8% | 11.9% (+5.90)#63 | 8.3% (+9.50)#1,820 |
| 64. | 02151 | 17.7% | 11.9% (+5.80)#64 | 8.3% (+9.40)#1,837 |
| 65. | 02148 | 17.6% | 11.9% (+5.70)#65 | 8.3% (+9.30)#1,844 |
| 66. | 02145 | 17.2% | 11.9% (+5.30)#66 | 8.3% (+8.90)#1,913 |
| 67. | 01605 | 17.1% | 11.9% (+5.20)#67 | 8.3% (+8.80)#1,934 |
| 68. | 02763 | 16.7% | 11.9% (+4.80)#68 | 8.3% (+8.40)#2,015 |
| 69. | 02136 | 16.5% | 11.9% (+4.60)#69 | 8.3% (+8.20)#2,053 |
| 70. | 02721 | 16.4% | 11.9% (+4.50)#70 | 8.3% (+8.10)#2,075 |
| 71. | 01108 | 16.2% | 11.9% (+4.30)#71 | 8.3% (+7.90)#2,105 |
| 72. | 01220 | 16.0% | 11.9% (+4.10)#72 | 8.3% (+7.70)#2,153 |
| 73. | 01970 | 15.7% | 11.9% (+3.80)#73 | 8.3% (+7.40)#2,212 |
| 74. | 02169 | 15.4% | 11.9% (+3.50)#74 | 8.3% (+7.10)#2,267 |
| 75. | 01376 | 14.9% | 11.9% (+3.00)#75 | 8.3% (+6.60)#2,419 |
| 76. | 01905 | 14.8% | 11.9% (+2.90)#76 | 8.3% (+6.50)#2,443 |
| 77. | 01151 | 14.4% | 11.9% (+2.50)#77 | 8.3% (+6.10)#2,558 |
| 78. | 01852 | 14.3% | 11.9% (+2.40)#78 | 8.3% (+6.00)#2,586 |
| 79. | 01843 | 14.3% | 11.9% (+2.40)#79 | 8.3% (+6.00)#2,590 |
| 80. | 02558 | 14.2% | 11.9% (+2.30)#80 | 8.3% (+5.90)#2,647 |
| 81. | 02666 | 14.2% | 11.9% (+2.30)#81 | 8.3% (+5.90)#2,652 |
| 82. | 02663 | 14.1% | 11.9% (+2.20)#82 | 8.3% (+5.80)#2,688 |
| 83. | 01434 | 14.0% | 11.9% (+2.10)#83 | 8.3% (+5.70)#2,713 |
| 84. | 01201 | 13.7% | 11.9% (+1.80)#84 | 8.3% (+5.40)#2,802 |
| 85. | 01851 | 13.4% | 11.9% (+1.50)#85 | 8.3% (+5.10)#2,917 |
| 86. | 01079 | 13.4% | 11.9% (+1.50)#86 | 8.3% (+5.10)#2,948 |
| 87. | 01013 | 13.3% | 11.9% (+1.40)#87 | 8.3% (+5.00)#2,967 |
| 88. | 02476 | 13.2% | 11.9% (+1.30)#88 | 8.3% (+4.90)#3,008 |
| 89. | 01247 | 13.2% | 11.9% (+1.30)#89 | 8.3% (+4.90)#3,010 |
| 90. | 01060 | 13.2% | 11.9% (+1.30)#90 | 8.3% (+4.90)#3,011 |
| 91. | 01119 | 13.2% | 11.9% (+1.30)#91 | 8.3% (+4.90)#3,012 |
| 92. | 02540 | 13.2% | 11.9% (+1.30)#92 | 8.3% (+4.90)#3,018 |
| 93. | 01702 | 13.1% | 11.9% (+1.20)#93 | 8.3% (+4.80)#3,045 |
| 94. | 02131 | 13.1% | 11.9% (+1.20)#94 | 8.3% (+4.80)#3,046 |
| 95. | 01002 | 13.1% | 11.9% (+1.20)#95 | 8.3% (+4.80)#3,054 |
| 96. | 02466 | 12.9% | 11.9% (+1.000)#96 | 8.3% (+4.60)#3,147 |
| 97. | 02171 | 12.6% | 11.9% (+0.700)#97 | 8.3% (+4.30)#3,278 |
| 98. | 01604 | 12.3% | 11.9% (+0.400)#98 | 8.3% (+4.00)#3,405 |
| 99. | 02152 | 12.3% | 11.9% (+0.400)#99 | 8.3% (+4.00)#3,422 |
| 100. | 01301 | 12.3% | 11.9% (+0.400)#100 | 8.3% (+4.00)#3,424 |
Common Questions
What are the Top 10 Zip Codes with the Highest Percentage of Households Without a Vehicle in Massachusetts?
Top 10 Zip Codes with the Highest Percentage of Households Without a Vehicle in Massachusetts are:
What zip code has the Highest Percentage of Households Without a Vehicle in Massachusetts?
02457 has the Highest Percentage of Households Without a Vehicle in Massachusetts with 100.0%.
What is the Percentage of Households Without a Vehicle in the State of Massachusetts?
Percentage of Households Without a Vehicle in Massachusetts is 11.9%.
What is the Percentage of Households Without a Vehicle in the United States?
Percentage of Households Without a Vehicle in the United States is 8.3%.