Zip Codes with the Highest Percentage of Families with Income Above $100,000 in Massachusetts
RELATED REPORTS & OPTIONS
Family Income | $100k+
Massachusetts
Compare Zip Codes
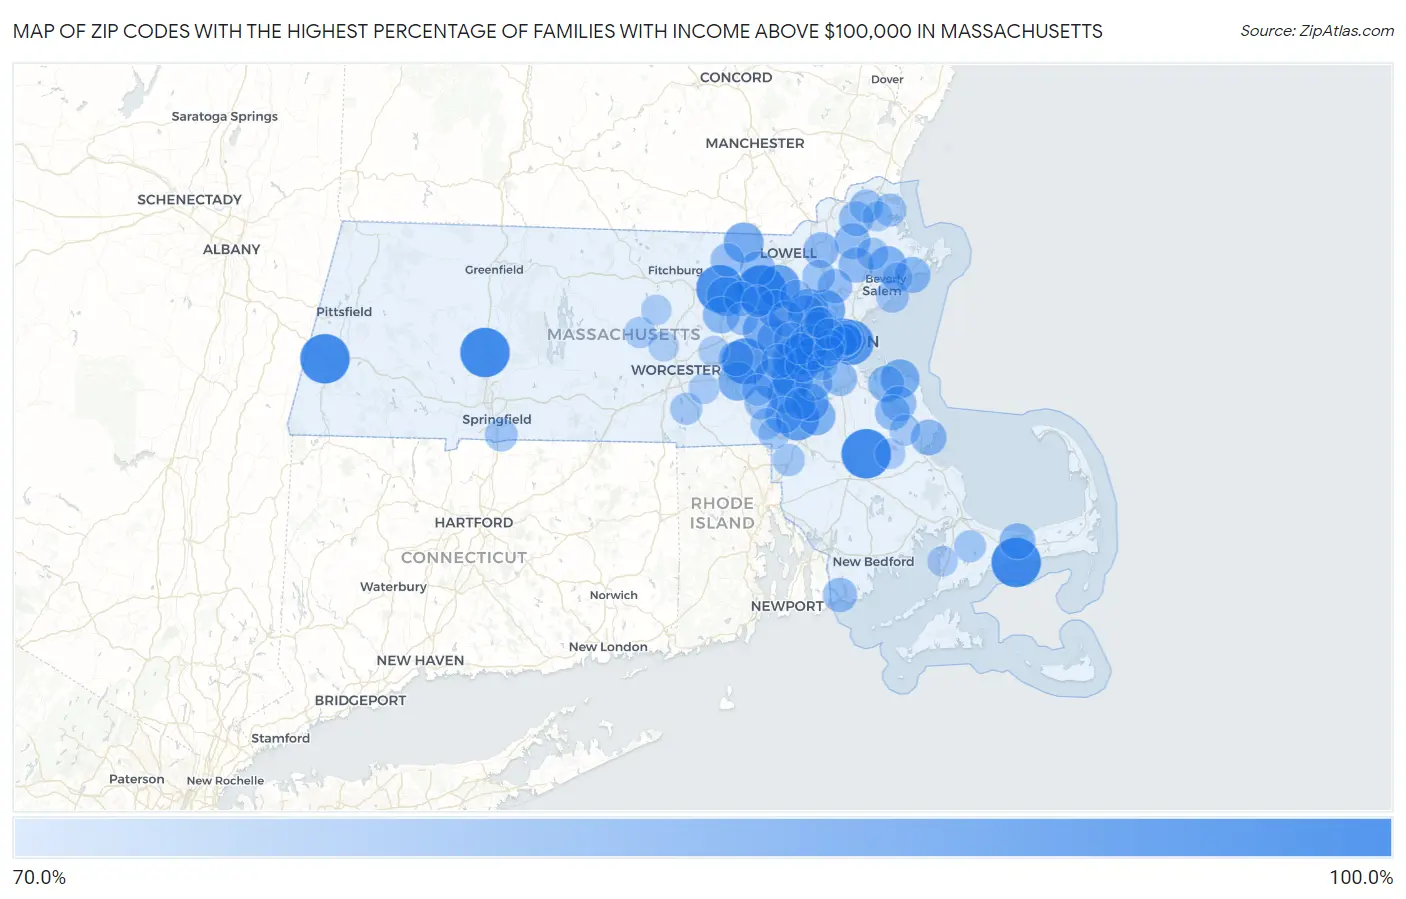
Map of Zip Codes with the Highest Percentage of Families with Income Above $100,000 in Massachusetts
70.0%
100.0%
Zip Codes with the Highest Percentage of Families with Income Above $100,000 in Massachusetts
| Zip Code | Families with Income > $100k | vs State | vs National | |
| 1. | 02325 | 100.0% | 59.5%(+40.5)#1 | 46.1%(+53.9)#8 |
| 2. | 01063 | 100.0% | 59.5%(+40.5)#2 | 46.1%(+53.9)#11 |
| 3. | 01718 | 100.0% | 59.5%(+40.5)#3 | 46.1%(+53.9)#21 |
| 4. | 02647 | 100.0% | 59.5%(+40.5)#4 | 46.1%(+53.9)#84 |
| 5. | 01229 | 100.0% | 59.5%(+40.5)#5 | 46.1%(+53.9)#105 |
| 6. | 01434 | 97.4% | 59.5%(+37.9)#6 | 46.1%(+51.3)#277 |
| 7. | 01745 | 95.5% | 59.5%(+36.0)#7 | 46.1%(+49.4)#286 |
| 8. | 02210 | 94.0% | 59.5%(+34.5)#8 | 46.1%(+47.9)#297 |
| 9. | 02071 | 92.0% | 59.5%(+32.5)#9 | 46.1%(+45.9)#324 |
| 10. | 02108 | 91.6% | 59.5%(+32.1)#10 | 46.1%(+45.5)#329 |
| 11. | 01741 | 91.1% | 59.5%(+31.6)#11 | 46.1%(+45.0)#338 |
| 12. | 02030 | 90.0% | 59.5%(+30.5)#12 | 46.1%(+43.9)#358 |
| 13. | 02468 | 89.1% | 59.5%(+29.6)#13 | 46.1%(+43.0)#391 |
| 14. | 01770 | 88.9% | 59.5%(+29.4)#14 | 46.1%(+42.8)#396 |
| 15. | 01890 | 88.2% | 59.5%(+28.7)#15 | 46.1%(+42.1)#414 |
| 16. | 02052 | 87.8% | 59.5%(+28.3)#16 | 46.1%(+41.7)#436 |
| 17. | 02481 | 87.7% | 59.5%(+28.2)#17 | 46.1%(+41.6)#443 |
| 18. | 02420 | 87.6% | 59.5%(+28.1)#18 | 46.1%(+41.5)#447 |
| 19. | 01827 | 87.6% | 59.5%(+28.1)#19 | 46.1%(+41.5)#449 |
| 20. | 01776 | 87.1% | 59.5%(+27.6)#20 | 46.1%(+41.0)#471 |
| 21. | 01451 | 87.0% | 59.5%(+27.5)#21 | 46.1%(+40.9)#474 |
| 22. | 02025 | 86.4% | 59.5%(+26.9)#22 | 46.1%(+40.3)#505 |
| 23. | 01748 | 86.1% | 59.5%(+26.6)#23 | 46.1%(+40.0)#521 |
| 24. | 02482 | 86.0% | 59.5%(+26.5)#24 | 46.1%(+39.9)#532 |
| 25. | 02067 | 85.5% | 59.5%(+26.0)#25 | 46.1%(+39.4)#563 |
| 26. | 01778 | 85.5% | 59.5%(+26.0)#26 | 46.1%(+39.4)#565 |
| 27. | 01984 | 85.2% | 59.5%(+25.7)#27 | 46.1%(+39.1)#577 |
| 28. | 02032 | 85.1% | 59.5%(+25.6)#28 | 46.1%(+39.0)#582 |
| 29. | 02467 | 85.0% | 59.5%(+25.5)#29 | 46.1%(+38.9)#587 |
| 30. | 01742 | 85.0% | 59.5%(+25.5)#30 | 46.1%(+38.9)#589 |
| 31. | 02494 | 84.1% | 59.5%(+24.6)#31 | 46.1%(+38.0)#659 |
| 32. | 02459 | 84.0% | 59.5%(+24.5)#32 | 46.1%(+37.9)#666 |
| 33. | 02421 | 84.0% | 59.5%(+24.5)#33 | 46.1%(+37.9)#667 |
| 34. | 02056 | 83.9% | 59.5%(+24.4)#34 | 46.1%(+37.8)#678 |
| 35. | 01740 | 83.5% | 59.5%(+24.0)#35 | 46.1%(+37.4)#705 |
| 36. | 02090 | 83.4% | 59.5%(+23.9)#36 | 46.1%(+37.3)#708 |
| 37. | 02043 | 83.1% | 59.5%(+23.6)#37 | 46.1%(+37.0)#731 |
| 38. | 01944 | 82.7% | 59.5%(+23.2)#38 | 46.1%(+36.6)#756 |
| 39. | 02630 | 82.7% | 59.5%(+23.2)#39 | 46.1%(+36.6)#758 |
| 40. | 02114 | 82.5% | 59.5%(+23.0)#40 | 46.1%(+36.4)#774 |
| 41. | 02460 | 82.5% | 59.5%(+23.0)#41 | 46.1%(+36.4)#775 |
| 42. | 02332 | 82.4% | 59.5%(+22.9)#42 | 46.1%(+36.3)#781 |
| 43. | 01921 | 82.3% | 59.5%(+22.8)#43 | 46.1%(+36.2)#789 |
| 44. | 01773 | 82.3% | 59.5%(+22.8)#44 | 46.1%(+36.2)#790 |
| 45. | 01810 | 81.9% | 59.5%(+22.4)#45 | 46.1%(+35.8)#810 |
| 46. | 01886 | 81.8% | 59.5%(+22.3)#46 | 46.1%(+35.7)#821 |
| 47. | 01949 | 81.8% | 59.5%(+22.3)#47 | 46.1%(+35.7)#827 |
| 48. | 02493 | 81.7% | 59.5%(+22.2)#48 | 46.1%(+35.6)#841 |
| 49. | 02061 | 81.6% | 59.5%(+22.1)#49 | 46.1%(+35.5)#855 |
| 50. | 02339 | 81.5% | 59.5%(+22.0)#50 | 46.1%(+35.4)#861 |
| 51. | 02465 | 81.3% | 59.5%(+21.8)#51 | 46.1%(+35.2)#885 |
| 52. | 01772 | 81.3% | 59.5%(+21.8)#52 | 46.1%(+35.2)#887 |
| 53. | 01760 | 81.2% | 59.5%(+21.7)#53 | 46.1%(+35.1)#897 |
| 54. | 01834 | 81.1% | 59.5%(+21.6)#54 | 46.1%(+35.0)#909 |
| 55. | 02478 | 81.0% | 59.5%(+21.5)#55 | 46.1%(+34.9)#912 |
| 56. | 02492 | 80.9% | 59.5%(+21.4)#56 | 46.1%(+34.8)#921 |
| 57. | 02186 | 80.8% | 59.5%(+21.3)#57 | 46.1%(+34.7)#931 |
| 58. | 01867 | 80.7% | 59.5%(+21.2)#58 | 46.1%(+34.6)#950 |
| 59. | 01719 | 80.7% | 59.5%(+21.2)#59 | 46.1%(+34.6)#959 |
| 60. | 02791 | 80.6% | 59.5%(+21.1)#60 | 46.1%(+34.5)#970 |
| 61. | 02053 | 80.1% | 59.5%(+20.6)#61 | 46.1%(+34.0)#1,018 |
| 62. | 01450 | 80.0% | 59.5%(+20.5)#62 | 46.1%(+33.9)#1,027 |
| 63. | 01985 | 79.4% | 59.5%(+19.9)#63 | 46.1%(+33.3)#1,096 |
| 64. | 01887 | 78.8% | 59.5%(+19.3)#64 | 46.1%(+32.7)#1,159 |
| 65. | 01945 | 78.8% | 59.5%(+19.3)#65 | 46.1%(+32.7)#1,161 |
| 66. | 01106 | 78.7% | 59.5%(+19.2)#66 | 46.1%(+32.6)#1,175 |
| 67. | 01951 | 78.6% | 59.5%(+19.1)#67 | 46.1%(+32.5)#1,193 |
| 68. | 01730 | 78.5% | 59.5%(+19.0)#68 | 46.1%(+32.4)#1,207 |
| 69. | 01775 | 78.5% | 59.5%(+19.0)#69 | 46.1%(+32.4)#1,210 |
| 70. | 02461 | 78.2% | 59.5%(+18.7)#70 | 46.1%(+32.1)#1,240 |
| 71. | 02458 | 78.0% | 59.5%(+18.5)#71 | 46.1%(+31.9)#1,259 |
| 72. | 02763 | 77.9% | 59.5%(+18.4)#72 | 46.1%(+31.8)#1,278 |
| 73. | 01720 | 77.8% | 59.5%(+18.3)#73 | 46.1%(+31.7)#1,285 |
| 74. | 01590 | 77.8% | 59.5%(+18.3)#74 | 46.1%(+31.7)#1,288 |
| 75. | 01983 | 77.8% | 59.5%(+18.3)#75 | 46.1%(+31.7)#1,289 |
| 76. | 02109 | 77.7% | 59.5%(+18.2)#76 | 46.1%(+31.6)#1,306 |
| 77. | 02644 | 77.6% | 59.5%(+18.1)#77 | 46.1%(+31.5)#1,327 |
| 78. | 02474 | 77.2% | 59.5%(+17.7)#78 | 46.1%(+31.1)#1,375 |
| 79. | 02116 | 77.2% | 59.5%(+17.7)#79 | 46.1%(+31.1)#1,376 |
| 80. | 01746 | 77.2% | 59.5%(+17.7)#80 | 46.1%(+31.1)#1,378 |
| 81. | 02110 | 77.1% | 59.5%(+17.6)#81 | 46.1%(+31.0)#1,395 |
| 82. | 02081 | 77.0% | 59.5%(+17.5)#82 | 46.1%(+30.9)#1,401 |
| 83. | 02038 | 76.9% | 59.5%(+17.4)#83 | 46.1%(+30.8)#1,409 |
| 84. | 02093 | 76.8% | 59.5%(+17.3)#84 | 46.1%(+30.7)#1,433 |
| 85. | 02462 | 76.8% | 59.5%(+17.3)#85 | 46.1%(+30.7)#1,444 |
| 86. | 02359 | 76.7% | 59.5%(+17.2)#86 | 46.1%(+30.6)#1,453 |
| 87. | 01543 | 76.7% | 59.5%(+17.2)#87 | 46.1%(+30.6)#1,458 |
| 88. | 02446 | 76.4% | 59.5%(+16.9)#88 | 46.1%(+30.3)#1,487 |
| 89. | 02476 | 76.2% | 59.5%(+16.7)#89 | 46.1%(+30.1)#1,528 |
| 90. | 02132 | 76.1% | 59.5%(+16.6)#90 | 46.1%(+30.0)#1,546 |
| 91. | 01532 | 76.1% | 59.5%(+16.6)#91 | 46.1%(+30.0)#1,548 |
| 92. | 02445 | 75.9% | 59.5%(+16.4)#92 | 46.1%(+29.8)#1,574 |
| 93. | 02138 | 75.8% | 59.5%(+16.3)#93 | 46.1%(+29.7)#1,586 |
| 94. | 02338 | 75.8% | 59.5%(+16.3)#94 | 46.1%(+29.7)#1,591 |
| 95. | 01519 | 75.8% | 59.5%(+16.3)#95 | 46.1%(+29.7)#1,592 |
| 96. | 01541 | 75.8% | 59.5%(+16.3)#96 | 46.1%(+29.7)#1,593 |
| 97. | 02556 | 75.8% | 59.5%(+16.3)#97 | 46.1%(+29.7)#1,595 |
| 98. | 01965 | 75.8% | 59.5%(+16.3)#98 | 46.1%(+29.7)#1,597 |
| 99. | 01520 | 75.7% | 59.5%(+16.2)#99 | 46.1%(+29.6)#1,603 |
| 100. | 01922 | 75.5% | 59.5%(+16.0)#100 | 46.1%(+29.4)#1,630 |
Common Questions
What are the Top 10 Zip Codes with the Highest Percentage of Families with Income Above $100,000 in Massachusetts?
Top 10 Zip Codes with the Highest Percentage of Families with Income Above $100,000 in Massachusetts are:
What zip code has the Highest Percentage of Families with Income Above $100,000 in Massachusetts?
02325 has the Highest Percentage of Families with Income Above $100,000 in Massachusetts with 100.0%.
What is the Percentage of Families with Income Above $100,000 in the State of Massachusetts?
Percentage of Families with Income Above $100,000 in Massachusetts is 59.5%.
What is the Percentage of Families with Income Above $100,000 in the United States?
Percentage of Families with Income Above $100,000 in the United States is 46.1%.