Zip Codes with the Highest Percentage of Population with a Degree in Physical and Health Sciences in Danville, IL
RELATED REPORTS & OPTIONS
Physical and Health Sciences
Danville
Compare Zip Codes
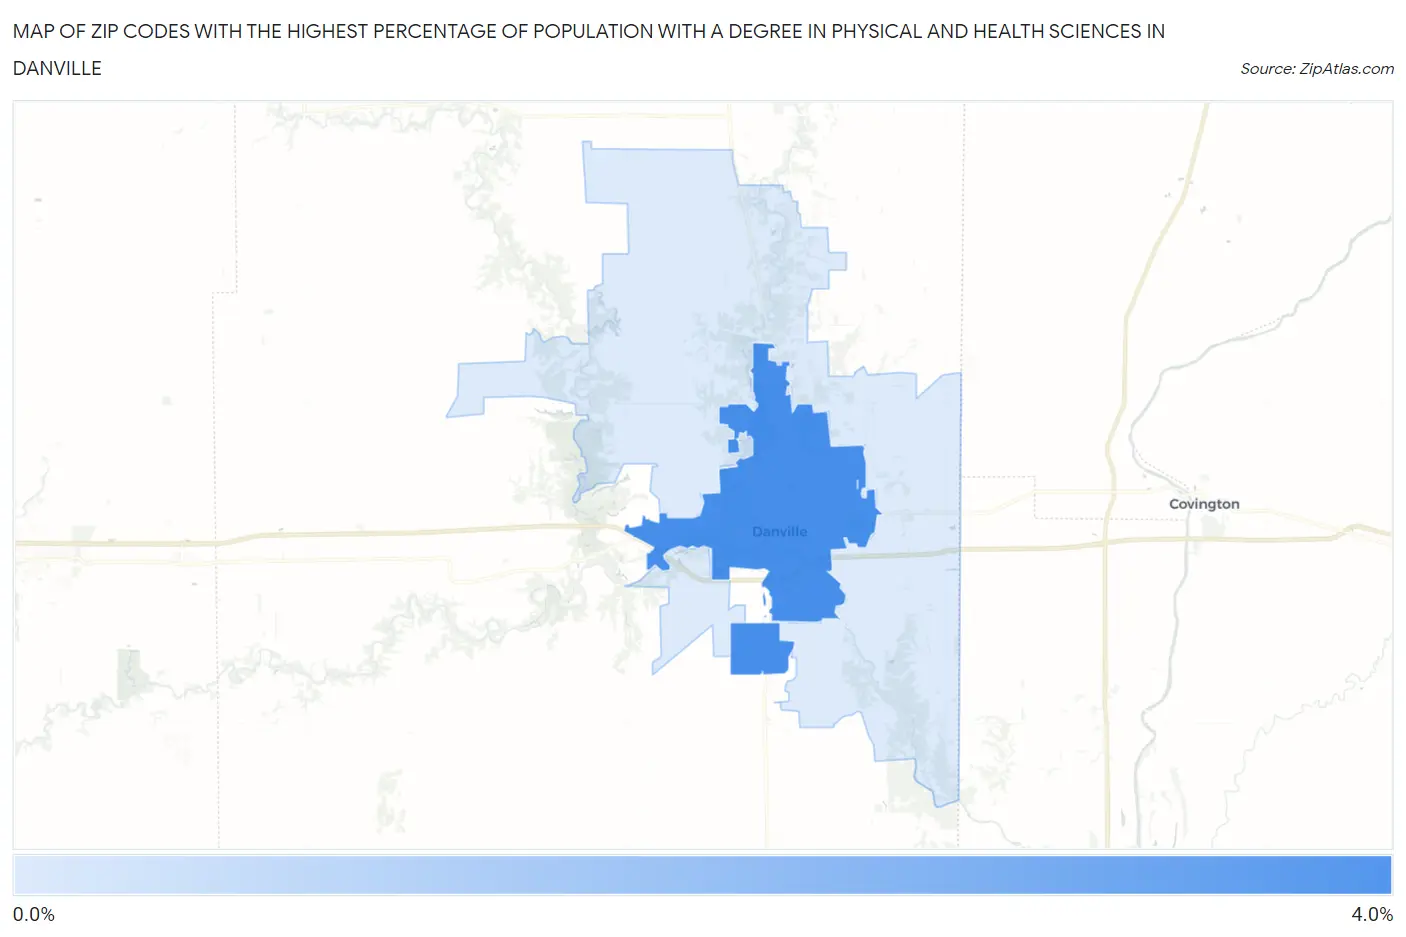
Map of Zip Codes with the Highest Percentage of Population with a Degree in Physical and Health Sciences in Danville
0.66%
3.5%
Zip Codes with the Highest Percentage of Population with a Degree in Physical and Health Sciences in Danville, IL
| Zip Code | % Graduates | vs State | vs National | |
| 1. | 61832 | 3.5% | 2.9%(+0.663)#308 | 3.1%(+0.430)#8,315 |
| 2. | 61834 | 0.66% | 2.9%(-2.20)#828 | 3.1%(-2.44)#20,238 |
1
Common Questions
What are the Top Zip Codes with the Highest Percentage of Population with a Degree in Physical and Health Sciences in Danville, IL?
Top Zip Codes with the Highest Percentage of Population with a Degree in Physical and Health Sciences in Danville, IL are:
What zip code has the Highest Percentage of Population with a Degree in Physical and Health Sciences in Danville, IL?
61832 has the Highest Percentage of Population with a Degree in Physical and Health Sciences in Danville, IL with 3.5%.
What is the Percentage of Population with a Degree in Physical and Health Sciences in Danville, IL?
Percentage of Population with a Degree in Physical and Health Sciences in Danville is 3.2%.
What is the Percentage of Population with a Degree in Physical and Health Sciences in Illinois?
Percentage of Population with a Degree in Physical and Health Sciences in Illinois is 2.9%.
What is the Percentage of Population with a Degree in Physical and Health Sciences in the United States?
Percentage of Population with a Degree in Physical and Health Sciences in the United States is 3.1%.