Zip Codes with the Highest Percentage of Population with a Degree in Physical and Health Sciences in Illinois
RELATED REPORTS & OPTIONS
Physical and Health Sciences
Illinois
Compare Zip Codes
Map of Zip Codes with the Highest Percentage of Population with a Degree in Physical and Health Sciences in Illinois
0.0%
60.0%
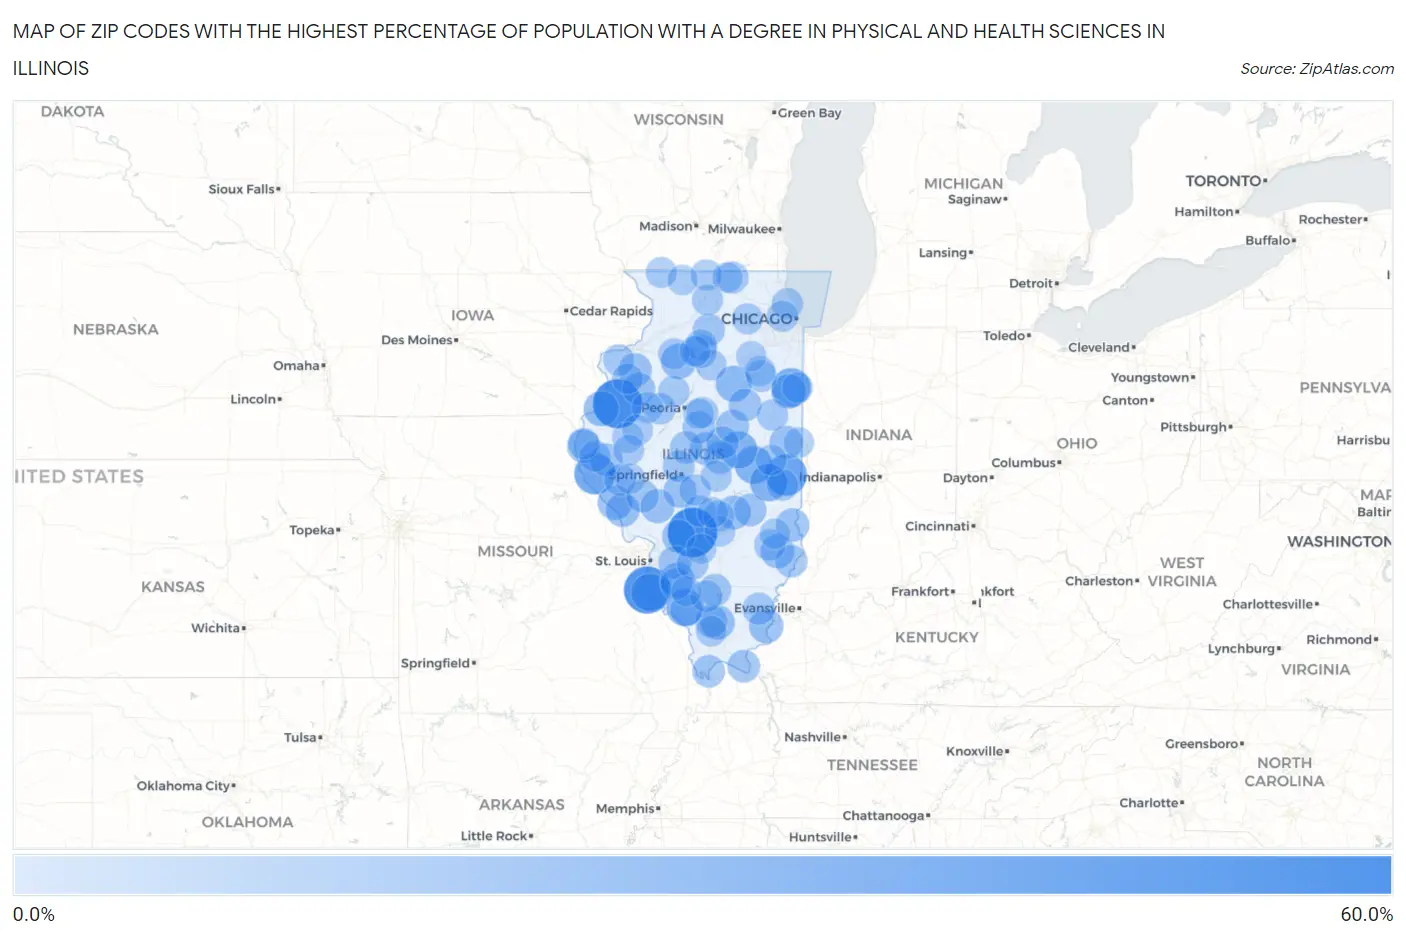
Zip Codes with the Highest Percentage of Population with a Degree in Physical and Health Sciences in Illinois
| Zip Code | % Graduates | vs State | vs National | |
| 1. | 62019 | 56.0% | 2.9% (+53.1)#1 | 3.1% (+52.9)#48 |
| 2. | 61478 | 54.5% | 2.9% (+51.7)#2 | 3.1% (+51.4)#52 |
| 3. | 62256 | 50.0% | 2.9% (+47.1)#3 | 3.1% (+46.9)#69 |
| 4. | 61940 | 35.7% | 2.9% (+32.8)#4 | 3.1% (+32.6)#132 |
| 5. | 62365 | 35.0% | 2.9% (+32.1)#5 | 3.1% (+31.9)#136 |
| 6. | 60956 | 29.4% | 2.9% (+26.5)#6 | 3.1% (+26.3)#196 |
| 7. | 62244 | 26.5% | 2.9% (+23.7)#7 | 3.1% (+23.4)#241 |
| 8. | 61872 | 26.2% | 2.9% (+23.3)#8 | 3.1% (+23.1)#247 |
| 9. | 61930 | 25.7% | 2.9% (+22.8)#9 | 3.1% (+22.6)#258 |
| 10. | 62997 | 25.0% | 2.9% (+22.1)#10 | 3.1% (+21.9)#272 |
| 11. | 61839 | 25.0% | 2.9% (+22.1)#11 | 3.1% (+21.9)#273 |
| 12. | 61319 | 21.9% | 2.9% (+19.1)#12 | 3.1% (+18.8)#351 |
| 13. | 61314 | 20.7% | 2.9% (+17.8)#13 | 3.1% (+17.6)#386 |
| 14. | 61454 | 19.7% | 2.9% (+16.8)#14 | 3.1% (+16.6)#418 |
| 15. | 62282 | 18.6% | 2.9% (+15.7)#15 | 3.1% (+15.5)#468 |
| 16. | 62355 | 18.5% | 2.9% (+15.6)#16 | 3.1% (+15.4)#472 |
| 17. | 60951 | 18.5% | 2.9% (+15.6)#17 | 3.1% (+15.4)#473 |
| 18. | 62933 | 17.6% | 2.9% (+14.7)#18 | 3.1% (+14.5)#520 |
| 19. | 62984 | 17.5% | 2.9% (+14.6)#19 | 3.1% (+14.4)#525 |
| 20. | 62649 | 16.7% | 2.9% (+13.8)#20 | 3.1% (+13.6)#562 |
| 21. | 62444 | 16.7% | 2.9% (+13.8)#21 | 3.1% (+13.6)#563 |
| 22. | 62421 | 16.7% | 2.9% (+13.8)#22 | 3.1% (+13.6)#564 |
| 23. | 62053 | 16.7% | 2.9% (+13.8)#23 | 3.1% (+13.6)#567 |
| 24. | 61465 | 15.8% | 2.9% (+13.0)#24 | 3.1% (+12.7)#610 |
| 25. | 62433 | 15.6% | 2.9% (+12.8)#25 | 3.1% (+12.5)#619 |
| 26. | 61337 | 15.4% | 2.9% (+12.5)#26 | 3.1% (+12.3)#638 |
| 27. | 62348 | 15.4% | 2.9% (+12.5)#27 | 3.1% (+12.3)#642 |
| 28. | 61831 | 15.4% | 2.9% (+12.5)#28 | 3.1% (+12.3)#643 |
| 29. | 62074 | 15.1% | 2.9% (+12.3)#29 | 3.1% (+12.0)#664 |
| 30. | 62530 | 15.1% | 2.9% (+12.3)#30 | 3.1% (+12.0)#666 |
| 31. | 62289 | 14.8% | 2.9% (+11.9)#31 | 3.1% (+11.7)#685 |
| 32. | 62324 | 14.7% | 2.9% (+11.8)#32 | 3.1% (+11.6)#693 |
| 33. | 61737 | 14.7% | 2.9% (+11.8)#33 | 3.1% (+11.6)#695 |
| 34. | 62512 | 14.1% | 2.9% (+11.3)#34 | 3.1% (+11.0)#754 |
| 35. | 61402 | 14.0% | 2.9% (+11.1)#35 | 3.1% (+10.9)#762 |
| 36. | 61756 | 14.0% | 2.9% (+11.1)#36 | 3.1% (+10.9)#765 |
| 37. | 61739 | 13.7% | 2.9% (+10.8)#37 | 3.1% (+10.6)#798 |
| 38. | 62910 | 13.7% | 2.9% (+10.8)#38 | 3.1% (+10.6)#799 |
| 39. | 62447 | 13.5% | 2.9% (+10.6)#39 | 3.1% (+10.4)#821 |
| 40. | 62671 | 13.2% | 2.9% (+10.3)#40 | 3.1% (+10.1)#850 |
| 41. | 62963 | 13.2% | 2.9% (+10.3)#41 | 3.1% (+10.1)#855 |
| 42. | 61777 | 13.1% | 2.9% (+10.3)#42 | 3.1% (+10.0)#858 |
| 43. | 62915 | 13.0% | 2.9% (+10.2)#43 | 3.1% (+9.94)#869 |
| 44. | 62082 | 13.0% | 2.9% (+10.1)#44 | 3.1% (+9.90)#880 |
| 45. | 62460 | 13.0% | 2.9% (+10.1)#45 | 3.1% (+9.90)#881 |
| 46. | 61759 | 12.8% | 2.9% (+9.95)#46 | 3.1% (+9.72)#895 |
| 47. | 62916 | 12.8% | 2.9% (+9.90)#47 | 3.1% (+9.67)#904 |
| 48. | 62894 | 12.7% | 2.9% (+9.81)#48 | 3.1% (+9.58)#916 |
| 49. | 62869 | 12.6% | 2.9% (+9.76)#49 | 3.1% (+9.53)#922 |
| 50. | 61378 | 12.5% | 2.9% (+9.63)#50 | 3.1% (+9.40)#943 |
| 51. | 62888 | 12.1% | 2.9% (+9.24)#51 | 3.1% (+9.00)#995 |
| 52. | 62257 | 12.0% | 2.9% (+9.10)#52 | 3.1% (+8.87)#1,008 |
| 53. | 62625 | 12.0% | 2.9% (+9.09)#53 | 3.1% (+8.86)#1,010 |
| 54. | 61012 | 11.8% | 2.9% (+8.95)#54 | 3.1% (+8.72)#1,030 |
| 55. | 62219 | 11.5% | 2.9% (+8.59)#55 | 3.1% (+8.36)#1,084 |
| 56. | 62425 | 11.0% | 2.9% (+8.15)#56 | 3.1% (+7.92)#1,157 |
| 57. | 62075 | 10.7% | 2.9% (+7.85)#57 | 3.1% (+7.61)#1,218 |
| 58. | 62340 | 10.7% | 2.9% (+7.85)#58 | 3.1% (+7.61)#1,219 |
| 59. | 62540 | 10.7% | 2.9% (+7.80)#59 | 3.1% (+7.57)#1,228 |
| 60. | 61330 | 10.6% | 2.9% (+7.77)#60 | 3.1% (+7.54)#1,233 |
| 61. | 62325 | 10.6% | 2.9% (+7.72)#61 | 3.1% (+7.49)#1,245 |
| 62. | 60029 | 10.6% | 2.9% (+7.71)#62 | 3.1% (+7.48)#1,246 |
| 63. | 61949 | 10.5% | 2.9% (+7.66)#63 | 3.1% (+7.43)#1,258 |
| 64. | 61531 | 10.5% | 2.9% (+7.64)#64 | 3.1% (+7.40)#1,262 |
| 65. | 61279 | 10.4% | 2.9% (+7.53)#65 | 3.1% (+7.30)#1,275 |
| 66. | 62379 | 10.4% | 2.9% (+7.52)#66 | 3.1% (+7.28)#1,278 |
| 67. | 60918 | 10.4% | 2.9% (+7.51)#67 | 3.1% (+7.28)#1,280 |
| 68. | 60165 | 10.3% | 2.9% (+7.44)#68 | 3.1% (+7.21)#1,299 |
| 69. | 61559 | 10.2% | 2.9% (+7.34)#69 | 3.1% (+7.11)#1,321 |
| 70. | 60961 | 10.2% | 2.9% (+7.30)#70 | 3.1% (+7.07)#1,328 |
| 71. | 61544 | 10.0% | 2.9% (+7.13)#71 | 3.1% (+6.90)#1,360 |
| 72. | 62514 | 10.0% | 2.9% (+7.13)#72 | 3.1% (+6.90)#1,365 |
| 73. | 62431 | 9.9% | 2.9% (+6.99)#73 | 3.1% (+6.76)#1,405 |
| 74. | 61361 | 9.8% | 2.9% (+6.97)#74 | 3.1% (+6.74)#1,408 |
| 75. | 61079 | 9.8% | 2.9% (+6.89)#75 | 3.1% (+6.66)#1,423 |
| 76. | 61084 | 9.7% | 2.9% (+6.86)#76 | 3.1% (+6.63)#1,428 |
| 77. | 61087 | 9.5% | 2.9% (+6.68)#77 | 3.1% (+6.45)#1,482 |
| 78. | 60119 | 9.5% | 2.9% (+6.60)#78 | 3.1% (+6.37)#1,505 |
| 79. | 61742 | 9.4% | 2.9% (+6.53)#79 | 3.1% (+6.29)#1,524 |
| 80. | 61877 | 9.3% | 2.9% (+6.43)#80 | 3.1% (+6.19)#1,554 |
| 81. | 61440 | 9.2% | 2.9% (+6.36)#81 | 3.1% (+6.13)#1,577 |
| 82. | 61482 | 9.1% | 2.9% (+6.22)#82 | 3.1% (+5.99)#1,633 |
| 83. | 61316 | 9.1% | 2.9% (+6.22)#83 | 3.1% (+5.99)#1,638 |
| 84. | 61323 | 9.1% | 2.9% (+6.22)#84 | 3.1% (+5.99)#1,640 |
| 85. | 62418 | 9.0% | 2.9% (+6.09)#85 | 3.1% (+5.86)#1,676 |
| 86. | 61412 | 8.9% | 2.9% (+6.04)#86 | 3.1% (+5.81)#1,698 |
| 87. | 62553 | 8.9% | 2.9% (+5.99)#87 | 3.1% (+5.76)#1,715 |
| 88. | 62681 | 8.7% | 2.9% (+5.80)#88 | 3.1% (+5.57)#1,777 |
| 89. | 60474 | 8.6% | 2.9% (+5.78)#89 | 3.1% (+5.54)#1,787 |
| 90. | 62902 | 8.6% | 2.9% (+5.76)#90 | 3.1% (+5.53)#1,793 |
| 91. | 61733 | 8.4% | 2.9% (+5.51)#91 | 3.1% (+5.27)#1,876 |
| 92. | 62621 | 8.3% | 2.9% (+5.47)#92 | 3.1% (+5.23)#1,888 |
| 93. | 60912 | 8.3% | 2.9% (+5.47)#93 | 3.1% (+5.23)#1,892 |
| 94. | 61814 | 8.2% | 2.9% (+5.38)#94 | 3.1% (+5.15)#1,921 |
| 95. | 61013 | 8.2% | 2.9% (+5.38)#95 | 3.1% (+5.15)#1,924 |
| 96. | 61065 | 8.1% | 2.9% (+5.24)#96 | 3.1% (+5.01)#1,973 |
| 97. | 62253 | 8.1% | 2.9% (+5.24)#97 | 3.1% (+5.01)#1,977 |
| 98. | 62480 | 8.1% | 2.9% (+5.20)#98 | 3.1% (+4.96)#1,992 |
| 99. | 62237 | 7.8% | 2.9% (+4.97)#99 | 3.1% (+4.74)#2,082 |
| 100. | 60450 | 7.8% | 2.9% (+4.94)#100 | 3.1% (+4.70)#2,098 |
Common Questions
What are the Top 10 Zip Codes with the Highest Percentage of Population with a Degree in Physical and Health Sciences in Illinois?
Top 10 Zip Codes with the Highest Percentage of Population with a Degree in Physical and Health Sciences in Illinois are:
What zip code has the Highest Percentage of Population with a Degree in Physical and Health Sciences in Illinois?
62019 has the Highest Percentage of Population with a Degree in Physical and Health Sciences in Illinois with 56.0%.
What is the Percentage of Population with a Degree in Physical and Health Sciences in the State of Illinois?
Percentage of Population with a Degree in Physical and Health Sciences in Illinois is 2.9%.
What is the Percentage of Population with a Degree in Physical and Health Sciences in the United States?
Percentage of Population with a Degree in Physical and Health Sciences in the United States is 3.1%.