Cities with the Highest Percentage of Slovene Population in Minnesota
RELATED REPORTS & OPTIONS
Slovene
Minnesota
Compare Cities
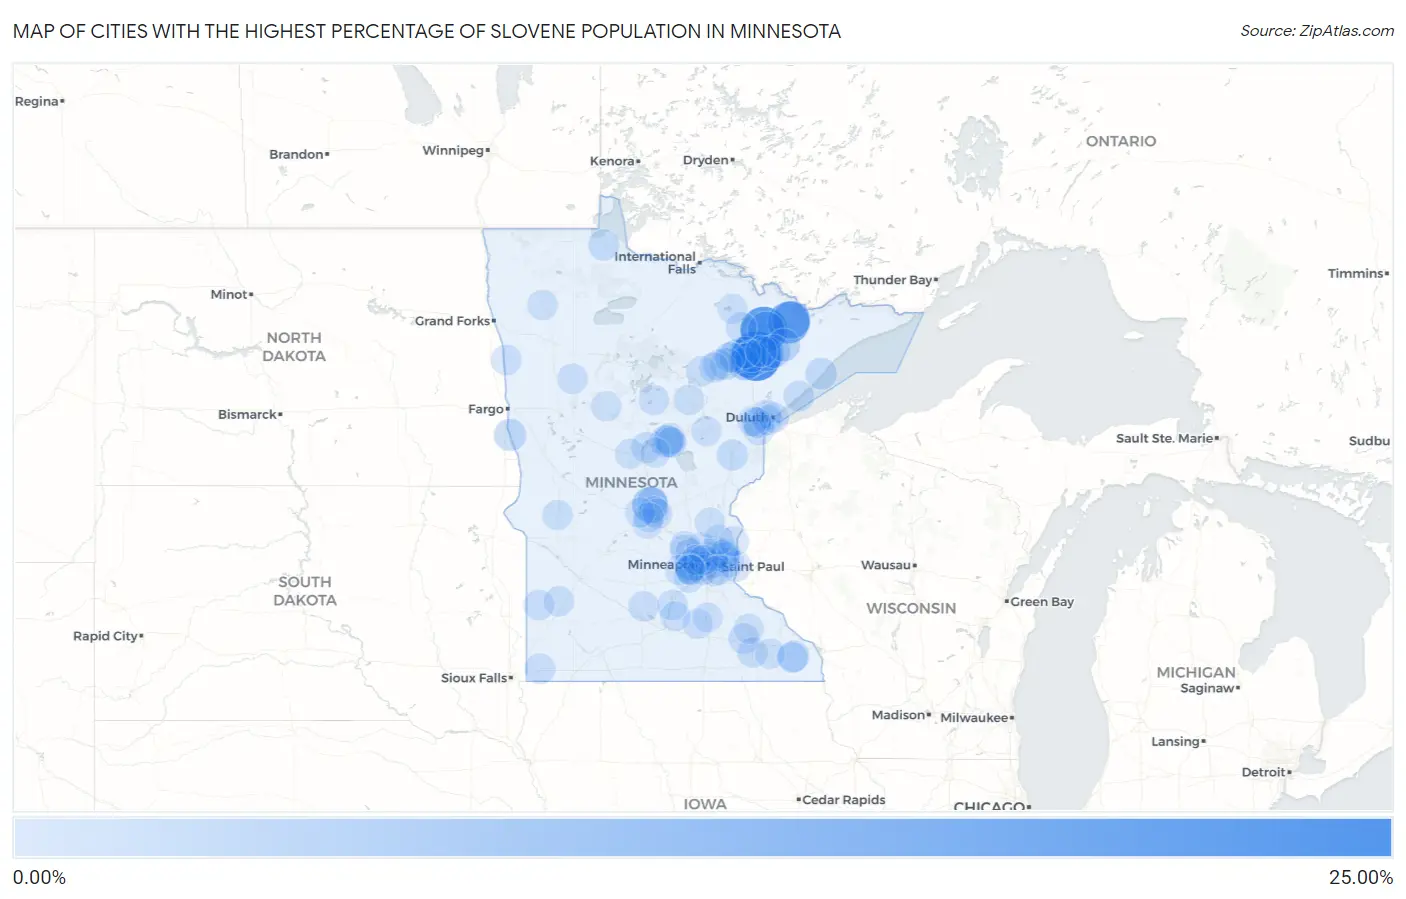
Map of Cities with the Highest Percentage of Slovene Population in Minnesota
0.00%
25.00%
Cities with the Highest Percentage of Slovene Population in Minnesota
| City | Slovene | vs State | vs National | |
| 1. | Mckinley | 21.15% | 0.15%(+21.0)#1 | 0.052%(+21.1)#3 |
| 2. | Tower | 17.80% | 0.15%(+17.7)#2 | 0.052%(+17.8)#4 |
| 3. | Ely | 12.59% | 0.15%(+12.4)#3 | 0.052%(+12.5)#9 |
| 4. | Winton | 8.41% | 0.15%(+8.26)#4 | 0.052%(+8.36)#19 |
| 5. | Soudan | 7.33% | 0.15%(+7.17)#5 | 0.052%(+7.28)#25 |
| 6. | St Stephen | 6.14% | 0.15%(+5.98)#6 | 0.052%(+6.09)#37 |
| 7. | Gilbert | 5.99% | 0.15%(+5.83)#7 | 0.052%(+5.93)#38 |
| 8. | Eveleth | 5.83% | 0.15%(+5.67)#8 | 0.052%(+5.78)#41 |
| 9. | Aurora | 5.13% | 0.15%(+4.97)#9 | 0.052%(+5.08)#47 |
| 10. | Buhl | 3.70% | 0.15%(+3.54)#10 | 0.052%(+3.64)#71 |
| 11. | Iron Junction | 3.53% | 0.15%(+3.37)#11 | 0.052%(+3.48)#76 |
| 12. | Hoyt Lakes | 3.44% | 0.15%(+3.28)#12 | 0.052%(+3.39)#79 |
| 13. | Babbitt | 2.98% | 0.15%(+2.82)#13 | 0.052%(+2.93)#94 |
| 14. | Ironton | 2.50% | 0.15%(+2.35)#14 | 0.052%(+2.45)#116 |
| 15. | Wolverton | 2.13% | 0.15%(+1.97)#15 | 0.052%(+2.08)#132 |
| 16. | Virginia | 1.91% | 0.15%(+1.76)#16 | 0.052%(+1.86)#156 |
| 17. | Mountain Iron | 1.78% | 0.15%(+1.63)#17 | 0.052%(+1.73)#167 |
| 18. | Hibbing | 1.78% | 0.15%(+1.62)#18 | 0.052%(+1.72)#168 |
| 19. | Silver Bay | 1.72% | 0.15%(+1.56)#19 | 0.052%(+1.66)#177 |
| 20. | Rushford | 1.60% | 0.15%(+1.44)#20 | 0.052%(+1.55)#191 |
| 21. | White Bear Lake | 1.47% | 0.15%(+1.31)#21 | 0.052%(+1.42)#217 |
| 22. | Biwabik | 1.31% | 0.15%(+1.15)#22 | 0.052%(+1.26)#239 |
| 23. | Cuyuna | 1.21% | 0.15%(+1.06)#23 | 0.052%(+1.16)#254 |
| 24. | Esko | 1.20% | 0.15%(+1.04)#24 | 0.052%(+1.15)#260 |
| 25. | Roosevelt | 1.14% | 0.15%(+0.988)#25 | 0.052%(+1.09)#273 |
| 26. | Willow River | 1.09% | 0.15%(+0.932)#26 | 0.052%(+1.04)#296 |
| 27. | Crosby | 0.99% | 0.15%(+0.838)#27 | 0.052%(+0.941)#320 |
| 28. | East Gull Lake | 0.97% | 0.15%(+0.819)#28 | 0.052%(+0.922)#332 |
| 29. | Orono | 0.96% | 0.15%(+0.806)#29 | 0.052%(+0.909)#336 |
| 30. | Medicine Lake | 0.95% | 0.15%(+0.800)#30 | 0.052%(+0.903)#339 |
| 31. | Wayzata | 0.94% | 0.15%(+0.784)#31 | 0.052%(+0.888)#343 |
| 32. | Circle Pines | 0.88% | 0.15%(+0.726)#32 | 0.052%(+0.829)#365 |
| 33. | Cook | 0.87% | 0.15%(+0.717)#33 | 0.052%(+0.820)#368 |
| 34. | Byron | 0.85% | 0.15%(+0.693)#34 | 0.052%(+0.796)#380 |
| 35. | Keewatin | 0.84% | 0.15%(+0.682)#35 | 0.052%(+0.785)#383 |
| 36. | Two Harbors | 0.75% | 0.15%(+0.591)#36 | 0.052%(+0.694)#438 |
| 37. | Chisholm | 0.71% | 0.15%(+0.560)#37 | 0.052%(+0.663)#462 |
| 38. | Hermantown | 0.68% | 0.15%(+0.526)#38 | 0.052%(+0.629)#487 |
| 39. | Luverne | 0.67% | 0.15%(+0.517)#39 | 0.052%(+0.620)#493 |
| 40. | Deerwood | 0.63% | 0.15%(+0.480)#40 | 0.052%(+0.583)#513 |
| 41. | Rushford Village | 0.56% | 0.15%(+0.405)#41 | 0.052%(+0.509)#560 |
| 42. | Wrenshall | 0.55% | 0.15%(+0.398)#42 | 0.052%(+0.501)#566 |
| 43. | Lakeland | 0.55% | 0.15%(+0.395)#43 | 0.052%(+0.498)#568 |
| 44. | Longville | 0.54% | 0.15%(+0.386)#44 | 0.052%(+0.489)#582 |
| 45. | Lake Elmo | 0.54% | 0.15%(+0.385)#45 | 0.052%(+0.488)#584 |
| 46. | Lafayette | 0.54% | 0.15%(+0.384)#46 | 0.052%(+0.487)#585 |
| 47. | Le Sueur | 0.52% | 0.15%(+0.368)#47 | 0.052%(+0.471)#602 |
| 48. | Shelly | 0.52% | 0.15%(+0.366)#48 | 0.052%(+0.469)#605 |
| 49. | Ivanhoe | 0.50% | 0.15%(+0.349)#49 | 0.052%(+0.452)#620 |
| 50. | Falcon Heights | 0.50% | 0.15%(+0.342)#50 | 0.052%(+0.445)#627 |
| 51. | Taconite | 0.48% | 0.15%(+0.325)#51 | 0.052%(+0.428)#656 |
| 52. | Hanover | 0.46% | 0.15%(+0.308)#52 | 0.052%(+0.412)#679 |
| 53. | Twin Lakes | 0.46% | 0.15%(+0.306)#53 | 0.052%(+0.409)#686 |
| 54. | Ghent | 0.44% | 0.15%(+0.283)#54 | 0.052%(+0.386)#725 |
| 55. | Stewartville | 0.43% | 0.15%(+0.279)#55 | 0.052%(+0.382)#733 |
| 56. | St Anthony City Hennepin And Ramsey Counties | 0.42% | 0.15%(+0.263)#56 | 0.052%(+0.366)#749 |
| 57. | Proctor | 0.42% | 0.15%(+0.263)#57 | 0.052%(+0.366)#750 |
| 58. | Duluth | 0.42% | 0.15%(+0.261)#58 | 0.052%(+0.364)#753 |
| 59. | Morris | 0.41% | 0.15%(+0.257)#59 | 0.052%(+0.361)#762 |
| 60. | St Michael | 0.41% | 0.15%(+0.253)#60 | 0.052%(+0.356)#768 |
| 61. | Hill City | 0.39% | 0.15%(+0.231)#61 | 0.052%(+0.334)#797 |
| 62. | Mahtomedi | 0.37% | 0.15%(+0.217)#62 | 0.052%(+0.320)#829 |
| 63. | St Louis Park | 0.37% | 0.15%(+0.215)#63 | 0.052%(+0.318)#833 |
| 64. | Rice | 0.37% | 0.15%(+0.214)#64 | 0.052%(+0.317)#835 |
| 65. | Corcoran | 0.37% | 0.15%(+0.212)#65 | 0.052%(+0.315)#843 |
| 66. | Excelsior | 0.35% | 0.15%(+0.200)#66 | 0.052%(+0.303)#857 |
| 67. | Arden Hills | 0.35% | 0.15%(+0.192)#67 | 0.052%(+0.295)#879 |
| 68. | Thief River Falls | 0.33% | 0.15%(+0.172)#68 | 0.052%(+0.275)#916 |
| 69. | Chatfield | 0.33% | 0.15%(+0.172)#69 | 0.052%(+0.275)#918 |
| 70. | Motley | 0.31% | 0.15%(+0.154)#70 | 0.052%(+0.257)#955 |
| 71. | Rockville | 0.31% | 0.15%(+0.153)#71 | 0.052%(+0.257)#959 |
| 72. | Sartell | 0.30% | 0.15%(+0.150)#72 | 0.052%(+0.253)#968 |
| 73. | Scanlon | 0.29% | 0.15%(+0.132)#73 | 0.052%(+0.235)#1,017 |
| 74. | Chaska | 0.28% | 0.15%(+0.130)#74 | 0.052%(+0.233)#1,029 |
| 75. | Sauk Rapids | 0.28% | 0.15%(+0.127)#75 | 0.052%(+0.230)#1,039 |
| 76. | Cleveland | 0.28% | 0.15%(+0.123)#76 | 0.052%(+0.226)#1,053 |
| 77. | Nashwauk | 0.27% | 0.15%(+0.120)#77 | 0.052%(+0.223)#1,060 |
| 78. | St Joseph | 0.27% | 0.15%(+0.114)#78 | 0.052%(+0.217)#1,082 |
| 79. | Park Rapids | 0.26% | 0.15%(+0.109)#79 | 0.052%(+0.213)#1,096 |
| 80. | Cloquet | 0.26% | 0.15%(+0.108)#80 | 0.052%(+0.211)#1,098 |
| 81. | Edina | 0.26% | 0.15%(+0.104)#81 | 0.052%(+0.207)#1,110 |
| 82. | St Bonifacius | 0.26% | 0.15%(+0.101)#82 | 0.052%(+0.204)#1,119 |
| 83. | Orr | 0.25% | 0.15%(+0.100)#83 | 0.052%(+0.203)#1,123 |
| 84. | Brainerd | 0.25% | 0.15%(+0.095)#84 | 0.052%(+0.198)#1,145 |
| 85. | Champlin | 0.25% | 0.15%(+0.090)#85 | 0.052%(+0.193)#1,165 |
| 86. | Dellwood | 0.24% | 0.15%(+0.090)#86 | 0.052%(+0.193)#1,167 |
| 87. | Plymouth | 0.24% | 0.15%(+0.085)#87 | 0.052%(+0.189)#1,182 |
| 88. | Mendota Heights | 0.23% | 0.15%(+0.077)#88 | 0.052%(+0.180)#1,211 |
| 89. | Mcgregor | 0.22% | 0.15%(+0.069)#89 | 0.052%(+0.172)#1,236 |
| 90. | Morristown | 0.22% | 0.15%(+0.065)#90 | 0.052%(+0.168)#1,250 |
| 91. | Columbus | 0.22% | 0.15%(+0.061)#91 | 0.052%(+0.164)#1,267 |
| 92. | Avon | 0.21% | 0.15%(+0.058)#92 | 0.052%(+0.161)#1,277 |
| 93. | Robbinsdale | 0.21% | 0.15%(+0.053)#93 | 0.052%(+0.156)#1,293 |
| 94. | Tonka Bay | 0.21% | 0.15%(+0.050)#94 | 0.052%(+0.153)#1,298 |
| 95. | West St Paul | 0.20% | 0.15%(+0.047)#95 | 0.052%(+0.150)#1,310 |
| 96. | Faribault | 0.20% | 0.15%(+0.042)#96 | 0.052%(+0.145)#1,329 |
| 97. | Shorewood | 0.19% | 0.15%(+0.039)#97 | 0.052%(+0.143)#1,339 |
| 98. | Isanti | 0.19% | 0.15%(+0.035)#98 | 0.052%(+0.138)#1,365 |
| 99. | Oronoco | 0.18% | 0.15%(+0.022)#99 | 0.052%(+0.125)#1,424 |
| 100. | Scandia | 0.18% | 0.15%(+0.022)#100 | 0.052%(+0.125)#1,426 |
Common Questions
What are the Top 10 Cities with the Highest Percentage of Slovene Population in Minnesota?
Top 10 Cities with the Highest Percentage of Slovene Population in Minnesota are:
What city has the Highest Percentage of Slovene Population in Minnesota?
McKinley has the Highest Percentage of Slovene Population in Minnesota with 21.15%.
What is the Percentage of Slovene Population in the State of Minnesota?
Percentage of Slovene Population in Minnesota is 0.15%.
What is the Percentage of Slovene Population in the United States?
Percentage of Slovene Population in the United States is 0.052%.